Download File
Download File
Download File

Create successful ePaper yourself
Turn your PDF publications into a flip-book with our unique Google optimized e-Paper software.
Section 3.6 Nonlinear Models 253<br />
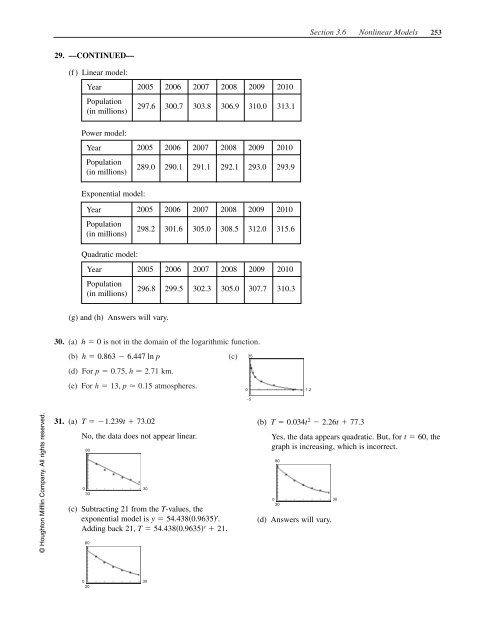
29. ––CONTINUED––<br />
(f ) Linear model:<br />
Year 2005 2006 2007 2008 2009 2010<br />
Population<br />
(in millions)<br />
297.6 300.7 303.8 306.9 310.0 313.1<br />
Power model:<br />
Year 2005 2006 2007 2008 2009 2010<br />
Population<br />
(in millions)<br />
289.0 290.1 291.1 292.1 293.0 293.9<br />
Exponential model:<br />
Year 2005 2006 2007 2008 2009 2010<br />
Population<br />
(in millions)<br />
298.2 301.6 305.0 308.5 312.0 315.6<br />
Quadratic model:<br />
Year 2005 2006 2007 2008 2009 2010<br />
Population<br />
(in millions)<br />
296.8 299.5 302.3 305.0 307.7 310.3<br />
(g) and (h) Answers will vary.<br />
30. (a) h 0 is not in the domain of the logarithmic function.<br />
(b) h 0.863 6.447 ln p<br />
(c)<br />
(d) For p 0.75, h 2.71 km.<br />
(e) For h 13, p 0.15 atmospheres.<br />
35<br />
0<br />
1.2<br />
−5<br />
© Houghton Mifflin Company. All rights reserved.<br />
31. (a)<br />
T 1.239t 73.02<br />
No, the data does not appear linear.<br />
80<br />
0 30<br />
30<br />
(c) Subtracting 21 from the T-values, the<br />
exponential model is y 54.4380.9635 t .<br />
Adding back 21, T 54.4380.9635 t 21.<br />
80<br />
(b)<br />
T 0.034t 2 2.26t 77.3<br />
Yes, the data appears quadratic. But, for t 60, the<br />
graph is increasing, which is incorrect.<br />
80<br />
0 30<br />
30<br />
(d) Answers will vary.<br />
0 30<br />
30