Download File
Download File
Download File

You also want an ePaper? Increase the reach of your titles
YUMPU automatically turns print PDFs into web optimized ePapers that Google loves.
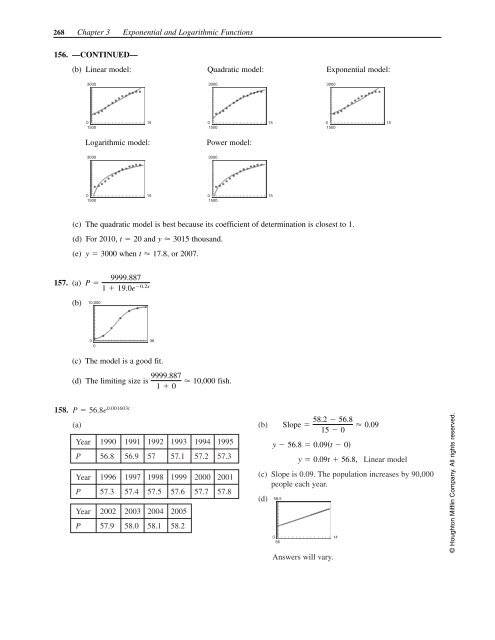
268 Chapter 3 Exponential and Logarithmic Functions<br />
156. ––CONTINUED––<br />
(b) Linear model: Quadratic model: Exponential model:<br />
3000<br />
3000<br />
3000<br />
0 15<br />
1500<br />
Logarithmic model:<br />
0 15<br />
1500<br />
Power model:<br />
0 15<br />
1500<br />
3000<br />
3000<br />
0 15<br />
1500<br />
0 15<br />
1500<br />
(c) The quadratic model is best because its coefficient of determination is closest to 1.<br />
(d) For 2010, t 20 and y 3015 thousand.<br />
(e) y 3000 when t 17.8, or 2007.<br />
157. (a)<br />
(b)<br />
P 9999.887<br />
1 19.0e 0.2x<br />
10,000<br />
0<br />
0<br />
36<br />
(c) The model is a good fit.<br />
(d) The limiting size is<br />
9999.887<br />
1 0 10,000<br />
fish.<br />
158. P 56.8e 0.001603t<br />
(a)<br />
Year 1990 1991 1992 1993 1994 1995<br />
P 56.8 56.9 57 57.1 57.2 57.3<br />
Year 1996 1997 1998 1999 2000 2001<br />
P 57.3 57.4 57.5 57.6 57.7 57.8<br />
Year 2002 2003 2004 2005<br />
P 57.9 58.0 58.1 58.2<br />
(b)<br />
Linear model<br />
(c) Slope is 0.09. The population increases by 90,000<br />
people each year.<br />
(d)<br />
y 56.8 0.09t 0<br />
58.5<br />
Slope <br />
58.2 56.8<br />
15 0<br />
y 0.09t 56.8,<br />
0 14<br />
56<br />
Answers will vary.<br />
0.09<br />
© Houghton Mifflin Company. All rights reserved.