Interim Report - Hanford Site
Interim Report - Hanford Site
Interim Report - Hanford Site

Create successful ePaper yourself
Turn your PDF publications into a flip-book with our unique Google optimized e-Paper software.
3.0 Results and Discussion<br />
3.1 Polyphosphate Hydrolysis Experiments<br />
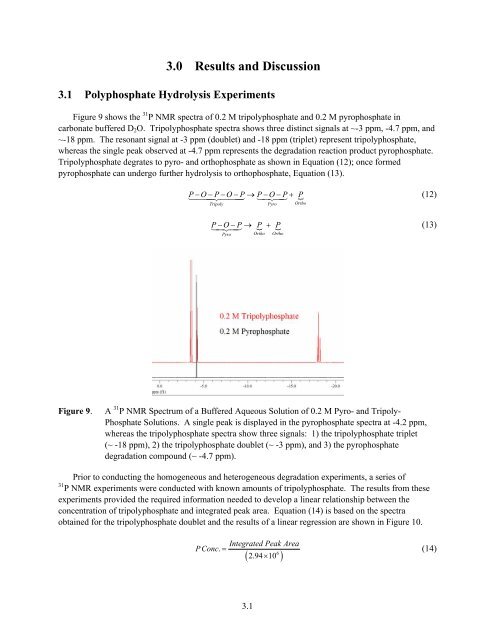
Figure 9 shows the 31 P NMR spectra of 0.2 M tripolyphosphate and 0.2 M pyrophosphate in<br />
carbonate buffered D 2 O. Tripolyphosphate spectra shows three distinct signals at ~-3 ppm, -4.7 ppm, and<br />
~-18 ppm. The resonant signal at -3 ppm (doublet) and -18 ppm (triplet) represent tripolyphosphate,<br />
whereas the single peak observed at -4.7 ppm represents the degradation reaction product pyrophosphate.<br />
Tripolyphosphate degrates to pyro- and orthophosphate as shown in Equation (12); once formed<br />
pyrophosphate can undergo further hydrolysis to orthophosphate, Equation (13).<br />
14 P − O 424443 −P−O−P →14243<br />
P−O−<br />
P + P<br />
Tripoly<br />
Pyro<br />
{<br />
Ortho<br />
(12)<br />
14243 P− O−P → { P + { P<br />
(13)<br />
Pyro<br />
Ortho<br />
Ortho<br />
Figure 9.<br />
A 31 P NMR Spectrum of a Buffered Aqueous Solution of 0.2 M Pyro- and Tripoly-<br />
Phosphate Solutions. A single peak is displayed in the pyrophosphate spectra at -4.2 ppm,<br />
whereas the tripolyphosphate spectra show three signals: 1) the tripolyphosphate triplet<br />
(~ -18 ppm), 2) the tripolyphosphate doublet (~ -3 ppm), and 3) the pyrophosphate<br />
degradation compound (~ -4.7 ppm).<br />
Prior to conducting the homogeneous and heterogeneous degradation experiments, a series of<br />
31 P NMR experiments were conducted with known amounts of tripolyphosphate. The results from these<br />
experiments provided the required information needed to develop a linear relationship between the<br />
concentration of tripolyphosphate and integrated peak area. Equation (14) is based on the spectra<br />
obtained for the tripolyphosphate doublet and the results of a linear regression are shown in Figure 10.<br />
Integrated Peak Area<br />
PConc . =<br />
6<br />
( 2.94×<br />
10 )<br />
(14)<br />
3.1