Interim Report - Hanford Site
Interim Report - Hanford Site
Interim Report - Hanford Site

You also want an ePaper? Increase the reach of your titles
YUMPU automatically turns print PDFs into web optimized ePapers that Google loves.
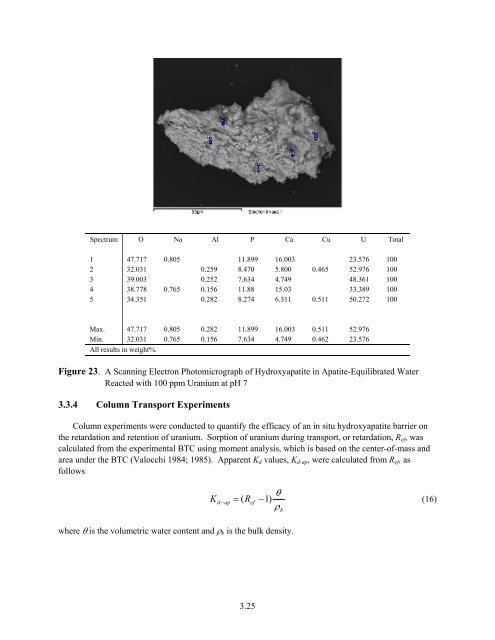
Spectrum O Na Al P Ca Cu U Total<br />
1 47.717 0.805 11.899 16.003 23.576 100<br />
2 32.031 0.259 8.470 5.800 0.465 52.976 100<br />
3 39.003 0.252 7.634 4.749 48.361 100<br />
4 38.778 0.765 0.156 11.88 15.03 33.389 100<br />
5 34.351 0.282 8.274 6.311 0.511 50.272 100<br />
Max. 47.717 0.805 0.282 11.899 16.003 0.511 52.976<br />
Min. 32.031 0.765 0.156 7.634 4.749 0.462 23.576<br />
All results in weight%.<br />
Figure 23. A Scanning Electron Photomicrograph of Hydroxyapatite in Apatite-Equilibrated Water<br />
Reacted with 100 ppm Uranium at pH 7<br />
3.3.4 Column Transport Experiments<br />
Column experiments were conducted to quantify the efficacy of an in situ hydroxyapatite barrier on<br />
the retardation and retention of uranium. Sorption of uranium during transport, or retardation, R ef , was<br />
calculated from the experimental BTC using moment analysis, which is based on the center-of-mass and<br />
area under the BTC (Valocchi 1984; 1985). Apparent K d values, K d-ap , were calculated from R ef , as<br />
follows<br />
θ<br />
K d − ap<br />
= ( Ref<br />
−1)<br />
(16)<br />
ρ<br />
b<br />
where θ is the volumetric water content and ρ b is the bulk density.<br />
3.25