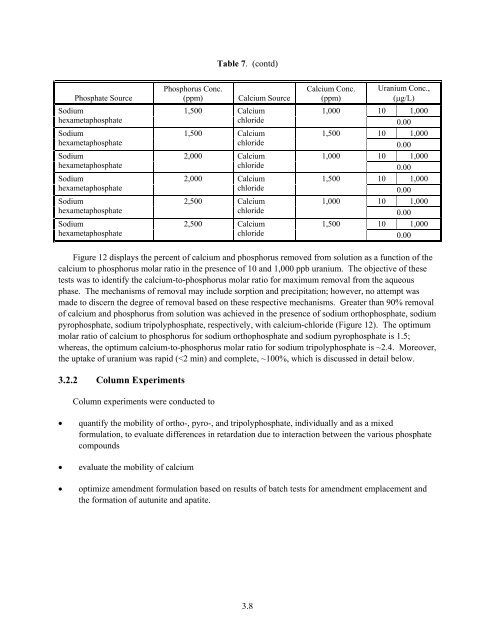
Table 7. (contd) Phosphate Source Phosphorus Conc. (ppm) Calcium Source Sodium orthophosphate 2,500 Calcium chloride Sodium orthophosphate 2,500 Calcium chloride Sodium pyrophosphate 1,500 Calcium chloride Sodium pyrophosphate 1,500 Calcium chloride Sodium pyrophosphate 2,000 Calcium chloride Sodium pyrophosphate 2,000 Calcium chloride Sodium pyrophosphate 2,500 Calcium chloride Sodium pyrophosphate 2,500 Calcium chloride Sodium tripolyphosphate 1,500 Calcium chloride Sodium tripolyphosphate 1,500 Calcium chloride Sodium tripolyphosphate 2,000 Calcium chloride Sodium tripolyphosphate 2,000 Calcium chloride Sodium tripolyphosphate 2,500 Calcium chloride Sodium tripolyphosphate 2,500 Calcium chloride Sodium trimetaphosphate 1,500 Calcium chloride Sodium trimetaphosphate 1,500 Calcium chloride Sodium trimetaphosphate 2,000 Calcium chloride Sodium trimetaphosphate 2,000 Calcium chloride Sodium trimetaphosphate 2,500 Calcium chloride Sodium trimetaphosphate 2,500 Calcium chloride Calcium Conc. (ppm) 1,000 1,500 1,000 1,500 1,000 1,500 1,000 1,500 1,000 1,500 1,000 1,500 1,000 1,500 1,000 1,500 1,000 1,500 1,000 1,500 Uranium Conc., (μg/L) 10 1,000 0.00 10 1,000 0.00 10 1,000 0.00 10 1,000 0.00 10 1,000 0.00 10 1,000 0.00 10 1,000 0.00 10 1,000 10 1,000 0.00 10 1,000 0.00 10 1,000 0.00 10 1,000 0.00 10 1,000 0.00 10 1,000 10 1,000 0.00 10 1,000 0.00 10 1,000 0.00 10 1,000 0.00 10 1,000 0.00 10 1,000 3.7
Table 7. (contd) Phosphate Source Sodium hexametaphosphate Sodium hexametaphosphate Sodium hexametaphosphate Sodium hexametaphosphate Sodium hexametaphosphate Sodium hexametaphosphate Phosphorus Conc. (ppm) Calcium Source 1,500 Calcium chloride 1,500 Calcium chloride 2,000 Calcium chloride 2,000 Calcium chloride 2,500 Calcium chloride 2,500 Calcium chloride Calcium Conc. (ppm) 1,000 1,500 1,000 1,500 1,000 1,500 Uranium Conc., (μg/L) 10 1,000 0.00 10 1,000 0.00 10 1,000 0.00 10 1,000 0.00 10 1,000 0.00 10 1,000 0.00 Figure 12 displays the percent of calcium and phosphorus removed from solution as a function of the calcium to phosphorus molar ratio in the presence of 10 and 1,000 ppb uranium. The objective of these tests was to identify the calcium-to-phosphorus molar ratio for maximum removal from the aqueous phase. The mechanisms of removal may include sorption and precipitation; however, no attempt was made to discern the degree of removal based on these respective mechanisms. Greater than 90% removal of calcium and phosphorus from solution was achieved in the presence of sodium orthophosphate, sodium pyrophosphate, sodium tripolyphosphate, respectively, with calcium-chloride (Figure 12). The optimum molar ratio of calcium to phosphorus for sodium orthophosphate and sodium pyrophosphate is 1.5; whereas, the optimum calcium-to-phosphorus molar ratio for sodium tripolyphosphate is ~2.4. Moreover, the uptake of uranium was rapid (
- Page 1: PNNL-16683 Interim Report: Uranium
- Page 4: Summary For fiscal year 2006, the U
- Page 8 and 9: Acronyms ASTM BET BTC American Soci
- Page 10 and 11: Contents Summary ..................
- Page 12 and 13: 13 Representative Photo of Sediment
- Page 14 and 15: 1.0 Introduction This report covers
- Page 16 and 17: The 300-FF-5 Operable Unit, a groun
- Page 18 and 19: Figure 3. 300 Area Detail Map Showi
- Page 20 and 21: Conversely, the use of soluble long
- Page 22 and 23: 2.0 Laboratory Testing - Materials
- Page 24 and 25: 2.2 Autunite and Apatite Formation
- Page 26 and 27: 2.2.2.1 Amendment Formulation, Effi
- Page 28 and 29: of uranyl to the test containers wa
- Page 30 and 31: parameters to be isolated and quant
- Page 32 and 33: concentrations of elements are belo
- Page 34 and 35: 3.0 Results and Discussion 3.1 Poly
- Page 36 and 37: 3.2 Apatite and Autunite Formation
- Page 38 and 39: Table 6. (contd) Phosphate Source P
- Page 42 and 43: 80 Sodium Hexametaphosphate 120 Sod
- Page 44 and 45: Table 8. (contd) Column No. 15 16 1
- Page 46 and 47: Schmid and McKinney (1968) identifi
- Page 48 and 49: Figure 15. Graphs Depicting Aqueous
- Page 50 and 51: tions of phosphorus are at or below
- Page 52 and 53: individual phosphate compounds (Fig
- Page 54 and 55: conducted in apatite equilibrated g
- Page 56 and 57: eflects the greater abundance of po
- Page 58 and 59: Spectrum O Na Al P Ca Cu U Total 1
- Page 60 and 61: varying degrees of cation and/or an
- Page 62 and 63: phase and the solution. This allows
- Page 64 and 65: log a Ca ++ -7 -7.5 -8 -8.5 -9 -9.5
- Page 66 and 67: 0 Hydroxyapatite Saturation, Min. w
- Page 68 and 69: log 10 Uranium Rate (g m -2 d -1 )
- Page 70 and 71: 3.5.1 Interlayer Cation Release Rat
- Page 72 and 73: The autunite structure is character
- Page 74 and 75: Figure 39. Viscosity of Polyphospha
- Page 76 and 77: 5.0 References Aagaard P and H Helg
- Page 78 and 79: Conca JL, N Lu, G Parker, B Moore,
- Page 80 and 81: Gauglitz R and M Holterdorf. 1992.
- Page 82: Mavropoulos E, AM Rossi, AM Costa,
- Page 85 and 86: Seaman JC, J Hutchinson, BP Jackson
- Page 87 and 88: Willard J, T Farr, and J Hatfield.
- Page 89 and 90: Appendix A Table A.1. The logK Valu
- Page 91 and 92:
Aqueous Species Solid Species Auxil
- Page 93:
PNNL-XXXXX Distribution No. of C op