sound colour properties of wfs and stereo 0. perception mechanism ...
sound colour properties of wfs and stereo 0. perception mechanism ...
sound colour properties of wfs and stereo 0. perception mechanism ...

Create successful ePaper yourself
Turn your PDF publications into a flip-book with our unique Google optimized e-Paper software.
SOUND COLOUR PROPERTIES OF WFS AND STEREO<br />
Helmut Wittek<br />
Schoeps Mikr<strong>of</strong>one GmbH / Institut für Rundfunktechnik GmbH / University <strong>of</strong> Surrey, Guildford, UK<br />
Spitalstr.20, 76227 Karlsruhe-Durlach<br />
email: wittek@hauptmikr<strong>of</strong>on.de<br />
web: www.hauptmikr<strong>of</strong>on.de<br />
ABSTRACT<br />
The <strong>sound</strong> <strong>colour</strong> <strong>properties</strong> <strong>of</strong> wavefield synthesis are<br />
analysed by listening tests <strong>and</strong> compared to those <strong>of</strong><br />
<strong>stereo</strong>phony. A tool for this comparison is the ‘OPSI’ concept,<br />
proposed to avoid spatial aliasing. Colouration was<br />
measured for a number <strong>of</strong> different systems The effect <strong>of</strong><br />
spatial aliasing on <strong>colour</strong>ation could be shown. Both<br />
<strong>stereo</strong>phonic phantom sources as well as OPSI sources<br />
were perceived to be less <strong>colour</strong>ed than was predicted by<br />
<strong>colour</strong>ation predictors based on the spectral alterations <strong>of</strong><br />
the ear signals. This leads to the hypothesis that a de<strong>colour</strong>ation<br />
process exists for <strong>stereo</strong>phonic reproduction as<br />
proposed in the "association model" <strong>of</strong> Theile. The investigation<br />
is completed by experiments on localisation <strong>properties</strong><br />
described in [15].<br />
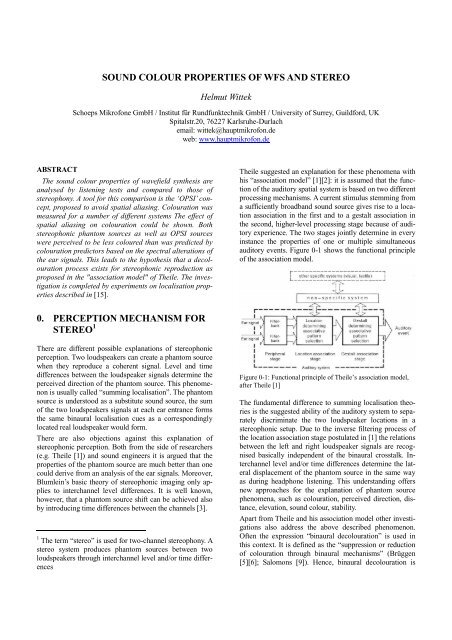
Theile suggested an explanation for these phenomena with<br />
his “association model” [1][2]: it is assumed that the function<br />
<strong>of</strong> the auditory spatial system is based on two different<br />
processing <strong>mechanism</strong>s. A current stimulus stemming from<br />
a sufficiently broadb<strong>and</strong> <strong>sound</strong> source gives rise to a location<br />
association in the first <strong>and</strong> to a gestalt association in<br />
the second, higher-level processing stage because <strong>of</strong> auditory<br />
experience. The two stages jointly determine in every<br />
instance the <strong>properties</strong> <strong>of</strong> one or multiple simultaneous<br />
auditory events. Figure 0-1 shows the functional principle<br />
<strong>of</strong> the association model.<br />
<strong>0.</strong> PERCEPTION MECHANISM FOR<br />
STEREO 1<br />
There are different possible explanations <strong>of</strong> <strong>stereo</strong>phonic<br />
<strong>perception</strong>. Two loudspeakers can create a phantom source<br />
when they reproduce a coherent signal. Level <strong>and</strong> time<br />
differences between the loudspeaker signals determine the<br />
perceived direction <strong>of</strong> the phantom source. This phenomenon<br />
is usually called “summing localisation”. The phantom<br />
source is understood as a substitute <strong>sound</strong> source, the sum<br />
<strong>of</strong> the two loudspeakers signals at each ear entrance forms<br />
the same binaural localisation cues as a correspondingly<br />
located real loudspeaker would form.<br />
There are also objections against this explanation <strong>of</strong><br />
<strong>stereo</strong>phonic <strong>perception</strong>. Both from the side <strong>of</strong> researchers<br />
(e.g. Theile [1]) <strong>and</strong> <strong>sound</strong> engineers it is argued that the<br />
<strong>properties</strong> <strong>of</strong> the phantom source are much better than one<br />
could derive from an analysis <strong>of</strong> the ear signals. Moreover,<br />
Blumlein’s basic theory <strong>of</strong> <strong>stereo</strong>phonic imaging only applies<br />
to interchannel level differences. It is well known,<br />
however, that a phantom source shift can be achieved also<br />
by introducing time differences between the channels [3].<br />
1 The term “<strong>stereo</strong>” is used for two-channel <strong>stereo</strong>phony. A<br />
<strong>stereo</strong> system produces phantom sources between two<br />
loudspeakers through interchannel level <strong>and</strong>/or time differences<br />
Figure 0-1: Functional principle <strong>of</strong> Theile’s association model,<br />
after Theile [1]<br />
The fundamental difference to summing localisation theories<br />
is the suggested ability <strong>of</strong> the auditory system to separately<br />
discriminate the two loudspeaker locations in a<br />
<strong>stereo</strong>phonic setup. Due to the inverse filtering process <strong>of</strong><br />
the location association stage postulated in [1] the relations<br />
between the left <strong>and</strong> right loudspeaker signals are recognised<br />
basically independent <strong>of</strong> the binaural crosstalk. Interchannel<br />
level <strong>and</strong>/or time differences determine the lateral<br />
displacement <strong>of</strong> the phantom source in the same way<br />
as during headphone listening. This underst<strong>and</strong>ing <strong>of</strong>fers<br />
new approaches for the explanation <strong>of</strong> phantom source<br />
phenomena, such as <strong>colour</strong>ation, perceived direction, distance,<br />
elevation, <strong>sound</strong> <strong>colour</strong>, stability.<br />
Apart from Theile <strong>and</strong> his association model other investigations<br />
also address the above described phenomenon.<br />
Often the expression “binaural de<strong>colour</strong>ation” is used in<br />
this context. It is defined as the “suppression or reduction<br />
<strong>of</strong> <strong>colour</strong>ation through binaural <strong>mechanism</strong>s” (Brüggen<br />
[5][6]; Salomons [9]). Hence, binaural de<strong>colour</strong>ation is
understood as the <strong>sound</strong> <strong>colour</strong> improvement when listening<br />
with two ears as compared to with one ear. Brüggen<br />
presumes that one internal spectrum is responsible for the<br />
timbre <strong>perception</strong> <strong>and</strong> that this spectrum is built by the<br />
mean <strong>of</strong> the two ear signals. The idea <strong>of</strong> an internal spectrum<br />
or “central spectrum” is utilised by Bilsen [7], Zurek<br />
[4], Kates [8], Raatgever <strong>and</strong> Bilsen [14] <strong>and</strong> others.<br />
The <strong>colour</strong>ation caused by spatial aliasing in WFS is not<br />
produced by discrete signals from different directions<br />
rather than from many signals merging to a dense signal.<br />
Hence, de<strong>colour</strong>ation consequently does not apply in the<br />
same manner to WFS as it could exist in <strong>stereo</strong>.<br />
1. THE “OPSI” CONCEPT<br />
Single loudspeakers emanate the high frequency part <strong>of</strong> the<br />
WFS source, see Figure 1-1. The WFS array uses the lowpassed<br />
(f alias ) signals. These<br />
loudspeakers need to be spaced significantly wider than<br />
the loudspeakers <strong>of</strong> the WFS array <strong>and</strong> thus produce a<br />
<strong>stereo</strong>phonic image. The low <strong>and</strong> the high frequency<br />
source are expected to merge unless the difference in their<br />
incident angles is not too large. This technique is called<br />
“OPSI” = “Optimised Phantom Source Imaging <strong>of</strong> high<br />
frequency content wavefield synthesis”. Figure 1-2 illustrates<br />
the method <strong>of</strong> deriving an OPSI signal for the WFS<br />
array.<br />
Figure 1-1: Example <strong>of</strong> an OPSI system: Three loudspeakers<br />
replace the WFS array for reproducing the high frequency part<br />
The WFS virtual source <strong>and</strong> the phantom source are expected<br />
to merge <strong>and</strong> to be perceived as one auditory event.<br />
Their directions must not be too different, otherwise they<br />
would be separately perceived. This difference shall be<br />
called the OPSI localisation error. It should be smaller<br />
than a maximum allowed OPSI localisation error which<br />
was determined in a pilot experiment. A change in the perceived<br />
source direction does not exist in cases where the<br />
OPSI localisation error does not exceed 5°. The locatedness<br />
<strong>and</strong> the localisation focus <strong>of</strong> the OPSI source, however,<br />
was the subject <strong>of</strong> another experiment which is not<br />
described here [15]. The OPSI system turned out to be<br />
roughly similar to a conventional WFS system with the<br />
same WFS spacing regarding these attributes.<br />
Figure 1-2: Creation <strong>of</strong> OPSI signals: The WFS array is fed with<br />
the low-passed WFS signals only. The <strong>stereo</strong> loudspeakers are<br />
fed with the high-passed WFS signals after a level adjustment.<br />
The signals are split at the crossover frequency f cross .<br />
Simulations <strong>of</strong> the OPSI localisation error show that the<br />
error depends on the position <strong>of</strong> the virtual source. Also the<br />
size <strong>and</strong> position <strong>of</strong> the <strong>stereo</strong> loudspeaker setup influence<br />
the performance. In order to optimise for a minimum OPSI<br />
localisation error, the choice <strong>of</strong> the suitable <strong>stereo</strong> loudspeakers<br />
depends on the synthesised virtual source distance.<br />
In the case <strong>of</strong> plane waves or sources with larger<br />
distances, more than just a few <strong>stereo</strong> loudspeakers have to<br />
be used.<br />
2. EXPERIMENT: TIMBRAL<br />
FIDELITY<br />
2.1 EXPERIMENTAL SETUP<br />
The experiment aimed to compare the <strong>sound</strong> <strong>colour</strong> <strong>properties</strong><br />
<strong>of</strong> different WFS systems as well as OPSI <strong>and</strong> <strong>stereo</strong>.<br />
It was performed with a modified MUSHRA method<br />
after ITU-R BS.1534 which utilised fixed anchors exhibiting<br />
spectral alterations <strong>of</strong> different degrees. In pilot experiments<br />
a suitable anchor was found, being the reference<br />
signal, processed with sine-ripple spectra <strong>of</strong> different ripple<br />
depths (see [10]). The ripple depth (amplitude <strong>of</strong> the<br />
sine) is defined as the difference between the maximum <strong>of</strong><br />
the first half wave <strong>and</strong> zero. Five anchors were utilised; the<br />
ripple depth was 0, 1, 2, 3 <strong>and</strong> 4 dB. The utilised anchors<br />
are shown in Figure 2-1.<br />
It was decided to assess the system <strong>colour</strong>ation which was<br />
defined as an intra-system parameter. This means that in<br />
each trial only one system has to be assessed which makes<br />
the experiment design easier. In each trial 9 different signals<br />
were reproduced. These are:<br />
- the reference (direction -5°)<br />
- three stimuli in other directions than the reference (-<br />
10°, 3°, 15°). The directions were chosen such that the<br />
differences between reference <strong>and</strong> stimulus direction<br />
were unequal for all stimuli.
- the hidden reference<br />
- four anchors (see Figure 2-1)<br />
Figure 2-1: Anchors <strong>of</strong> the experiment: Sine-ripple spectra from<br />
625 to 2<strong>0.</strong>000 Hz. The ripple density is 2 (ripples per octave).<br />
The ripple depth is 0, 1, 2, 3 <strong>and</strong> 4 dB. The anchors were designed<br />
in order to <strong>sound</strong> not dissimilar to spatial aliasing. The<br />
graph shows the level in dB vs. the frequency.<br />
Figure 2-2 shows the MUSHRA interface <strong>of</strong> the experiment.<br />
The subjects could switch between the 9 different<br />
stimuli by clicking on the buttons “REF” or “A”-“H”.<br />
The BRS system produces out-<strong>of</strong>-head-localisation, which<br />
is the prerequisite <strong>of</strong> any serious experiment about spatial<br />
<strong>and</strong> timbral attributes. Only successful out-<strong>of</strong>-headlocalisation<br />
avoids a system-inherent <strong>colour</strong>ation <strong>of</strong> the<br />
binaural reproduction [12].<br />
The stimuli <strong>of</strong> the experiment were dry pink noise bursts<br />
<strong>of</strong> the length 800 ms with a fade-in <strong>and</strong> fade-out time <strong>of</strong><br />
each 50 ms. The dry stimuli were convolved in real-time<br />
with the corresponding BRIRs <strong>of</strong> the current system <strong>and</strong><br />
azimuth to result in the binaural stimuli assessed by the<br />
subject.<br />
System<br />
No. <strong>of</strong><br />
speakers<br />
f alias [Hz] f cross [Hz]<br />
Real sources 1 - (24000)<br />
Stereo 2 - (0)<br />
f alias ><br />
f cross<br />
OPSI 3 200 9600 750 ↑<br />
OPSI 3 200 9600 1500 ↑<br />
OPSI 3 200 9600 3000 ↑<br />
OPSI 3 200 9600 6000 →<br />
WFS 3 200 9600 (24000) ↓<br />
OPSI 12 50 2400 750 ↑<br />
OPSI 12 50 2400 1500 →<br />
OPSI 12 50 2400 3000 ↓<br />
OPSI 12 50 2400 6000 ↓<br />
WFS 12 50 2400 (24000) ↓<br />
OPSI 24 24 1200 750 →<br />
OPSI 24 24 1200 1500 ↓<br />
Figure 2-2: Screenshot <strong>of</strong> the MUSHRA-like interface <strong>of</strong> the<br />
experiment. The s<strong>of</strong>tware was programmed in MATLAB.<br />
For practical reasons a virtual reproduction based on a<br />
binaural system utilising headphones <strong>and</strong> head-tracking<br />
was used. This system, called BRS (Binaural Room Synthesis,<br />
[11][12]) was developed at the IRT <strong>and</strong> recently<br />
was realised as a VST plug-in which can be run within the<br />
host s<strong>of</strong>tware Steinberg Nuendo. The BRS filters were<br />
changed after each trial in order to assess the next system.<br />
BRS is a convolution-based system, i.e. it needs binaural<br />
measurements <strong>of</strong> BRIRs (Binaural Room Impulse Responses)<br />
to correctly reproduce the virtual sources. The<br />
filters used in the BRS system were produced by utilising a<br />
database <strong>of</strong> BRIRs measured in the listening room <strong>of</strong> the<br />
IRT. By using this database a natural BRIR <strong>of</strong> any system<br />
can be produced. The resulting BRIRs are produced by<br />
superimposing the BRIRs <strong>of</strong> the single loudspeakers <strong>of</strong> the<br />
system according to the driving function <strong>of</strong> the system.<br />
OPSI 24 24 1200 3000 ↓<br />
OPSI 24 24 1200 6000 ↓<br />
WFS 24 25 1200 (24000) ↓<br />
WFS 48 12 600 (24000) ↓<br />
Table 2-1: Systems under test. The WFS <strong>and</strong> OPSI systems are<br />
labelled by the loudspeaker spacing which is 3, 12, 24 or 48 cm.<br />
The last column denotes the systems by their aliasing as described<br />
above.<br />
The subjects were sitting such that the visual scenery<br />
matched as closely as possible the acoustic scenery produced<br />
by the virtual acoustics system. This means that they<br />
were positioned in front <strong>of</strong> the WFS test array which was<br />
built <strong>of</strong> 32 small broadb<strong>and</strong> speakers. This array was not<br />
active in the experiment, but it served as a visible anchor to<br />
support the acoustic illusion.<br />
The subjects were asked to grade the perceived <strong>colour</strong>ation<br />
between the stimuli in the interface on a 5-grade scale.
Only the extremes <strong>of</strong> the scale were labelled with verbal<br />
descriptions:<br />
Is there a timbral difference between the reference <strong>and</strong> the<br />
stimulus?<br />
0=”no difference” - 4=”extremely different”<br />
The attribute <strong>colour</strong>ation/timbral difference was defined as<br />
the <strong>sound</strong> <strong>colour</strong> difference between the reference <strong>and</strong> the<br />
chosen stimulus. A small training phase introducing possible<br />
<strong>colour</strong>ations was performed before the experiment.<br />
2.2 SYSTEMS UNDER TEST<br />
Table 2-1 lists the system assessed in the experiment together<br />
with the relevant system parameters. By this table,<br />
the WFS <strong>and</strong> the OPSI systems can be classified into three<br />
categories, marked with arrows in the last column:<br />
- no aliasing, but the crossover frequency is unnecessarily<br />
low ( ↑ )<br />
- no aliasing, the crossover frequency is optimal (→ )<br />
- the crossover frequency is too high, there is aliasing in<br />
the signal ( ↓ )<br />
2.3 RESULTS AND DISCUSSION<br />
Figure 2-3 <strong>and</strong> Figure 2-4 show the results <strong>of</strong> the experiment.<br />
In Figure 2-3 the perceived <strong>colour</strong>ation is shown for<br />
each system <strong>and</strong> OPSI crossover frequency f cross . Figure<br />
2-4 sorts the WFS results by the OPSI crossover frequency<br />
f cross .<br />
Figure 2-3: Results from the experiment: the perceived <strong>colour</strong>ation<br />
is shown for all systems <strong>of</strong> the test. The category is the<br />
OPSI crossover frequency in Hz.<br />
The results can be depicted by these main observations:<br />
1. The real source <strong>and</strong> the phantom source as well as the<br />
optimal WFS3/OPSI3 systems have the best <strong>colour</strong>ation<br />
grades.<br />
2. The perceived <strong>colour</strong>ations <strong>of</strong> the WFS <strong>and</strong> OPSI<br />
systems generally increase with increasing loudspeaker<br />
spacings.<br />
3. The more the aliasing frequency exceeds the crossover<br />
frequency, the larger the <strong>colour</strong>ation is. In other<br />
words: the <strong>colour</strong>ations increase with the amount <strong>of</strong><br />
aliasing in the signal.<br />
4. When the crossover frequency is reduced below 3000<br />
Hz, the <strong>colour</strong>ations also increase.<br />
Figure 2-4: Results from the experiment: the perceived <strong>colour</strong>ation<br />
is shown against the OPSI-Crossover frequency in Hz. The<br />
category is the WFS loudspeaker spacing in cm.<br />
The discussion is based on the above-mentioned observations:<br />
Observation 1: It was expected that the real sources as<br />
well as the WFS3 sources would have the best <strong>colour</strong>ation<br />
grades. The OPSI3 systems partly have the same good<br />
results. The spatial aliasing in the WFS3 system may even<br />
lead to a small degradation in its <strong>sound</strong> <strong>colour</strong> performance,<br />
whereas the OPSI systems applying WFS3 may have<br />
better grades. It may be surprising that also the phantom<br />
sources achieve the same optimal grades.<br />
Observation 2: As expected, the <strong>sound</strong> <strong>colour</strong> performance<br />
deteriorates with increasing WFS loudspeaker distance <strong>and</strong><br />
thus with an increased aliasing in the signal. The experimental<br />
results show that only the WFS24 system achieves<br />
slightly better grades than the WFS12 systems which could<br />
indeed be explained by the objective predictors.<br />
Observation 3 <strong>and</strong> 4: An OPSI system applying the optimal<br />
crossover frequency always achieves the best possible<br />
result for any WFS loudspeaker distance. When the crossover<br />
frequency is too high (aliasing in the signal) or too<br />
low (too little WFS information) the <strong>sound</strong> <strong>colour</strong> performance<br />
is degraded. Note that the OPSI systems<br />
OPSI3/750Hz, OPSI12/750Hz <strong>and</strong> OPSI24/750Hz produce<br />
a similar signal as there is a perfect WFS signal below<br />
the same crossover frequency <strong>and</strong> rather similar <strong>stereo</strong><br />
loudspeaker setups for the <strong>stereo</strong> part. It plays no role<br />
whether this unaliased WFS signal is produced by a 24cmspaced,<br />
a 12cm-spaced or a 3cm-spaced array. The same is<br />
true for the systems OPSI3/1500Hz <strong>and</strong> OPSI12/1500Hz.<br />
A reduction <strong>of</strong> the crossover frequency below 3000 Hz<br />
leads to a deteriorated <strong>sound</strong> <strong>colour</strong> performance. This can<br />
be read from the results <strong>of</strong> the OPSI3 system. The same<br />
rule is valid for the other systems, only that the existence
<strong>of</strong> aliasing in the signal gives even worse results. This also<br />
means that the crossover frequency cannot be reduced further<br />
than the aliasing frequency to give the best results.<br />
Figure 2-5: Results <strong>of</strong> the experiment as predicted by combined<br />
predictors SD <strong>and</strong> A 0 -measure. Compare with Figure 2-3.<br />
Hence, the prediction can identify systematic differences in<br />
the <strong>perception</strong> <strong>mechanism</strong>.<br />
This investigation adopts the “central spectrum” approach<br />
to predicting the perceived <strong>colour</strong>ation [4][6][7][8][9]. The<br />
central spectrum is generated by averaging the power density<br />
spectra <strong>of</strong> the left <strong>and</strong> right ear signals. Furthermore, a<br />
critical-b<strong>and</strong> filtering (Patterson) is performed before the<br />
averaging to simulate the frequency analysis <strong>properties</strong> <strong>of</strong><br />
the auditory system. The intra-system spectral differences<br />
in the binaural transfer functions between the reproduced<br />
sources, processed after the central spectrum theory, will<br />
be referred to as “spectral alterations”.<br />
The prediction is attempted by performing a regression<br />
analysis. It is based on the measured spectral alterations<br />
<strong>and</strong> the perceived <strong>colour</strong>ation gathered in the experiment.<br />
These predictors were chosen after comparing different<br />
alternatives described in the literature:<br />
A 0 -criterion: measure defined by Atal et al. [13]. Renewed<br />
definition by Salomons [9]: “coloration is perceptible if the<br />
maximum modulation depth (i.e. the level difference between<br />
maxima <strong>and</strong> minima) <strong>of</strong> the spectrum convolved<br />
with auditory filters exceeds a certain threshold A 0 ”.<br />
Spectral deviation (SD): St<strong>and</strong>ard deviation <strong>of</strong> the spectral<br />
alterations on a log scale. The st<strong>and</strong>ard deviation measures<br />
the mean deviation from the spectrum to the mean value,<br />
calculated from the graph in logarithmical representation<br />
in order to correspond to auditory <strong>perception</strong>.<br />
Figure 2-6: Regression analysis: The mean <strong>colour</strong>ation grades <strong>of</strong><br />
the experiment are drawn against the mean predicted values.<br />
Systems indicated with white circles <strong>and</strong> triangles (no aliasing)<br />
are predicted <strong>and</strong> graded better than systems indicated with solid<br />
triangles (with aliasing), see Table 2-1. Systems containing <strong>stereo</strong><br />
are rather overestimated, aliased systems (solid triangles) are<br />
rather underestimated in their <strong>colour</strong>ation by the prediction.<br />
2.4 PREDICTION OF COLOURATION<br />
PERCEPTION<br />
A prediction <strong>of</strong> the perceived <strong>colour</strong>ation based solely on<br />
the spectral alterations may lead to different results for the<br />
different system types because it does not take into account<br />
the hypothesised listener’s ability to segregate or de<strong>colour</strong>.<br />
Figure 2-7: St<strong>and</strong>ardized residuals <strong>of</strong> the regression based on SD<br />
<strong>and</strong> A 0 -measure.<br />
These predictors are rather crude measures that are defined<br />
without a very precise psycho-acoustic justification. It<br />
cannot be expected that they fully agree with actual <strong>perception</strong>.<br />
However, it can be seen from Figure 2-6 that the<br />
regression based on predictors A 0 -measure <strong>and</strong> SD pro-
duce rather good results in terms <strong>of</strong> the qualitative distribution<br />
<strong>of</strong> the results. The squared correlation coefficient is R 2<br />
= <strong>0.</strong>76 for the multiple regression based on both predictors.<br />
Figure 2-6 shows the prediction against the mean <strong>colour</strong>ation<br />
grades <strong>of</strong> the experiment. The st<strong>and</strong>ardized residuals<br />
<strong>of</strong> the regression based on predictor SD are shown in<br />
Figure 2-7, where positive residuals correspond to an underestimation<br />
<strong>of</strong> the <strong>colour</strong>ation <strong>and</strong> negative residuals to<br />
an overestimation <strong>of</strong> the <strong>colour</strong>ation. The results show that<br />
the prediction quality apparently is dependent on the type<br />
<strong>of</strong> system. The systems containing aliasing (solid triangles<br />
in Figure 2-6) are mostly underestimated in their <strong>colour</strong>ation,<br />
whereas the systems without aliasing but with a<br />
<strong>stereo</strong>phonic contribution are mostly overestimated. This<br />
means that the perceived <strong>colour</strong>ation <strong>of</strong> the <strong>stereo</strong>phonic<br />
systems is lower than was predicted by the spectral alterations.<br />
This leads in to confirming the hypothesis that<br />
<strong>stereo</strong>phonic <strong>perception</strong> is different from conventional<br />
auditory <strong>perception</strong>.<br />
3. CONCLUSIONS<br />
WFS <strong>properties</strong> compared to <strong>stereo</strong><br />
The experiment revealed the <strong>sound</strong> <strong>colour</strong> <strong>properties</strong> <strong>of</strong><br />
WFS. Spatial aliasing introduces <strong>colour</strong>ation to the virtual<br />
sources. The <strong>colour</strong>ation can be rather well predicted by an<br />
analysis <strong>of</strong> the spectral alterations <strong>of</strong> the ear signals.<br />
Colouration generally is dependant on the aliasing frequency<br />
<strong>and</strong> the shape <strong>of</strong> the aliasing, i.e. the peak/notch<br />
distance <strong>and</strong> the spectral deviation. Stereo showed the least<br />
<strong>colour</strong>ation <strong>of</strong> all systems.<br />
OPSI technique<br />
The <strong>sound</strong> <strong>colour</strong> <strong>properties</strong> <strong>of</strong> a WFS virtual source can<br />
be optimised by avoiding aliasing. Both theoretical <strong>and</strong><br />
practical investigations have shown how an introduction <strong>of</strong><br />
<strong>stereo</strong>phonic techniques to WFS can help avoiding <strong>colour</strong>ation<br />
artefacts. The idea <strong>of</strong> the OPSI concept is the coexistence<br />
<strong>of</strong> the low frequency WFS localisation <strong>properties</strong><br />
<strong>and</strong> the high frequency <strong>sound</strong> <strong>colour</strong> <strong>properties</strong> known<br />
from <strong>stereo</strong>. Experiments that are not described in this<br />
paper [15] revealed that apart from a certain reduction <strong>of</strong><br />
the listening area, the localisation <strong>properties</strong> <strong>of</strong> an OPSI<br />
system are similar to a corresponding WFS system.<br />
Perception <strong>of</strong> <strong>stereo</strong><br />
Stereo showed the least <strong>colour</strong>ation <strong>of</strong> all systems. Also the<br />
spectral alterations were smaller for the <strong>stereo</strong> sources.<br />
This means that the spectrum <strong>of</strong> the source is <strong>of</strong>ten more<br />
flat in the case <strong>of</strong> <strong>stereo</strong> compared with typical WFS.<br />
However, both the <strong>stereo</strong> <strong>and</strong> the OPSI sources were<br />
graded better than it was predicted from the spectral alterations<br />
<strong>of</strong> the ear signals. Hence, the experimental results<br />
show that the <strong>perception</strong> <strong>of</strong> <strong>stereo</strong> is to be regarded differently<br />
from WFS <strong>perception</strong>. This suggests the existence <strong>of</strong><br />
some kind <strong>of</strong> de<strong>colour</strong>ation which leads to an improvement<br />
<strong>of</strong> <strong>sound</strong> <strong>colour</strong> <strong>perception</strong> in <strong>stereo</strong> reproduction<br />
similar to the de<strong>colour</strong>ation <strong>of</strong> a <strong>sound</strong> source in a reflective<br />
environment. The segregation cannot be considered as<br />
leading to an ideal separation with regard to localisation<br />
<strong>and</strong> <strong>sound</strong> <strong>colour</strong> <strong>perception</strong>. This leads to the hypothesis<br />
<strong>of</strong> a partial de<strong>colour</strong>ation in <strong>stereo</strong>phonic <strong>perception</strong>. It can<br />
be considered an interpretation <strong>of</strong> Theile’s association<br />
model.<br />
REFERENCES<br />
[1] Theile, G., 1980: “On the localisation in the superimposed<br />
<strong>sound</strong> field”, Dissertation Technische Universität<br />
Berlin, available: www.hauptmikr<strong>of</strong>on.de/theile.htm .<br />
[2] Theile, G., 1991: “On the Naturalness <strong>of</strong> Two-<br />
Channel Stereo Sound”, Journal <strong>of</strong> the Audio Engineering<br />
Society, Vol.39, No.10, pp.761-767<br />
[3] Wittek, H., 2001: “JAVA-Applet Image Assistant 2.0<br />
<strong>and</strong> documentation” on www.hauptmikr<strong>of</strong>on.de/ima2.html<br />
[4] Zurek, P.M., 1979: “Measurements <strong>of</strong> binaural echo<br />
suppression”, Journal <strong>of</strong> the Acoustical Society <strong>of</strong> America<br />
Vol.66, pp.1750–1757.<br />
[5] Brüggen, M., 2001: “Coloration <strong>and</strong> binaural decoloration<br />
in natural environments”, Acustica 87, 400–406.<br />
[6] Brüggen, M., 2001: “Sound coloration due to reflections<br />
<strong>and</strong> its auditory <strong>and</strong> instrumental compensation”,<br />
Dissertation Ruhr-Universität Bochum<br />
[7] Bilsen, 1977: “Pitch <strong>of</strong> noise signals - Evidence for a<br />
‘central spectrum’ “, Journal <strong>of</strong> the Acoustical Society <strong>of</strong><br />
America, Vol.61, No.1, January 1977.<br />
[8] Kates, J.M., 1985: “A central spectrum model for the<br />
<strong>perception</strong> <strong>of</strong> coloration in filtered Gaussian noise”, Journal<br />
<strong>of</strong> the Acoustical Society <strong>of</strong> America, Vol.77, No.4,<br />
pp.1529-1534<br />
[9] Salomons, A. M., 1995: “Coloration <strong>and</strong> binaural<br />
decoloration <strong>of</strong> <strong>sound</strong> due to reflections”, Dissertation,<br />
Delft University.<br />
[10] Supin, A., et al., 1999: “Ripple depth <strong>and</strong> density<br />
resolution <strong>of</strong> rippled noise”, Journal <strong>of</strong> the Acoustical Society<br />
<strong>of</strong> America, Vol.106 (5), November<br />
[11] Horbach, U., Pellegrini, R., Felderh<strong>of</strong>f, U., Theile,<br />
G., 1998: “Ein virtueller Surround Sound Abhörraum im<br />
Ü-Wagen”, Proceedings 20 th Tonmeistertagung, Karlsruhe.<br />
[12] Rathbone, B., Fruhmann, M., Spik<strong>of</strong>ski, G., Theile,<br />
G., 2000: “Untersuchungen zur Optimierung des BRS-<br />
Verfahrens (Binaural Room Scanning)”, Proceedings 21 st<br />
Tonmeistertagung, Hannover, pp. 92-106.<br />
[13] Atal, B. et al., 1962: “Perception <strong>of</strong> coloration in<br />
filtered gaussian noise-short-time spectral analysis by the<br />
ear”, Proceedings 4 th ICA, Copenhagen.<br />
[14] Raatgever, J. <strong>and</strong> Bilsen, F.A., 1986: "A central spectrum<br />
theory <strong>of</strong> binaural processing. Evidence from dichotic<br />
pitch", Journal <strong>of</strong> the Acoustical Society <strong>of</strong> America, Vol.<br />
80(2), p.429-441<br />
[15] Wittek, H., Rumsey, F., Theile, G., 2007: “Perceptual<br />
enhancement <strong>of</strong> wavefield synthesis by <strong>stereo</strong>phonic<br />
means”. Journal <strong>of</strong> the Audio Engineering Society, Vol.55,<br />
No.9, September 2007, pp 723-751.