Community Needs Assessment - Hawkesbury City Council
Community Needs Assessment - Hawkesbury City Council
Community Needs Assessment - Hawkesbury City Council

You also want an ePaper? Increase the reach of your titles
YUMPU automatically turns print PDFs into web optimized ePapers that Google loves.
3 Demographic Analysis<br />
3.1 INTRODUCTION<br />
The following section summarises the key social and demographic characteristics of North Richmond and<br />
the <strong>Hawkesbury</strong> LGA as a whole.<br />
The data presented is based on Australian Bureau of Statistics (ABS) Census 2006 data, contemporary<br />
inter-Censal data, Socio-Economic Indexes for Areas (SEIFA), and NSW Bureau of Crime Statistics and<br />
Research (BOCSAR) data for the North Richmond area.<br />
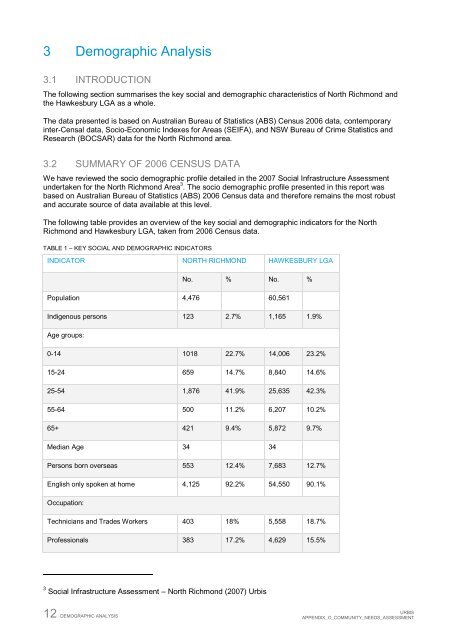
3.2 SUMMARY OF 2006 CENSUS DATA<br />
We have reviewed the socio demographic profile detailed in the 2007 Social Infrastructure <strong>Assessment</strong><br />
undertaken for the North Richmond Area 3 . The socio demographic profile presented in this report was<br />
based on Australian Bureau of Statistics (ABS) 2006 Census data and therefore remains the most robust<br />
and accurate source of data available at this level.<br />
The following table provides an overview of the key social and demographic indicators for the North<br />
Richmond and <strong>Hawkesbury</strong> LGA, taken from 2006 Census data.<br />
TABLE 1 – KEY SOCIAL AND DEMOGRAPHIC INDICATORS<br />
INDICATOR NORTH RICHMOND HAWKESBURY LGA<br />
No. % No. %<br />
Population 4,476 60,561<br />
Indigenous persons 123 2.7% 1,165 1.9%<br />
Age groups:<br />
0-14 1018 22.7% 14,006 23.2%<br />
15-24 659 14.7% 8,840 14.6%<br />
25-54 1,876 41.9% 25,635 42.3%<br />
55-64 500 11.2% 6,207 10.2%<br />
65+ 421 9.4% 5,872 9.7%<br />
Median Age 34 34<br />
Persons born overseas 553 12.4% 7,683 12.7%<br />
English only spoken at home 4,125 92.2% 54,550 90.1%<br />
Occupation:<br />
Technicians and Trades Workers 403 18% 5,558 18.7%<br />
Professionals 383 17.2% 4,629 15.5%<br />
3 Social Infrastructure <strong>Assessment</strong> – North Richmond (2007) Urbis<br />
12 DEMOGRAPHIC ANALYSIS<br />
URBIS<br />
APPENDIX_O_COMMUNITY_NEEDS_ASSESSMENT