Community Needs Assessment - Hawkesbury City Council
Community Needs Assessment - Hawkesbury City Council
Community Needs Assessment - Hawkesbury City Council

You also want an ePaper? Increase the reach of your titles
YUMPU automatically turns print PDFs into web optimized ePapers that Google loves.
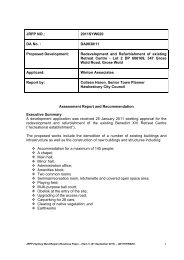
Clerical and Admin Workers 332 14.9% 4,532 15.2%<br />
Median household income ($/weekly) $1,128 $1,146<br />
Fully owned dwellings 495 30.5% 6,105 28.9%<br />
Dwellings being purchased 515 31.7% 8,394 39.7%<br />
Median rent $/weekly $200 $205<br />
Family household 1,237 76.1% 15,583 73.7%<br />
The 2006 Census data indicates that the North Richmond population represents approximately 7% of the<br />
total population of <strong>Hawkesbury</strong>. Both areas have very similar demographic structures.<br />
The age profile of the population for both North Richmond and <strong>Hawkesbury</strong> are similar, with median ages<br />
of 34years, high proportions of working age population, and similar proportions of young aged residents<br />
(0-14 years).<br />
There are, however, a number of small differences between the areas. One of these key differences is<br />
that North Richmond has a higher proportion of family households (76.1%) than <strong>Hawkesbury</strong> LGA<br />
(73.7%), with a slightly higher proportion of fully owned dwellings (30.5% compared to 28.9% in the LGA),<br />
but a lower proportion of dwellings being purchased (31.7% compared to the LGA‟s 39.7%) This reflects<br />
the fact that the <strong>Hawkesbury</strong> LGA is experiencing declining growth at the same time as a continued high<br />
rate of household formation, including „lone person‟ and „couple with no children‟ households. 4 .<br />
The most common occupation in 2006 was technicians and trades workers in both North Richmond and<br />
<strong>Hawkesbury</strong> LGA, with the next occupation being professionals. There was a higher proportion of<br />
professionals living in North Richmond (17.2%) than in <strong>Hawkesbury</strong> LGA (15.5%), which means that<br />
there was also a slightly lower proportion of clerical and admin workers living in North Richmond (14.9%)<br />
compared to the proportion in the LGA (15.2%). The median weekly household income was slightly<br />
higher in <strong>Hawkesbury</strong> LGA ($1,146) than in North Richmond ($1,128).<br />
North Richmond was home to more people who only speak English at home (92.2%) than in the LGA<br />
(90.1%) in 2006, with a significantly higher Indigenous population (2.7%) than <strong>Hawkesbury</strong> LGA (1.9%).<br />
The demographic information summarised in this report is predominantly the same as the information in<br />
the 2007 Aged Care Study prepared by Urbis, with a few minor differences in some statistics. This<br />
includes the age breakdown categories, which were adjusted after the Census data was originally<br />
released in 2007.<br />
3.3 REVIEW OF CONTEMPORARY DATA<br />
While the 2006 Census data remains the most robust and accurate source of data available for analysis<br />
of demographic characteristics at this spatial level, a number of local, regional and State wide updates<br />
have been developed to determine any inter-Censal trends regarding population characteristics.<br />
The <strong>Hawkesbury</strong> Residential Land Strategy, adopted by <strong>Hawkesbury</strong> <strong>City</strong> <strong>Council</strong> on 10 May 2011,<br />
identifies the demographic characteristics that drive current and future urban development needs in the<br />
LGA. Demographic information is based on 2006 ABS Census Data, the <strong>Hawkesbury</strong> <strong>Community</strong> ID<br />
Profile, the Draft <strong>Hawkesbury</strong> Futures: Infrastructure Requirements 2006-2036, and population<br />
projections.<br />
Population growth in the <strong>Hawkesbury</strong> LGA has been stable up to 2006, with significant changes to the<br />
age structure of the local population. The population is ageing with an increase in the proportion of people<br />
aged 50-years and over increasing from 19% in 1996 to 26% by 2006. At the same time, younger age<br />
groups are experiencing losses in the age groups of 0-11 years (a 3% loss between 1996 and 2006), and<br />
4 <strong>Hawkesbury</strong> Residential Land Strategy(2011) Hassell<br />
URBIS<br />
APPENDIX_O_COMMUNITY_NEEDS_ASSESSMENT DEMOGRAPHIC ANALYSIS 13