Office of the Health Services Commissioner Annual Report 2008
Office of the Health Services Commissioner Annual Report 2008
Office of the Health Services Commissioner Annual Report 2008

Create successful ePaper yourself
Turn your PDF publications into a flip-book with our unique Google optimized e-Paper software.
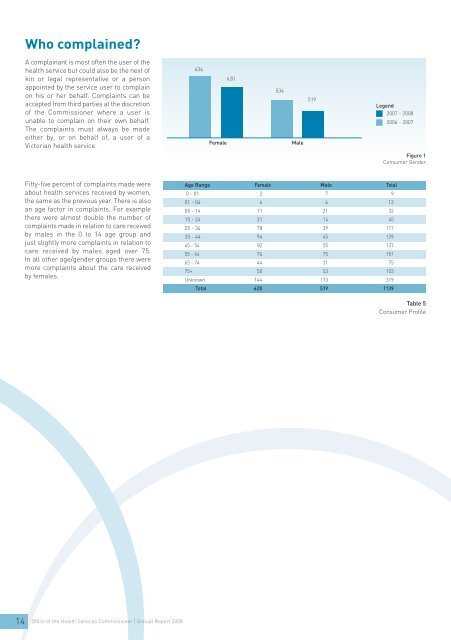
Who complained?<br />
A complainant is most <strong>of</strong>ten <strong>the</strong> user <strong>of</strong> <strong>the</strong><br />
health service but could also be <strong>the</strong> next <strong>of</strong><br />
kin or legal representative or a person<br />
appointed by <strong>the</strong> service user to complain<br />
on his or her behalf. Complaints can be<br />
accepted from third parties at <strong>the</strong> discretion<br />
<strong>of</strong> <strong>the</strong> <strong>Commissioner</strong> where a user is<br />
unable to complain on <strong>the</strong>ir own behalf.<br />
The complaints must always be made<br />
ei<strong>the</strong>r by, or on behalf <strong>of</strong>, a user <strong>of</strong> a<br />
Victorian health service.<br />
636<br />
Female<br />
620<br />
534<br />
Male<br />
519<br />
Legend<br />
2007 - <strong>2008</strong><br />
2006 - 2007<br />
Figure 1<br />
Consumer Gender<br />
Fifty-five percent <strong>of</strong> complaints made were<br />
about health services received by women,<br />
<strong>the</strong> same as <strong>the</strong> previous year. There is also<br />
an age factor in complaints. For example<br />
<strong>the</strong>re were almost double <strong>the</strong> number <strong>of</strong><br />
complaints made in relation to care received<br />
by males in <strong>the</strong> 0 to 14 age group and<br />
just slightly more complaints in relation to<br />
care received by males aged over 75.<br />
In all o<strong>the</strong>r age/gender groups <strong>the</strong>re were<br />
more complaints about <strong>the</strong> care received<br />
by females.<br />
Age Range Female Male Total<br />
0 - 01 2 7 9<br />
01 - 04 6 6 12<br />
05 - 14 11 21 32<br />
15 - 24 31 14 45<br />
25 - 34 78 39 117<br />
35 - 44 94 45 139<br />
45 - 54 82 55 137<br />
55 - 64 76 75 151<br />
65 - 74 44 31 75<br />
75+ 50 53 103<br />
Unknown 144 173 319<br />
Total 620 519 1139<br />
Table 5<br />
Consumer Pr<strong>of</strong>ile<br />
14<br />
<strong>Office</strong> <strong>of</strong> <strong>the</strong> <strong>Health</strong> <strong>Services</strong> <strong>Commissioner</strong> | <strong>Annual</strong> <strong>Report</strong> <strong>2008</strong>