- Page 2 and 3:
NOTICE Certain statements contained
- Page 4 and 5:
1 Person responsible 8 1.1 Name and
- Page 6 and 7:
13 Profit forecasts or estimates 11
- Page 8 and 9:
8 PERSON RESPONSIBLE
- Page 10 and 11:
1 PERSON RESPONSIBLE 1.1 Name and t
- Page 12 and 13:
2.1 Auditors 13 2.2 Resignation or
- Page 14 and 15:
14 SELECTED FINANCIAL INFORMATION
- Page 16 and 17:
3 GROUP KEY FIGURES (UNDER CURRENT
- Page 18 and 19:
4.1 Risk related to the business en
- Page 20 and 21:
claims or surrenders of policies th
- Page 22 and 23:
B. Life reinsurance The main catego
- Page 24 and 25:
statutory reserve requirements or h
- Page 26 and 27:
B. SCOR is exposed to Guaranteed Mi
- Page 28 and 29:
4.1.9 FINANCIAL RATINGS PLAY AN IMP
- Page 30 and 31:
and amortization expenses related t
- Page 32 and 33:
F. Deposits with custodians As part
- Page 34 and 35:
4.2.2 SCOR FACES RISKS RELATED TO I
- Page 36 and 37:
Details of intangible assets, relat
- Page 38 and 39:
4.4.2 INCONSISTENT APPLICATION OF E
- Page 40 and 41:
See “Appendix B - II. Internal co
- Page 42 and 43:
5.1 History and development of the
- Page 44 and 45:
proportion of the voting rights hel
- Page 46 and 47:
Gerling Global Re Group, which deve
- Page 48 and 49:
5.2 Investments 5.2.1 PRINCIPAL INV
- Page 50 and 51:
6.1 Primary activities 53 6.2 Princ
- Page 52 and 53:
The targets of the strategic plan a
- Page 54 and 55:
B. Proportional and non-proportiona
- Page 56 and 57:
payment of commercial debts. Surety
- Page 58 and 59:
Long-Term Care Long-Term Care (“L
- Page 60 and 61:
with local lines of business and po
- Page 62 and 63:
transfer solutions (e.g., catastrop
- Page 64 and 65:
Retrocession procedures are central
- Page 66 and 67:
The portion invested in fixed incom
- Page 68 and 69:
6.2 Principal markets SCOR is chara
- Page 70 and 71:
On 6 March 2010, STOXX announced SC
- Page 72 and 73:
The premiums up for renewal, which
- Page 75 and 76:
75 ORGANIZATIONAL STRUCTURE
- Page 77:
E U R O P E 7 ORGANIZATIONAL STRUCT
- Page 80 and 81:
7.1.1.2 Project "New SCOR" In conne
- Page 82 and 83:
7.2 List of issuer’s significant
- Page 84 and 85:
8.1 Major existing or planned prope
- Page 86 and 87:
86 OPERATING AND FINANCIAL REVIEW
- Page 88 and 89:
9 OPERATING AND FINANCIAL REVIEW Th
- Page 90 and 91:
year ended 31 December 2012 down fr
- Page 92 and 93:
In 2011, SCOR was affected by the f
- Page 94 and 95:
31 March 2014. This transaction suc
- Page 96 and 97:
Net investment income and investmen
- Page 98 and 99:
IFRS classification In EUR million
- Page 100 and 101:
Combined ratio For detailed calcula
- Page 102 and 103:
10.1 Capital 103 10.2 Cash flow 103
- Page 104 and 105:
FINANCIAL LEVERAGE As at 31 Decembe
- Page 106 and 107:
11.1 Research and development activ
- Page 108 and 109:
studies and publications produced o
- Page 110 and 111:
12.1 Most significant trends in pro
- Page 112 and 113:
SCOR Global Life expects business o
- Page 114 and 115:
114 PROFIT FORECASTS OR ESTIMATES
- Page 116 and 117:
116 ADMINISTRATIVE AND MANAGEMENT B
- Page 118 and 119:
14 ADMINISTRATIVE AND MANAGEMENT BO
- Page 120 and 121:
Name Date of Birth Other principal
- Page 122 and 123:
Name Date of Birth Other principal
- Page 124 and 125:
Name Date of Birth Other principal
- Page 126 and 127:
Name Date of Birth Other principal
- Page 128 and 129:
Clariden Leu and from 10 January 20
- Page 130 and 131:
Name Age Current Position Executive
- Page 132 and 133:
of Alea Europe from 1999 to 2006, w
- Page 134 and 135:
134 REMUNERATION AND BENEFITS
- Page 136 and 137:
15 REMUNERATION AND BENEFITS 15.1 A
- Page 138 and 139:
and analysts; deepening of the empl
- Page 140 and 141:
Subscription and share purchase opt
- Page 142 and 143:
Year 2011 Year 2010 Premium/ Gross
- Page 144 and 145:
144 BOARD PRATICES
- Page 146 and 147:
16 BOARD PRATICES 16.1 Date of expi
- Page 148 and 149:
148 EMPLOYEES
- Page 150 and 151:
17 EMPLOYEES 17.1 Number of employe
- Page 152 and 153:
17.2.2 STOCK OPTIONS HELD BY THE ME
- Page 154 and 155:
Options exercised Number of stock o
- Page 156 and 157:
Plan Share award rights Price per s
- Page 158 and 159:
180 of the Commercial Code, options
- Page 160 and 161:
(5) Absolute appliance of Group’s
- Page 162 and 163:
The following table shows the free
- Page 164 and 165:
Shareholders meeting and Company's
- Page 166 and 167:
and, for the not tax resident of Fr
- Page 168 and 169:
17.4.2 DEFINED BENEFITS PENSION SCH
- Page 170 and 171:
18.1 Significant shareholders known
- Page 172 and 173:
Distribution of capital (number of
- Page 174 and 175:
On 4 July 2012, Alecta Pensionsför
- Page 176 and 177:
19.1 Related party transactions 177
- Page 178 and 179:
Amendment #7 to the retrocession ag
- Page 180 and 181:
The Board of Directors of SCOR SE,
- Page 182 and 183:
absorption of its wholly owned subs
- Page 184 and 185:
to the Facility Agreement granted/w
- Page 186 and 187:
adjusted on the date of departure b
- Page 188 and 189:
188 FINANCIAL INFORMATION CONCERNIN
- Page 190 and 191:
20 FINANCIAL INFORMATION CONCERNING
- Page 192 and 193:
LIABILITIES AS AT 31 DECEMBER In EU
- Page 194 and 195:
20.1.3 CONSOLIDATED STATEMENTS OF C
- Page 196 and 197:
20.1.5 CONSOLIDATED STATEMENTS OF C
- Page 198 and 199:
20.1.6 NOTES TO THE CONSOLIDATED FI
- Page 200 and 201:
• Amendments to IAS 19 - Employee
- Page 202 and 203:
Intangible assets The cost of intan
- Page 204 and 205:
(e) Cash and cash equivalents Cash
- Page 206 and 207: Impairment of financial assets At e
- Page 208 and 209: available and the reserves are adju
- Page 210 and 211: Shadow accounting For the measureme
- Page 212 and 213: together with actuarial assumptions
- Page 214 and 215: The following table sets forth the
- Page 216 and 217: CASH FLOWS BY SEGMENT The cash flow
- Page 218 and 219: SCOR recognised the redemption rece
- Page 220 and 221: PRO FORMA STATEMENT OF INCOME 2011
- Page 222 and 223: 2009 In EUR million (1) Provisional
- Page 224 and 225: The Group conducted its annual asse
- Page 226 and 227: 20.1.6.6 NOTE 6 - INSURANCE BUSINES
- Page 228 and 229: (B) MOVEMENTS IN LEVEL 3 FINANCIAL
- Page 230 and 231: Financial lease contracts The Group
- Page 232 and 233: At 31 December 2012 and 2011, the u
- Page 234 and 235: MORTALITY SWAPS On 1 January 2008,
- Page 236 and 237: 20.1.6.10 NOTE 10 - ASSUMED AND CED
- Page 238 and 239: Issued share capital The number of
- Page 240 and 241: CAPITAL MANAGEMENT POLICY, OBJECTIV
- Page 242 and 243: Share-based payments The caption
- Page 244 and 245: SCOR has entered into a cross-curre
- Page 246 and 247: SCOR Global P&C The table below sho
- Page 248 and 249: The table below is a reconciliation
- Page 250 and 251: (C) SHARE OF RETROCESSIONAIRES IN C
- Page 252 and 253: (c) Defined benefits pension cost 2
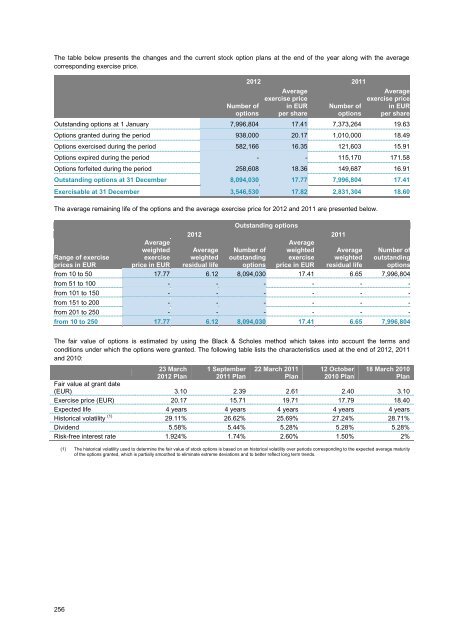
- Page 254 and 255: The following table summarizes the
- Page 258 and 259: The performance conditions will be
- Page 260 and 261: In 2010 the tax rate change impact
- Page 262 and 263: Applying the deferred tax netting m
- Page 264 and 265: These expenses are further allocate
- Page 266 and 267: In the event of termination of the
- Page 268 and 269: SIGNIFICANT SUBSIDIARIES, INVESTMEN
- Page 270 and 271: 20.1.6.25 NOTE 25 - COMMITMENTS REC
- Page 272 and 273: and documented before the pricing i
- Page 274 and 275: (iv) Pandemic In Life reinsurance,
- Page 276 and 277: Different types of GMDBs are covere
- Page 278 and 279: (b) Receivables from retrocessionai
- Page 280 and 281: (i) Default of pool members SCOR pa
- Page 282 and 283: Additional information on the timin
- Page 284 and 285: On the other hand, an increase in i
- Page 286 and 287: The market sensitivities of the Gro
- Page 288 and 289: 20.2 Auditing of historical consoli
- Page 290 and 291: Other information audited by the le
- Page 292 and 293: 21.1 Share capital 293 21.2 Charter
- Page 294 and 295: Directors of SCOR SE decided on 28
- Page 296 and 297: Number initially authorized (date o
- Page 298 and 299: Objective 1. Stimulation of the sec
- Page 300 and 301: 21.1.7 HISTORY OF THE COMPANY’S S
- Page 302 and 303: Board of Directors’ borrowing pow
- Page 304 and 305: maintained by BNP on our behalf. Ea
- Page 306 and 307:
Proxies may be granted by a shareho
- Page 308 and 309:
Shareholders’ Meeting that may ta
- Page 310 and 311:
22 MATERIAL CONTRACTS None. 310
- Page 312 and 313:
23.1 Expert’s report 313 23.2 Inf
- Page 314 and 315:
314 DOCUMENTS ON DISPLAY
- Page 316 and 317:
316 INFORMATION ON HOLDINGS
- Page 318 and 319:
318 NON FINANCIAL INFORMATION
- Page 320 and 321:
320 FEES PAID BY THE GROUP TO THE A
- Page 322 and 323:
322 PUBLISHED INFORMATION
- Page 324 and 325:
28 PUBLISHED INFORMATION 28.1 Infor
- Page 326 and 327:
Date Subject Marchés Financiers 27
- Page 328 and 329:
328
- Page 330 and 331:
1.1 Significant events of the year
- Page 332 and 333:
1.2 Balance sheet 1.2.1 BALANCE SHE
- Page 334 and 335:
1.3 Income statement In EUR million
- Page 336 and 337:
In EUR million NON-UNDERWRITING ACC
- Page 338 and 339:
1.5 NOTES TO THE CORPORATE FINANCIA
- Page 340 and 341:
1.7 RECORDING OF REINSURANCE TRANSA
- Page 342 and 343:
1.12 FINANCIAL INSTRUMENTS RECEIVED
- Page 344 and 345:
Name Original currency Share capita
- Page 346 and 347:
NOTE 4 - TRANSACTIONS WITH SUBSIDIA
- Page 348 and 349:
(b) Financial liabilities • Initi
- Page 350 and 351:
• EUR 44 million in reserves for
- Page 352 and 353:
NOTE 10 - ANALYSIS OF GENERAL EXPEN
- Page 354 and 355:
Number of which to Group directors
- Page 356 and 357:
NOTE 15 - ANALYSIS OF COMMITMENTS G
- Page 358 and 359:
Appeal of Versailles. On the basis
- Page 360 and 361:
aforementioned notes is appropriate
- Page 362 and 363:
362 APPENDIX B: REPORT OF THE CHAIR
- Page 364 and 365:
APPENDIX B: REPORT OF THE CHAIRMAN
- Page 366 and 367:
Pursuant to the Internal Charter, t
- Page 368 and 369:
Lastly, Directors are required to i
- Page 370 and 371:
The Audit Committee is composed of
- Page 372 and 373:
Every year, the conditions of remun
- Page 374 and 375:
Moreover, the Chairman and Chief Ex
- Page 376 and 377:
The Group SCOR consists of the pare
- Page 378 and 379:
Within this environment, control re
- Page 380 and 381:
organization, training sessions tar
- Page 382 and 383:
For SCOR Global Life: - an internal
- Page 384 and 385:
(D) INFORMATION AND COMMUNICATION
- Page 386 and 387:
• enhanced audit trail. The initi
- Page 388 and 389:
Other information We confirm that t
- Page 390 and 391:
APPENDIX C: GLOSSARY* *This glossar
- Page 392 and 393:
D DECENNIAL INSURANCE Decennial ins
- Page 394 and 395:
M MARINE AND AVIATION INSURANCE ALS
- Page 396 and 397:
RETROCESSION Transaction in which t
- Page 398 and 399:
elevant at the date of acquisition.
- Page 400 and 401:
1 Operating and financial review of
- Page 402 and 403:
1.2 Operating results of SCOR SE du
- Page 404 and 405:
3.2 Group social indicators 3.2.1 D
- Page 406 and 407:
As a global company organised into
- Page 408 and 409:
3.2.10 Distribution by age Indicato
- Page 410 and 411:
in cooperation with the company doc
- Page 412 and 413:
- The items pertain to the entire G
- Page 414 and 415:
• Two approaches have been develo
- Page 416 and 417:
POLLUTION AND WASTE MANAGEMENT Info
- Page 418 and 419:
BIODIVERSITY PROTECTION formation r
- Page 420 and 421:
The Group’s French subsidiaries a
- Page 422 and 423:
5.5 OTHER ACTIONS TAKEN IN SUPPORT
- Page 424 and 425:
7 STATUTORY AUDITORS’REPORT ON TH
- Page 426 and 427:
426 APPENDIX E: CROSS REFERENCE TAB
- Page 428:
European Company With a share capit