Evaluating X-parameter*, P2D and S2D Models for Characterizing ...
Evaluating X-parameter*, P2D and S2D Models for Characterizing ...
Evaluating X-parameter*, P2D and S2D Models for Characterizing ...

Create successful ePaper yourself
Turn your PDF publications into a flip-book with our unique Google optimized e-Paper software.
High Frequency Design<br />
Modeling-Power Amps<br />
<strong>Evaluating</strong> X-<strong>parameter*</strong>, <strong>P2D</strong><br />
<strong>and</strong> <strong>S2D</strong> <strong>Models</strong> <strong>for</strong><br />
<strong>Characterizing</strong> Nonlinear<br />
Behavior in Active Devices<br />
By Jiang Liu <strong>and</strong> Hugo Morales, Modelithics Inc.; Lawrence P. Dunleavy, Modelithics Inc.<br />
<strong>and</strong> University of South Florida; <strong>and</strong> Loren Betts, Agilent Technologies<br />
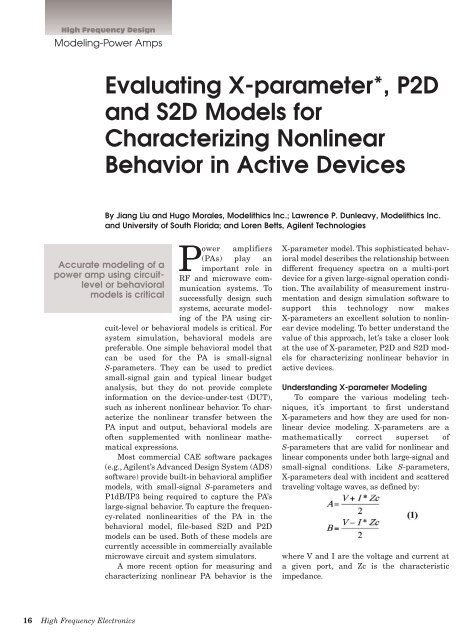
Power amplifiers<br />
(PAs) play an<br />
Accurate modeling of a important role in<br />
power amp using circuitlevel<br />
or behavioral munication systems. To<br />
RF <strong>and</strong> microwave com-<br />
models is critical successfully design such<br />
systems, accurate modeling<br />
of the PA using circuit-level<br />
or behavioral models is critical. For<br />
system simulation, behavioral models are<br />
preferable. One simple behavioral model that<br />
can be used <strong>for</strong> the PA is small-signal<br />
S-parameters. They can be used to predict<br />
small-signal gain <strong>and</strong> typical linear budget<br />
analysis, but they do not provide complete<br />
in<strong>for</strong>mation on the device-under-test (DUT),<br />
such as inherent nonlinear behavior. To characterize<br />
the nonlinear transfer between the<br />
PA input <strong>and</strong> output, behavioral models are<br />
often supplemented with nonlinear mathematical<br />
expressions.<br />
Most commercial CAE software packages<br />
(e.g., Agilent’s Advanced Design System (ADS)<br />
software) provide built-in behavioral amplifier<br />
models, with small-signal S-parameters <strong>and</strong><br />
P1dB/IP3 being required to capture the PA’s<br />
large-signal behavior. To capture the frequency-related<br />
nonlinearities of the PA in the<br />
behavioral model, file-based <strong>S2D</strong> <strong>and</strong> <strong>P2D</strong><br />
models can be used. Both of these models are<br />
currently accessible in commercially available<br />
microwave circuit <strong>and</strong> system simulators.<br />
A more recent option <strong>for</strong> measuring <strong>and</strong><br />
characterizing nonlinear PA behavior is the<br />
X-parameter model. This sophisticated behavioral<br />
model describes the relationship between<br />
different frequency spectra on a multi-port<br />
device <strong>for</strong> a given large-signal operation condition.<br />
The availability of measurement instrumentation<br />
<strong>and</strong> design simulation software to<br />
support this technology now makes<br />
X-parameters an excellent solution to nonlinear<br />
device modeling. To better underst<strong>and</strong> the<br />
value of this approach, let’s take a closer look<br />
at the use of X-parameter, <strong>P2D</strong> <strong>and</strong> <strong>S2D</strong> models<br />
<strong>for</strong> characterizing nonlinear behavior in<br />
active devices.<br />
Underst<strong>and</strong>ing X-parameter Modeling<br />
To compare the various modeling techniques,<br />
it’s important to first underst<strong>and</strong><br />
X-parameters <strong>and</strong> how they are used <strong>for</strong> nonlinear<br />
device modeling. X-parameters are a<br />
mathematically correct superset of<br />
S-parameters that are valid <strong>for</strong> nonlinear <strong>and</strong><br />
linear components under both large-signal <strong>and</strong><br />
small-signal conditions. Like S-parameters,<br />
X-parameters deal with incident <strong>and</strong> scattered<br />
traveling voltage waves, as defined by:<br />
where V <strong>and</strong> I are the voltage <strong>and</strong> current at<br />
a given port, <strong>and</strong> Zc is the characteristic<br />
impedance.<br />
16 High Frequency Electronics
High Frequency Design<br />
Modeling-Power Amps<br />
For comparison, note that 2-port S-parameters are<br />
defined as:<br />
where a i<br />
<strong>and</strong> b i<br />
are the incident <strong>and</strong> scattered traveling<br />
waves at port i (i = 1, 2). The X-parameter model can be<br />
defined as:<br />
F (S )<br />
b ij<br />
= X ij ( A11 )P j<br />
+ (X ij,kl ( A11 )P j −l (T )<br />
a kl<br />
+ X ij,kl ( A11 )P j +l *<br />
a kl )<br />
∑<br />
k,l ≠(1,1)<br />
(3)<br />
where A 11<br />
is the large signal driven into port 1 at the<br />
fundamental frequency. Index i is the output port, j is the<br />
output frequency index, k is the input port, <strong>and</strong> l is the<br />
input frequency index.<br />
Comparing b ij<br />
from Equation 3 to b i<br />
in Equation 2, it’s<br />
obvious that the X-parameter model provides not only the<br />
fundamental tone frequency mapping, but harmonic frequency<br />
mapping as well. Granted Equation 3 looks complex,<br />
but in a simulator the actual X-parameter model is<br />
very easy to underst<strong>and</strong> <strong>and</strong> closely correlates to the<br />
equation.<br />
X-parameters can be generated in one of two ways—<br />
either from a nonlinear simulation of a circuit-level<br />
design using ADS software or through actual measurement<br />
using Agilent’s Nonlinear Vector Network Analyzer<br />
(NVNA) running on the PNA-X network analyzer.<br />
Whether created or measured, X-parameters can be easily<br />
imported into ADS <strong>and</strong> then dropped into a component<br />
or system to start the design process or <strong>for</strong> use with ADS<br />
linear, harmonic balance or circuit envelope simulation.<br />
Figure 1 • A comparison<br />
of the simulated <strong>and</strong><br />
measured gain compression<br />
results, with the<br />
frequency at 715 MHz.<br />
The source <strong>and</strong> load<br />
reflection coefficients<br />
up to the 3rd harmonics<br />
are given.<br />
Comparing Modeling Techniques<br />
To compare the <strong>S2D</strong> <strong>and</strong> <strong>P2D</strong> models with the<br />
X-parameter model, consider the example of a surface<br />
mount RFIC amplifier. In this case, the device used as the<br />
DUT is the RFMD RF2878 LNA/PA driver, which operates<br />
between 150 MHz to 2.5 GHz, with a typical gain of<br />
around 20 dB <strong>and</strong> typical bias at Vcc <strong>and</strong> Vpd of 3 <strong>and</strong> 2.8<br />
V, respectively. Both the small-signal <strong>and</strong> power-swept<br />
S-parameter data was obtained using a traditional vector<br />
network analyzer (HP 8753D). All model setups <strong>and</strong><br />
simulations were per<strong>for</strong>med using Agilent’s ADS simulation<br />
environment.<br />
X-parameters were measured using the PNA-X NVNA<br />
under a 50 ohm condition (no impedance tuners) with a<br />
one-tone large stimulus at the input (A 11<br />
). One-tone <strong>and</strong><br />
two-tone large signal load-pull measurements were taken<br />
using a Maury ATS system combined with conventional<br />
spectrum analyzer, power meter <strong>and</strong> signal source equipment.<br />
The resulting measurements yielded an independent<br />
nonlinear verification dataset.<br />
The <strong>P2D</strong> <strong>and</strong> <strong>S2D</strong> models were created based on the<br />
small-signal S-parameter data files <strong>and</strong> the 50 ohm powerswept<br />
S-parameter measurement dataset. These two models,<br />
as well as the X-parameter model, were then exercised<br />
against the load-pull one-tone <strong>and</strong> two-tone measurement<br />
datasets to predict 50 ohm gain compression, harmonics,<br />
source/load tuned gain compression <strong>and</strong> IP3.<br />
<strong>Evaluating</strong> the Results<br />
The near 50 ohm gain compression result <strong>for</strong> the <strong>P2D</strong>,<br />
<strong>S2D</strong> <strong>and</strong> X-parameter models, along with the measured<br />
dataset, is shown in Figure 1. Overall, the X-parameter<br />
model predicted the measured gain better, especially over<br />
the -8 to 0 dBm input power range.<br />
The gain compression <strong>and</strong> output power results simulated<br />
by all three models, with the source <strong>and</strong> load impedances<br />
tuned <strong>for</strong> maximum output power, are shown in<br />
Figures 2a – 2c. Figure 2a shows that the <strong>P2D</strong> <strong>and</strong> <strong>S2D</strong><br />
models provide similar results. The X-parameter model<br />
shows gain expansion behavior after -7 dBm, providing a<br />
much better match to the measured load-pull result. It<br />
also demonstrates excellent ability to predict the 2nd <strong>and</strong><br />
3rd order harmonics (Figure 2b). In fact, this specific<br />
measured X-parameter model was set up to capture up to<br />
the 5th harmonic order.<br />
By comparison, the <strong>P2D</strong> model doesn’t predict harmonics<br />
in the ADS Harmonic Balance simulator. Instead,<br />
an envelope domain simulator must be used. The <strong>S2D</strong><br />
model does predict the 3rd harmonic, however, only oddorder<br />
harmonics are predicted (Figure 2c). Moreover, the<br />
predicted 3rd order harmonic does not match the measurement<br />
well under this tuned source/load impedance<br />
condition.<br />
18 High Frequency Electronics
High Frequency Design<br />
Modeling-Power Amps<br />
GammaS=0.43967+ j*0.12716<br />
GammaS2=0.10354+ j*0.19389<br />
GammaS3=0.12105+ j*0.32442<br />
GammaL= -0.02317+ j*0.32563<br />
GammaL2=0.19514 - j*0.17270<br />
GammaL3=0.17070 - j*0.13224<br />
(a) Comparison of the gain compression <strong>and</strong> Pout simulated by the <strong>P2D</strong>, <strong>S2D</strong> <strong>and</strong> X-parameter models.<br />
(b) X-parameter model simulated output spectrum compared<br />
to measured results<br />
(c) <strong>S2D</strong> simulated output spectrum. The 2nd (or evenorder)<br />
harmonics are suppressed.<br />
Figure 2 • Shown here is a comparison of the gain compression <strong>and</strong> P out<br />
simulated by the three models under<br />
source- <strong>and</strong> load-tuned conditions, with the frequency at 470 MHz.<br />
Lastly, the <strong>P2D</strong> <strong>and</strong> X-parameter models can be<br />
exercised using an envelope domain simulation to simulate<br />
the two-tone intermodulation products. Since both<br />
<strong>P2D</strong> <strong>and</strong> X-parameter models used were frequency<br />
domain mapping, an envelope simulator is required to<br />
simulate the IM3. The setup <strong>for</strong> this exercise is shown in<br />
Figure 3.<br />
A comparison of the simulated <strong>and</strong> measured results<br />
is shown in Figure 4. As be<strong>for</strong>e, the X-parameters were<br />
measured in a 50 ohm environment with no tuners using<br />
the NVNA with a one-tone large signal stimulus. The<br />
independent measured results were taken using the<br />
Maury ATS system as previously described, with a center<br />
frequency at 960 MHz <strong>and</strong> a spacing of 1 MHz. The input<br />
power sweeps from -18 to 3 dBm. Both source <strong>and</strong> load<br />
impedances are tuned <strong>for</strong> optimal IP3.<br />
Overall, the X-parameter model provided better agreement<br />
to the measured IM3 compared to the <strong>P2D</strong> model.<br />
The resulting impedances used to maximize IP3 are at<br />
varying gammas away from the 50 ohms. This illustrates<br />
the mobility of the X-parameter model to accurately predict<br />
behavior outside the impedance environment (beyond<br />
50 ohm) used during measurements of the model. The<br />
one-tone X-parameter model also accurately predicted<br />
the two-tone IM3 results <strong>for</strong> this particular device. The<br />
discrepancy at low power levels is due to the noise floor<br />
limit in the measurement system. The <strong>P2D</strong> model shows<br />
a convergence issue after -3 dBm, there<strong>for</strong>e, the given<br />
result is limited in the input RF power. Still, the IM3 in<br />
the limited range shows a worse comparison to the measured<br />
results.<br />
20 High Frequency Electronics
High Frequency Design<br />
Modeling-Power Amps<br />
Figure 3 • Depicted here is an example envelope simulation schematic using the X-parameter mode (sim_mode<br />
of 1) of the AMP_RFMD_2878 model.<br />
Conclusion<br />
The X-parameter, <strong>S2D</strong> <strong>and</strong> <strong>P2D</strong> models all provide a<br />
viable way <strong>for</strong> engineers to capture a PA’s nonlinear<br />
behavior. The X-parameter modeling technique provides<br />
a more accurate way to measure <strong>and</strong> characterize the<br />
nonlinear PA behavior through the capture of the fundamental<br />
<strong>and</strong> harmonic components at different drive levels.<br />
This complete view is invaluable when it comes to<br />
predicting the harmonics <strong>and</strong> IM3. When only the fundamental<br />
tone is of interest, the <strong>P2D</strong> <strong>and</strong> <strong>S2D</strong> modeling<br />
techniques may be more convenient to construct since<br />
they are based on the small-signal <strong>and</strong> power swept<br />
S-parameter measurements using conventional VNAs.<br />
However, when more accurate prediction of device behavior<br />
is required, X-parameters clearly offer the better<br />
choice.<br />
For more in<strong>for</strong>mation, go to: www.agilent.com/find/<br />
nvna. To download free PNA-X application notes on nonlinear<br />
power amplifier design, go to: www.agilent.com/<br />
find/pnaxapps.<br />
*X-parameters is a trademark of Agilent Technologies.<br />
The X-parameter <strong>for</strong>mat <strong>and</strong> underlying equations are<br />
open <strong>and</strong> documented. For more in<strong>for</strong>mation, visit www.<br />
agilent.com/find/eesof-x-parameters-info.<br />
About the Authors<br />
Dr. Jiang Liu joined Modelithics in 2006, <strong>and</strong> works as<br />
a modeling engineer with expertise in device, circuit <strong>and</strong><br />
system characterization, <strong>and</strong> modeling. He received his<br />
B.S.E.E from Nanjing University of Telecom <strong>and</strong> Posts in<br />
1996, <strong>and</strong> M.S.E.E <strong>and</strong> Ph.D. degrees in 2002 <strong>and</strong> 2005,<br />
respectively, from the University of South Florida.<br />
Hugo I. Morales has worked as an engineering project<br />
leader with Modelithics, Inc. Tampa, FL since 2006. He<br />
has expertise in complex RF <strong>and</strong> microwave transistor<br />
characterization, passive component <strong>and</strong> diode modeling.<br />
Mr. Morales received his B.S.E.E. degree in 2002 from the<br />
University of South Florida <strong>and</strong> is presently working on<br />
his M.S.E.E. degree with emphasis in material characterization.<br />
Lawrence P. Dunleavy co-founded Modelithics, Inc. in<br />
2001 <strong>and</strong> currently serves as its president & CEO. He<br />
also maintains a part-time position as a tenured Professor<br />
within the University of San Francisco’s Department of<br />
Electrical Engineering. Dr. Dunleavy received his B.S.E.E.<br />
22 High Frequency Electronics
(a) X-parameter model simulated fundamental <strong>and</strong><br />
IM3 tones compared to measured results.<br />
(b) <strong>P2D</strong> model simulated fundamental <strong>and</strong> IM3 tones<br />
compared to measured results.<br />
Figure 4 • A comparison of the simulated<br />
fundamental <strong>and</strong> IM3 tones<br />
from both X-parameter <strong>and</strong> <strong>P2D</strong><br />
models to measured results.<br />
degree from Michigan Technological<br />
University in 1982 <strong>and</strong> his M.S.E.E.<br />
<strong>and</strong> Ph.D. degrees in 1984 <strong>and</strong> 1988,<br />
respectively, from the University of<br />
Michigan. He is a Senior Member of<br />
IEEE, <strong>and</strong> is active in the IEEE MTT<br />
Society <strong>and</strong> the Automatic RF<br />
Techniques Group.<br />
Loren Betts is a research scientist<br />
<strong>and</strong> senior engineer at Agilent<br />
Technologies focusing on complex<br />
stimulus/response measurements<br />
<strong>and</strong> modeling of nonlinear components<br />
utilizing vector network analyzers.<br />
He co-developed the pulse<br />
measurement detection algorithms<br />
utilized in Agilent’s PNA <strong>and</strong> PNA-X<br />
vector network analyzers. Loren<br />
holds a B.Sc. degree in computer<br />
engineering <strong>and</strong> M.Sc. <strong>and</strong> Ph.D.<br />
degrees in electrical engineering. His<br />
Ph.D. research focused on the PNA-X<br />
Nonlinear Vector Network Analyzer.