Summary of Workplace Injury, Illness and Fatality Statistics 2007-2008
Summary of Workplace Injury, Illness and Fatality Statistics 2007-2008
Summary of Workplace Injury, Illness and Fatality Statistics 2007-2008

You also want an ePaper? Increase the reach of your titles
YUMPU automatically turns print PDFs into web optimized ePapers that Google loves.
HSA <strong>Summary</strong> <strong>of</strong> <strong>Injury</strong>, <strong>Illness</strong> <strong>and</strong> <strong>Fatality</strong> <strong>Statistics</strong> <strong>2007</strong> - <strong>2008</strong><br />
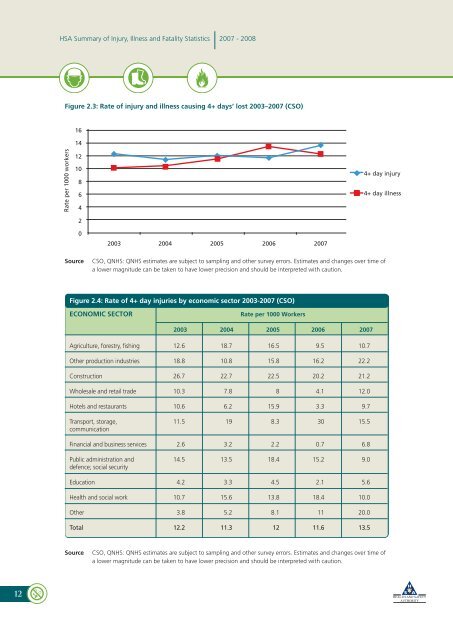
Figure 2.3: Rate <strong>of</strong> injury <strong>and</strong> illness causing 4+ days’ lost 2003–<strong>2007</strong> (CSO)<br />
16<br />
14<br />
Rate per 1000 workers<br />
12<br />
10<br />
8<br />
6<br />
4<br />
4+ day injury<br />
4+ day illness<br />
2<br />
0<br />
2003<br />
2004 2005 2006 <strong>2007</strong><br />
Source<br />
CSO, QNHS: QNHS estimates are subject to sampling <strong>and</strong> other survey errors. Estimates <strong>and</strong> changes over time <strong>of</strong><br />
a lower magnitude can be taken to have lower precision <strong>and</strong> should be interpreted with caution.<br />
Figure 2.4: Rate <strong>of</strong> 4+ day injuries by economic sector 2003-<strong>2007</strong> (CSO)<br />
ECONOMIC SECTOR<br />
Rate per 1000 Workers<br />
2003 2004 2005 2006 <strong>2007</strong><br />
Agriculture, forestry, fishing 12.6 18.7 16.5 9.5 10.7<br />
Other production industries 18.8 10.8 15.8 16.2 22.2<br />
Construction 26.7 22.7 22.5 20.2 21.2<br />
Wholesale <strong>and</strong> retail trade 10.3 7.8 8 4.1 12.0<br />
Hotels <strong>and</strong> restaurants 10.6 6.2 15.9 3.3 9.7<br />
Transport, storage, 11.5 19 8.3 30 15.5<br />
communication<br />
Financial <strong>and</strong> business services 2.6 3.2 2.2 0.7 6.8<br />
Public administration <strong>and</strong> 14.5 13.5 18.4 15.2 9.0<br />
defence; social security<br />
Education 4.2 3.3 4.5 2.1 5.6<br />
Health <strong>and</strong> social work 10.7 15.6 13.8 18.4 10.0<br />
Other 3.8 5.2 8.1 11 20.0<br />
Total 12.2 11.3 12 11.6 13.5<br />
Source<br />
CSO, QNHS: QNHS estimates are subject to sampling <strong>and</strong> other survey errors. Estimates <strong>and</strong> changes over time <strong>of</strong><br />
a lower magnitude can be taken to have lower precision <strong>and</strong> should be interpreted with caution.<br />
12