Summary of Workplace Injury, Illness and Fatality Statistics 2007-2008
Summary of Workplace Injury, Illness and Fatality Statistics 2007-2008
Summary of Workplace Injury, Illness and Fatality Statistics 2007-2008
Create successful ePaper yourself
Turn your PDF publications into a flip-book with our unique Google optimized e-Paper software.
HSA <strong>Summary</strong> <strong>of</strong> <strong>Injury</strong>, <strong>Illness</strong> <strong>and</strong> <strong>Fatality</strong> <strong>Statistics</strong> <strong>2007</strong> - <strong>2008</strong><br />
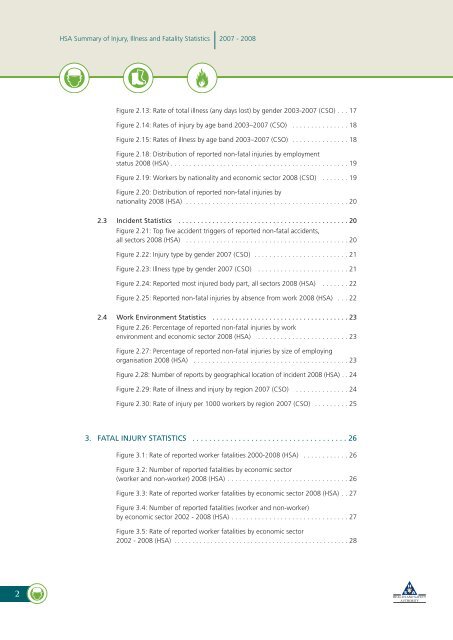
Figure 2.13: Rate <strong>of</strong> total illness (any days lost) by gender 2003-<strong>2007</strong> (CSO) . . . 17<br />
Figure 2.14: Rates <strong>of</strong> injury by age b<strong>and</strong> 2003–<strong>2007</strong> (CSO) . . . . . . . . . . . . . . . 18<br />
Figure 2.15: Rates <strong>of</strong> illness by age b<strong>and</strong> 2003–<strong>2007</strong> (CSO) . . . . . . . . . . . . . . . 18<br />
Figure 2.18: Distribution <strong>of</strong> reported non-fatal injuries by employment<br />
status <strong>2008</strong> (HSA) . . . . . . . . . . . . . . . . . . . . . . . . . . . . . . . . . . . . . . . . . . . . . . . 19<br />
Figure 2.19: Workers by nationality <strong>and</strong> economic sector <strong>2008</strong> (CSO) . . . . . . . 19<br />
Figure 2.20: Distribution <strong>of</strong> reported non-fatal injuries by<br />
nationality <strong>2008</strong> (HSA) . . . . . . . . . . . . . . . . . . . . . . . . . . . . . . . . . . . . . . . . . . . 20<br />
2.3 Incident <strong>Statistics</strong> . . . . . . . . . . . . . . . . . . . . . . . . . . . . . . . . . . . . . . . . . . . . . 20<br />
Figure 2.21: Top five accident triggers <strong>of</strong> reported non-fatal accidents,<br />
all sectors <strong>2008</strong> (HSA) . . . . . . . . . . . . . . . . . . . . . . . . . . . . . . . . . . . . . . . . . . . 20<br />
Figure 2.22: <strong>Injury</strong> type by gender <strong>2007</strong> (CSO) . . . . . . . . . . . . . . . . . . . . . . . . . 21<br />
Figure 2.23: <strong>Illness</strong> type by gender <strong>2007</strong> (CSO) . . . . . . . . . . . . . . . . . . . . . . . . 21<br />
Figure 2.24: Reported most injured body part, all sectors <strong>2008</strong> (HSA) . . . . . . . 22<br />
Figure 2.25: Reported non-fatal injuries by absence from work <strong>2008</strong> (HSA) . . . 22<br />
2.4 Work Environment <strong>Statistics</strong> . . . . . . . . . . . . . . . . . . . . . . . . . . . . . . . . . . . . 23<br />
Figure 2.26: Percentage <strong>of</strong> reported non-fatal injuries by work<br />
environment <strong>and</strong> economic sector <strong>2008</strong> (HSA) . . . . . . . . . . . . . . . . . . . . . . . . 23<br />
Figure 2.27: Percentage <strong>of</strong> reported non-fatal injuries by size <strong>of</strong> employing<br />
organisation <strong>2008</strong> (HSA) . . . . . . . . . . . . . . . . . . . . . . . . . . . . . . . . . . . . . . . . . 23<br />
Figure 2.28: Number <strong>of</strong> reports by geographical location <strong>of</strong> incident <strong>2008</strong> (HSA) . . 24<br />
Figure 2.29: Rate <strong>of</strong> illness <strong>and</strong> injury by region <strong>2007</strong> (CSO) . . . . . . . . . . . . . . 24<br />
Figure 2.30: Rate <strong>of</strong> injury per 1000 workers by region <strong>2007</strong> (CSO) . . . . . . . . . 25<br />
3. FATAL INJURY STATISTICS . . . . . . . . . . . . . . . . . . . . . . . . . . . . . . . . . . . . . 26<br />
Figure 3.1: Rate <strong>of</strong> reported worker fatalities 2000-<strong>2008</strong> (HSA) . . . . . . . . . . . . 26<br />
Figure 3.2: Number <strong>of</strong> reported fatalities by economic sector<br />
(worker <strong>and</strong> non-worker) <strong>2008</strong> (HSA) . . . . . . . . . . . . . . . . . . . . . . . . . . . . . . . . 26<br />
Figure 3.3: Rate <strong>of</strong> reported worker fatalities by economic sector <strong>2008</strong> (HSA) . . 27<br />
Figure 3.4: Number <strong>of</strong> reported fatalities (worker <strong>and</strong> non-worker)<br />
by economic sector 2002 - <strong>2008</strong> (HSA) . . . . . . . . . . . . . . . . . . . . . . . . . . . . . . . 27<br />
Figure 3.5: Rate <strong>of</strong> reported worker fatalities by economic sector<br />
2002 - <strong>2008</strong> (HSA) . . . . . . . . . . . . . . . . . . . . . . . . . . . . . . . . . . . . . . . . . . . . . . . . 28<br />
2


