Summary of Workplace Injury, Illness and Fatality Statistics 2007-2008
Summary of Workplace Injury, Illness and Fatality Statistics 2007-2008
Summary of Workplace Injury, Illness and Fatality Statistics 2007-2008

You also want an ePaper? Increase the reach of your titles
YUMPU automatically turns print PDFs into web optimized ePapers that Google loves.
Working to create a National Culture <strong>of</strong> Excellence in <strong>Workplace</strong> Safety, Health <strong>and</strong> Welfare for Irel<strong>and</strong><br />
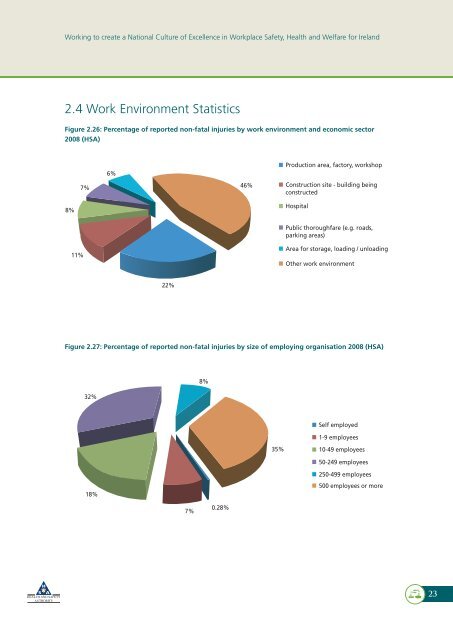
2.4 Work Environment <strong>Statistics</strong><br />
Figure 2.26: Percentage <strong>of</strong> reported non-fatal injuries by work environment <strong>and</strong> economic sector<br />
<strong>2008</strong> (HSA)<br />
7%<br />
6%<br />
46%<br />
Production area, factory, workshop<br />
Construction site - building being<br />
constructed<br />
8%<br />
Hospital<br />
Public thoroughfare (e.g. roads,<br />
parking areas)<br />
11%<br />
Area for storage, loading / unloading<br />
Other work environment<br />
22%<br />
Figure 2.27: Percentage <strong>of</strong> reported non-fatal injuries by size <strong>of</strong> employing organisation <strong>2008</strong> (HSA)<br />
32%<br />
8%<br />
Self employed<br />
1-9 employees<br />
35%<br />
10-49 employees<br />
50-249 employees<br />
18%<br />
250-499 employees<br />
500 employees or more<br />
7%<br />
0.28%<br />
23