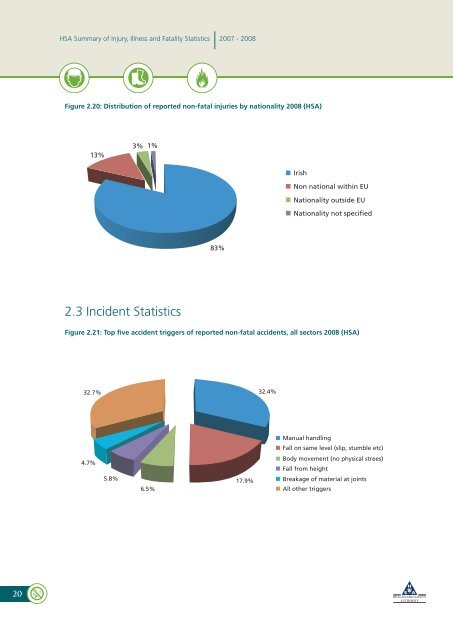
HSA <strong>Summary</strong> <strong>of</strong> <strong>Injury</strong>, <strong>Illness</strong> <strong>and</strong> <strong>Fatality</strong> <strong>Statistics</strong> <strong>2007</strong> - <strong>2008</strong> Figure 2.20: Distribution <strong>of</strong> reported non-fatal injuries by nationality <strong>2008</strong> (HSA) 13% 3% 1% Irish Non national within EU Nationality outside EU Nationality not specified 83% 2.3 Incident <strong>Statistics</strong> Figure 2.21: Top five accident triggers <strong>of</strong> reported non-fatal accidents, all sectors <strong>2008</strong> (HSA) 32.7% 32.4% Manual h<strong>and</strong>ling Fall on same level (slip, stumble etc) 4.7% 5.8% 6.5% 17.9% Body movement (no physical strees) Fall from height Breakage <strong>of</strong> material at joints All other triggers 20
Working to create a National Culture <strong>of</strong> Excellence in <strong>Workplace</strong> Safety, Health <strong>and</strong> Welfare for Irel<strong>and</strong> Figure 2.22: <strong>Injury</strong> type by gender <strong>2007</strong> (CSO) Male Female Total <strong>Injury</strong> Type Number Rate Number Rate Number Rate Wound or superficial injury 17,600 14.6 4,600 5.0 22,200 10.4 Bone fracture 6,500 5.4 2,300 2.5 8,700 4.1 Dislocation, sprain or strain 13,600 11.3 5,900 6.4 19,500 9.1 Amputation, concussion, 2,800 2.3 1,600 1.7 4,500 2.1 internal injury, burn, scald or frost bite Poisoning, infection, suffoca- 6,100 5.0 3,300 3.6 9,355 4.4 tion (asphyxiation), other type <strong>of</strong> injury <strong>and</strong> Not stated Total 46,500 38.5 17,700 19.1 64,200 30.1 Source CSO, QNHS: QNHS estimates are subject to sampling <strong>and</strong> other survey errors. Estimates <strong>and</strong> changes over time <strong>of</strong> a lower magnitude can be taken to have lower precision <strong>and</strong> should be interpreted with caution. Figure 2.23: <strong>Illness</strong> type by gender <strong>2007</strong> (CSO) Male Female Total <strong>Illness</strong> Type Number Rate Number Rate Number Rate Bone, joint or muscle problem 19,300 16.0 9,800 10.6 29,139 31.5 Breathing or lung problem 3,000 2.5 1,100 1.2 4,059 4.4 Hearing problem, headache 3,600 3.0 3,000 3.2 6,570 7.1 <strong>and</strong> or eyestrain, heart disease or attack, circulatory system problem, disease (virus, bacteria, cancer or other type <strong>of</strong> disease) Stress, depression anxiety 4,500 3.7 7,800 8.4 12,373 13.4 Skin problem, other types <strong>of</strong> 3,000 2.5 4,200 4.5 7,133 7.7 complaint <strong>and</strong> including not stated Total 33,300 27.6 26,000 28.1 59,300 27.8 Source CSO, QNHS: QNHS estimates are subject to sampling <strong>and</strong> other survey errors. Estimates <strong>and</strong> changes over time <strong>of</strong> a lower magnitude can be taken to have lower precision <strong>and</strong> should be interpreted with caution. 21