Summary of Workplace Injury, Illness and Fatality Statistics 2007-2008
Summary of Workplace Injury, Illness and Fatality Statistics 2007-2008
Summary of Workplace Injury, Illness and Fatality Statistics 2007-2008

You also want an ePaper? Increase the reach of your titles
YUMPU automatically turns print PDFs into web optimized ePapers that Google loves.
Working to create a National Culture <strong>of</strong> Excellence in <strong>Workplace</strong> Safety, Health <strong>and</strong> Welfare for Irel<strong>and</strong><br />
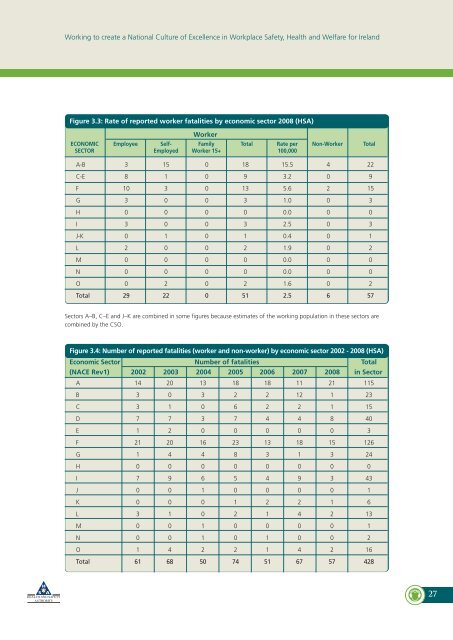
Figure 3.3: Rate <strong>of</strong> reported worker fatalities by economic sector <strong>2008</strong> (HSA)<br />
Worker<br />
ECONOMIC Employee Self- Family Total Rate per Non-Worker Total<br />
SECTOR Employed Worker 15+ 100,000<br />
A-B 3 15 0 18 15.5 4 22<br />
C-E 8 1 0 9 3.2 0 9<br />
F 10 3 0 13 5.6 2 15<br />
G 3 0 0 3 1.0 0 3<br />
H 0 0 0 0 0.0 0 0<br />
I 3 0 0 3 2.5 0 3<br />
J-K 0 1 0 1 0.4 0 1<br />
L 2 0 0 2 1.9 0 2<br />
M 0 0 0 0 0.0 0 0<br />
N 0 0 0 0 0.0 0 0<br />
O 0 2 0 2 1.6 0 2<br />
Total 29 22 0 51 2.5 6 57<br />
Sectors A–B, C–E <strong>and</strong> J–K are combined in some figures because estimates <strong>of</strong> the working population in these sectors are<br />
combined by the CSO.<br />
Figure 3.4: Number <strong>of</strong> reported fatalities (worker <strong>and</strong> non-worker) by economic sector 2002 - <strong>2008</strong> (HSA)<br />
Economic Sector Number <strong>of</strong> fatalities Total<br />
(NACE Rev1) 2002 2003 2004 2005 2006 <strong>2007</strong> <strong>2008</strong> in Sector<br />
A 14 20 13 18 18 11 21 115<br />
B 3 0 3 2 2 12 1 23<br />
C 3 1 0 6 2 2 1 15<br />
D 7 7 3 7 4 4 8 40<br />
E 1 2 0 0 0 0 0 3<br />
F 21 20 16 23 13 18 15 126<br />
G 1 4 4 8 3 1 3 24<br />
H 0 0 0 0 0 0 0 0<br />
I 7 9 6 5 4 9 3 43<br />
J 0 0 1 0 0 0 0 1<br />
K 0 0 0 1 2 2 1 6<br />
L 3 1 0 2 1 4 2 13<br />
M 0 0 1 0 0 0 0 1<br />
N 0 0 1 0 1 0 0 2<br />
O 1 4 2 2 1 4 2 16<br />
Total 61 68 50 74 51 67 57 428<br />
27