Summary of Workplace Injury, Illness and Fatality Statistics 2007-2008
Summary of Workplace Injury, Illness and Fatality Statistics 2007-2008
Summary of Workplace Injury, Illness and Fatality Statistics 2007-2008

You also want an ePaper? Increase the reach of your titles
YUMPU automatically turns print PDFs into web optimized ePapers that Google loves.
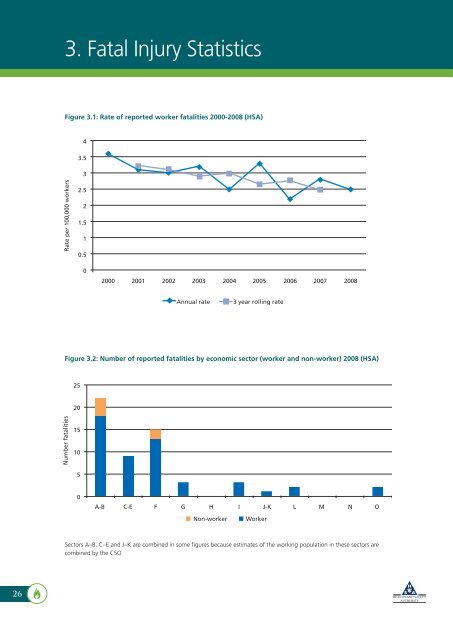
3. Fatal <strong>Injury</strong> <strong>Statistics</strong><br />
Figure 3.1: Rate <strong>of</strong> reported worker fatalities 2000-<strong>2008</strong> (HSA)<br />
4<br />
3.5<br />
3<br />
Rate per 100,000 workers<br />
2.5<br />
2<br />
1.5<br />
1<br />
0.5<br />
0<br />
2000 2001 2002 2003 2004 2005 2006 <strong>2007</strong> <strong>2008</strong><br />
Annual rate<br />
3 year rolling rate<br />
Figure 3.2: Number <strong>of</strong> reported fatalities by economic sector (worker <strong>and</strong> non-worker) <strong>2008</strong> (HSA)<br />
25<br />
20<br />
Number fatalities<br />
15<br />
10<br />
5<br />
0<br />
A-B C-E F G H I J-K L M N O<br />
Non-worker<br />
Worker<br />
Sectors A–B, C–E <strong>and</strong> J–K are combined in some figures because estimates <strong>of</strong> the working population in these sectors are<br />
combined by the CSO<br />
26