Summary of Workplace Injury, Illness and Fatality Statistics 2007-2008
Summary of Workplace Injury, Illness and Fatality Statistics 2007-2008
Summary of Workplace Injury, Illness and Fatality Statistics 2007-2008

You also want an ePaper? Increase the reach of your titles
YUMPU automatically turns print PDFs into web optimized ePapers that Google loves.
HSA <strong>Summary</strong> <strong>of</strong> <strong>Injury</strong>, <strong>Illness</strong> <strong>and</strong> <strong>Fatality</strong> <strong>Statistics</strong> <strong>2007</strong> - <strong>2008</strong><br />
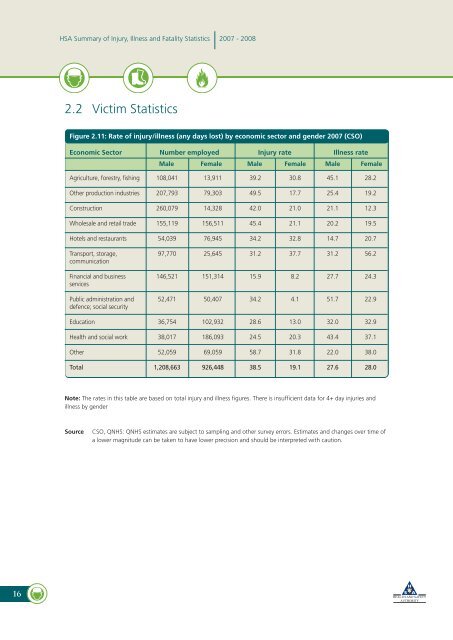
2.2 Victim <strong>Statistics</strong><br />
Figure 2.11: Rate <strong>of</strong> injury/illness (any days lost) by economic sector <strong>and</strong> gender <strong>2007</strong> (CSO)<br />
Economic Sector Number employed <strong>Injury</strong> rate <strong>Illness</strong> rate<br />
Male Female Male Female Male Female<br />
Agriculture, forestry, fishing 108,041 13,911 39.2 30.8 45.1 28.2<br />
Other production industries 207,793 79,303 49.5 17.7 25.4 19.2<br />
Construction 260,079 14,328 42.0 21.0 21.1 12.3<br />
Wholesale <strong>and</strong> retail trade 155,119 156,511 45.4 21.1 20.2 19.5<br />
Hotels <strong>and</strong> restaurants 54,039 76,945 34.2 32.8 14.7 20.7<br />
Transport, storage, 97,770 25,645 31.2 37.7 31.2 56.2<br />
communication<br />
Financial <strong>and</strong> business 146,521 151,314 15.9 8.2 27.7 24.3<br />
services<br />
Public administration <strong>and</strong> 52,471 50,407 34.2 4.1 51.7 22.9<br />
defence; social security<br />
Education 36,754 102,932 28.6 13.0 32.0 32.9<br />
Health <strong>and</strong> social work 38,017 186,093 24.5 20.3 43.4 37.1<br />
Other 52,059 69,059 58.7 31.8 22.0 38.0<br />
Total 1,208,663 926,448 38.5 19.1 27.6 28.0<br />
Note: The rates in this table are based on total injury <strong>and</strong> illness figures. There is insufficient data for 4+ day injuries <strong>and</strong><br />
illness by gender<br />
Source<br />
CSO, QNHS: QNHS estimates are subject to sampling <strong>and</strong> other survey errors. Estimates <strong>and</strong> changes over time <strong>of</strong><br />
a lower magnitude can be taken to have lower precision <strong>and</strong> should be interpreted with caution.<br />
16