- Page 1 and 2:
Please note that this PDF is subjec
- Page 3 and 4:
WORLD ENERGY 2 0 11 OUTLOOK
- Page 5 and 6:
FOREWORD It is the job of governmen
- Page 7 and 8:
ACKNOWLEDGEMENTS © OECD/IEA, 2011
- Page 9 and 10:
© OECD/IEA, 2011 Alexey Biteryakov
- Page 11 and 12:
© OECD/IEA, 2011 James Jensen Jan-
- Page 13 and 14:
© OECD/IEA, 2011 Jeff Piper Oleg P
- Page 15 and 16:
Liu Xiaoli Vitaly Yermakov Shigehir
- Page 17 and 18:
CONTEXT AND ANALYTICAL FRAMEWORK 1
- Page 19 and 20:
Trade 136 Trends in oil and gas pro
- Page 21 and 22:
9 Implications of Russia’s energy
- Page 23 and 24:
Electricity access - financing on-g
- Page 25 and 26:
3.5 Average annual change in transp
- Page 27 and 28:
5.19 Renewables grid integration co
- Page 29 and 30:
8.13 Changes in Russian natural gas
- Page 31 and 32:
11.14 Cumulative coal-supply invest
- Page 33 and 34:
List of tables Part A: GLOBAL ENERG
- Page 35 and 36:
10.5 CO 2 emissions from coal combu
- Page 37 and 38:
8.5 The “Northern Route” to mar
- Page 39 and 40:
Comments and questions are welcome
- Page 41 and 42:
EXECUTIVE SUMMARY “If we don’t
- Page 43 and 44:
Rising transport demand and upstrea
- Page 45 and 46:
Treading water or full steam ahead
- Page 47 and 48:
Achieving energy for all will not c
- Page 49 and 50:
PART A GLOBAL ENERGY TRENDS PREFACE
- Page 51 and 52:
CHAPTER 1 CONTEXT AND ANALYTICAL FR
- Page 53 and 54:
East and North Africa, a region tha
- Page 55 and 56:
© OECD/IEA, 2011 Chapter 1 - Conte
- Page 57 and 58:
The New Policies Scenario should no
- Page 59 and 60:
on welfare programmes. While this i
- Page 61 and 62:
6.8 billion in 2009 to around 8.6 b
- Page 63 and 64:
Energy prices The evolution of ener
- Page 65 and 66:
Natural gas prices Historically, na
- Page 67 and 68:
Figure 1.2 Ratio of average natura
- Page 69 and 70:
© OECD/IEA, 2011 In the 450 Scenar
- Page 71 and 72:
CHAPTER 2 ENERGY PROJECTIONS TO 203
- Page 73 and 74:
In the 450 Scenario, global energy
- Page 75 and 76:
Figure 2.4 World energy-related CO
- Page 77 and 78:
Box 2.1 The impact of lower near-t
- Page 79 and 80:
SPOTLIGHT © OECD/IEA, 2011 What ar
- Page 81 and 82:
Figure 2.7 Shares of energy source
- Page 83 and 84:
of the total in 2035, the absolute
- Page 85 and 86:
© OECD/IEA, 2011 In Latin America,
- Page 87 and 88:
adoption of hybrids (32% of passeng
- Page 89 and 90:
Figure 2.12 Incremental energy dem
- Page 91 and 92:
Figure 2.14 Incremental world ener
- Page 93 and 94:
production continue to clarify the
- Page 95 and 96:
stabilising thereafter, to settle a
- Page 97 and 98:
The answer will depend on China’s
- Page 99 and 100:
investment needs are not as high, b
- Page 101 and 102:
Energy-related emissions Greenhouse
- Page 103 and 104:
© OECD/IEA, 2011 Chapter 2 - Energ
- Page 105 and 106:
CHAPTER 3 OIL MARKET OUTLOOK Will i
- Page 107 and 108:
the assumed higher GDP growth, howe
- Page 109 and 110:
Policies Scenario, OECD primary dem
- Page 111 and 112:
Chapter 13 for a discussion of ener
- Page 113 and 114:
if large-scale projects were succes
- Page 115 and 116:
Passenger light-duty vehicles Passe
- Page 117 and 118:
countries own a car today, while av
- Page 119 and 120:
Box 3.1 The future of car making T
- Page 121 and 122:
wait-and-see strategy in a still na
- Page 123 and 124:
eserves additions amounted to 29 bi
- Page 125 and 126:
Figure 3.15 World oil production i
- Page 127 and 128:
© OECD/IEA, 2011 By country, Iraq
- Page 129 and 130:
in production from older fields. Ru
- Page 131 and 132:
States (US DOE/EIA, 2011a). Of cour
- Page 133 and 134:
Europe’s production decline is we
- Page 135 and 136:
have acknowledged that the target l
- Page 137 and 138:
© OECD/IEA, 2011 this potential wi
- Page 139 and 140:
© OECD/IEA, 2011 Chapter 3 - Oil m
- Page 141 and 142:
and most of the easily accessible o
- Page 143 and 144:
egions where international oil comp
- Page 145 and 146:
Trends in upstream spending differ
- Page 147 and 148:
Impact of deferred upstream investm
- Page 149 and 150:
good by other regions. Higher oil a
- Page 151 and 152:
atios of gas and coal prices to oil
- Page 153 and 154:
Oil demand falls much less in volum
- Page 155 and 156:
than offset by higher oil prices (a
- Page 157 and 158:
CHAPTER 4 NATURAL GAS MARKET OUTLOO
- Page 159 and 160:
decreases through the projection pe
- Page 161 and 162:
Middle East (included in “other e
- Page 163 and 164:
Figure 4.4 Primary natural gas dem
- Page 165 and 166:
Table 4.3 Primary natural gas prod
- Page 167 and 168:
Table 4.4 Primary natural gas prod
- Page 169 and 170:
production growth in Iran is likely
- Page 171 and 172:
projections of the New Policies Sce
- Page 173 and 174:
of additional unconventional gas su
- Page 175 and 176:
SPOTLIGHT Do all roads lead to a Go
- Page 177 and 178:
CHAPTER 5 POWER AND RENEWABLES OUTL
- Page 179 and 180:
Around 80% of the growth in electri
- Page 181 and 182:
Figure 5.2 Share of world electric
- Page 183 and 184:
Figure 5.4 Incremental global coal
- Page 185 and 186:
driving the growth in this technolo
- Page 187 and 188:
wind power producer. Generation fro
- Page 189 and 190:
In OECD countries, the reduction in
- Page 191 and 192:
© OECD/IEA, 2011 Chapter 5 - Power
- Page 193 and 194:
Box 5.1 Costs of integrating varia
- Page 195 and 196:
of renewables can also improve capa
- Page 197 and 198:
Focus on T&D infrastructure Robust
- Page 199 and 200:
years and this is set to continue.
- Page 201 and 202:
© OECD/IEA, 2011 Chapter 5 - Power
- Page 203 and 204:
total system integration costs (see
- Page 205 and 206:
systems, smart grids can also incre
- Page 207 and 208:
CHAPTER 6 CLIMATE CHANGE AND THE 45
- Page 209 and 210:
Box 6.1 What is special about 2°C
- Page 211 and 212:
© OECD/IEA, 2011 was driven by eco
- Page 213 and 214:
Table 6.1 World anthropogenic gree
- Page 215 and 216:
over 6 000 terawatt hours (TWh) in
- Page 217 and 218:
Efficiency policies are by far the
- Page 219 and 220:
Union in the 450 Scenario). China a
- Page 221 and 222:
SPOTLIGHT The International Year of
- Page 223 and 224:
The power generation sector plays a
- Page 225 and 226:
© OECD/IEA, 2011 Chapter 6 - Clima
- Page 227 and 228:
the total). 7 Refurbishment of buil
- Page 229 and 230:
which by 2035 are $42/tonne, or 38%
- Page 231 and 232:
Implications of delayed action This
- Page 233 and 234:
cumulative budgeted emissions of th
- Page 235 and 236:
of its technical lifetime before 20
- Page 237 and 238:
the case for transport, however, th
- Page 239 and 240:
Figure 6.17 Potential CO 2 emissio
- Page 241 and 242:
example, it would require an averag
- Page 243 and 244:
Figure 6.19 Change in global energ
- Page 245 and 246:
PART B OUTLOOK FOR RUSSIAN ENERGY P
- Page 247 and 248:
CHAPTER 7 RUSSIAN DOMESTIC ENERGY P
- Page 249 and 250:
(Urengoy and Yamburg) that have mad
- Page 251 and 252:
Figure 7.2 Energy production in Ru
- Page 253 and 254:
Trends in policies and governance T
- Page 255 and 256:
and those in Russian strategy docum
- Page 257 and 258:
Another target adopted by the Russi
- Page 259 and 260:
Figure 7.4 Total energy costs as a
- Page 261 and 262:
accounts for a significant share (F
- Page 263 and 264:
stricter building codes, are consid
- Page 265 and 266:
Figure 7.9 Primary energy savings
- Page 267 and 268:
this decline is projected to contin
- Page 269 and 270:
The current contribution of non-fos
- Page 271 and 272:
energy economy and the government c
- Page 273 and 274:
Figure 7.15 Age profile of install
- Page 275 and 276:
Reform efforts directed at the elec
- Page 277 and 278:
difficult to assess with any accura
- Page 279 and 280:
energy demand in the transport sect
- Page 281 and 282:
at around 20 kilogrammes of oil equ
- Page 283 and 284:
In the New Policies Scenario, polic
- Page 285 and 286:
CHAPTER 8 RUSSIAN RESOURCES AND SUP
- Page 287 and 288:
Figure 8.2 Russian oil balance in
- Page 289 and 290:
Russian industrial groups (and ther
- Page 291 and 292:
subsequent updates, 6 IEA analysis
- Page 293 and 294:
Our USGS-based estimates have been
- Page 295 and 296:
9.6 mb/d throughout the period to 2
- Page 297 and 298:
incentives for companies to invest
- Page 299 and 300:
© OECD/IEA, 2011 Chapter 8 - Russi
- Page 301 and 302:
Production in Eastern Siberia is pr
- Page 303 and 304:
Estimating decline rates at existin
- Page 305 and 306:
Natural gas Resources Proven reserv
- Page 307 and 308:
ecoverable resources suggest, Russi
- Page 309 and 310:
SPOTLIGHT © OECD/IEA, 2011 The las
- Page 311 and 312:
Figure 8.13 Changes in Russian nat
- Page 313 and 314:
Flaring The rate of utilisation of
- Page 315 and 316:
© OECD/IEA, 2011 Chapter 8 - Russi
- Page 317 and 318:
Box 8.5 The “Northern Route” t
- Page 319 and 320:
information about project developme
- Page 321 and 322:
the Kansko-Achinsk basin and Easter
- Page 323 and 324:
not been affected by any change of
- Page 325 and 326:
Russia has significant uranium reso
- Page 327 and 328:
obstacle, as discussed for the coal
- Page 329 and 330:
The adoption of renewable technolog
- Page 331 and 332:
CHAPTER 9 IMPLICATIONS OF RUSSIA’
- Page 333 and 334:
Figure 9.1 Structure of Russian ex
- Page 335 and 336:
Taken together, our assumption for
- Page 337 and 338:
in infrastructure for liquefied nat
- Page 339 and 340:
in the Middle East (see Chapter 3).
- Page 341 and 342:
There is similar evidence in the oi
- Page 343 and 344:
with the overall aim to decrease th
- Page 345 and 346:
Table 9.1 Main gas trade flows fro
- Page 347 and 348:
At the same time, the position of R
- Page 349 and 350:
Policies Scenario, so that they are
- Page 351 and 352:
Comparing this Outlook with Russian
- Page 353 and 354:
PART C OUTLOOK FOR COAL MARKETS PRE
- Page 355 and 356:
CHAPTER 10 COAL DEMAND PROSPECTS Tr
- Page 357 and 358:
Box 10.1 A decade of booming coal
- Page 359 and 360:
the imposition of a carbon price an
- Page 361 and 362:
Table 10.3 Summary of the main dri
- Page 363 and 364:
Figure 10.5 World crude steel prod
- Page 365 and 366:
under $200/tonne in nominal terms b
- Page 367 and 368:
Box 10.3 Coal-fired power generati
- Page 369 and 370:
The projections described above, an
- Page 371 and 372:
Table 10.4 Levelised electricity g
- Page 373 and 374:
Fuel choice in industry Coal has di
- Page 375 and 376:
ange of capital costs only for capa
- Page 377 and 378:
In the 450 Scenario, OECD coal dema
- Page 379 and 380:
© OECD/IEA, 2011 PCC plants, they
- Page 381 and 382:
Figure 10.16 Coal-fired generating
- Page 383 and 384:
coal demand rebounds in the short t
- Page 385 and 386:
energy intensity and carbon intensi
- Page 387 and 388:
Figure 10.20 New additions of powe
- Page 389 and 390:
© OECD/IEA, 2011 around 85% of the
- Page 391 and 392:
Figure 10.24 Coal-fired generating
- Page 393 and 394:
In the New Policies Scenario, coal
- Page 395 and 396:
over the projection period, as the
- Page 397 and 398:
urning for power generation. Load f
- Page 399 and 400:
CHAPTER 11 COAL SUPPLY AND INVESTME
- Page 401 and 402:
Table 11.1 Coal* production by typ
- Page 403 and 404:
in 2009 (Figure 11.2). Marginal cha
- Page 405 and 406:
Just under three-quarters, or nearl
- Page 407 and 408:
generally risen much less than inte
- Page 409 and 410:
and the United States have moved up
- Page 411 and 412:
Underground mining methods (longwal
- Page 413 and 414:
near the coast. Furthermore, bottle
- Page 415 and 416:
capacity in the next two to four ye
- Page 417 and 418:
exemptions and credits, grants for
- Page 419 and 420:
coal derivatives, which together al
- Page 421 and 422:
Table 11.6 Key figures for the 30
- Page 423 and 424:
Trade prospects In the New Policies
- Page 425 and 426:
Colombia, along with new entrants s
- Page 427 and 428:
freight, to connect the coal-fields
- Page 429 and 430:
monopoly, which is able to extract
- Page 431 and 432:
the west of China, together with in
- Page 433 and 434:
the past few years, especially of c
- Page 435 and 436:
Indonesian and South African steam
- Page 437 and 438:
coal sold at the mine-mouth. The co
- Page 439 and 440:
© OECD/IEA, 2011 rates, total coal
- Page 441 and 442:
their markets. Additionally, over t
- Page 443 and 444:
Figure 11.25 Coal production in So
- Page 445 and 446:
© OECD/IEA, 2011 Figure 11.26 Har
- Page 447 and 448:
PART D SPECIAL TOPICS PREFACE Part
- Page 449 and 450:
CHAPTER 12 THE IMPLICATIONS OF LESS
- Page 451 and 452:
On the basis of a necessarily arbit
- Page 453 and 454:
of the construction starts in 2010,
- Page 455 and 456:
© OECD/IEA, 2011 SPOTLIGHT How did
- Page 457 and 458:
© OECD/IEA, 2011 the country’s 5
- Page 459 and 460:
Our projections of future nuclear p
- Page 461 and 462:
projected in the New Policies Scena
- Page 463 and 464:
Figure 12.4 Power generation by fu
- Page 465 and 466:
period 2011 to 2035 are higher by 1
- Page 467 and 468:
In short, to the extent that energy
- Page 469 and 470:
other generating options because of
- Page 471 and 472:
CHAPTER 13 ENERGY FOR ALL Financing
- Page 473 and 474:
© OECD/IEA, 2011 International con
- Page 475 and 476:
Table 13.1 People without access t
- Page 477 and 478:
Box 13.2 Measuring investment in m
- Page 479 and 480:
In the New Policies Scenario, aroun
- Page 481 and 482:
© OECD/IEA, 2011 Chapter 13 - Ener
- Page 483 and 484:
significant progress in establishin
- Page 485 and 486:
most suitable option for all urban
- Page 487 and 488:
In the Energy for All Case, hydropo
- Page 489 and 490:
additional investment of $20 billio
- Page 491 and 492:
As well as the economic development
- Page 493 and 494:
to pay. In these areas, the share o
- Page 495 and 496:
Electricity access - financing mini
- Page 497 and 498:
y entrepreneurs providing solar por
- Page 499 and 500:
The government, through a national
- Page 501 and 502:
Multilateral and bilateral developm
- Page 503 and 504:
generation at an investment cost of
- Page 505 and 506:
including to end-users, to generate
- Page 507 and 508:
to be sufficiently expert regarding
- Page 509 and 510:
CHAPTER 14 DEVELOPMENTS IN ENERGY S
- Page 511 and 512:
G-20 and APEC leaders in 2009 and 2
- Page 513 and 514:
availability and foreign currency e
- Page 515 and 516:
subsidies, which may subsidise part
- Page 517 and 518:
Figure 14.3 Economic cost of fossi
- Page 519 and 520:
© OECD/IEA, 2011 Chapter 14 - Deve
- Page 521 and 522:
In practice, the poor capture only
- Page 523 and 524:
that would follow from subsidy remo
- Page 525 and 526:
SPOTLIGHT Are the G-20 and APEC com
- Page 527 and 528:
lessens the burden of the rising co
- Page 529 and 530:
© OECD/IEA, 2011 While the return
- Page 531 and 532:
Measuring renewable-energy subsidie
- Page 533 and 534:
grow considerably in non-OECD count
- Page 535 and 536:
exploited earlier, but there are ex
- Page 537 and 538:
© OECD/IEA, 2011 in the United Sta
- Page 539 and 540:
As depicted in the 450 Scenario, mo
- Page 541 and 542:
lowest in Japan, due partly to elec
- Page 543 and 544:
© OECD/IEA, 2011 ANNEXES
- Page 545 and 546:
ANNEX A TABLES FOR SCENARIO PROJECT
- Page 547 and 548:
© OECD/IEA, 2011 World: Current Po
- Page 549 and 550:
World: Current Policies and 450 Sce
- Page 551 and 552:
© OECD/IEA, 2011 OECD: Current Pol
- Page 553 and 554:
OECD: Current Policies and 450 Scen
- Page 555 and 556:
© OECD/IEA, 2011 OECD Americas: Cu
- Page 557 and 558:
OECD Americas: Current Policies and
- Page 559 and 560:
© OECD/IEA, 2011 United States: Cu
- Page 561 and 562:
United States: Current Policies and
- Page 563 and 564: © OECD/IEA, 2011 OECD Europe: Curr
- Page 565 and 566: OECD Europe: Current Policies and 4
- Page 567 and 568: © OECD/IEA, 2011 European Union: C
- Page 569 and 570: European Union: Current Policies an
- Page 571 and 572: © OECD/IEA, 2011 OECD Asia Oceania
- Page 573 and 574: OECD Asia Oceania: Current Policies
- Page 575 and 576: © OECD/IEA, 2011 Japan: Current Po
- Page 577 and 578: Japan: Current Policies and 450 Sce
- Page 579 and 580: © OECD/IEA, 2011 Non-OECD: Current
- Page 581 and 582: Non-OECD: Current Policies and 450
- Page 583 and 584: © OECD/IEA, 2011 E. Europe/Eurasia
- Page 585 and 586: E. Europe/Eurasia: Current Policies
- Page 587 and 588: © OECD/IEA, 2011 Russia: Current P
- Page 589 and 590: Russia: Current Policies and 450 Sc
- Page 591 and 592: © OECD/IEA, 2011 Non-OECD Asia: Cu
- Page 593 and 594: Non-OECD Asia: Current Policies and
- Page 595 and 596: © OECD/IEA, 2011 China: Current Po
- Page 597 and 598: China: Current Policies and 450 Sce
- Page 599 and 600: © OECD/IEA, 2011 India: Current Po
- Page 601 and 602: India: Current Policies and 450 Sce
- Page 603 and 604: © OECD/IEA, 2011 Middle East: Curr
- Page 605 and 606: Middle East: Current Policies and 4
- Page 607 and 608: © OECD/IEA, 2011 Africa: Current P
- Page 609 and 610: Africa: Current Policies and 450 Sc
- Page 611 and 612: © OECD/IEA, 2011 Latin America: Cu
- Page 613: Latin America: Current Policies and
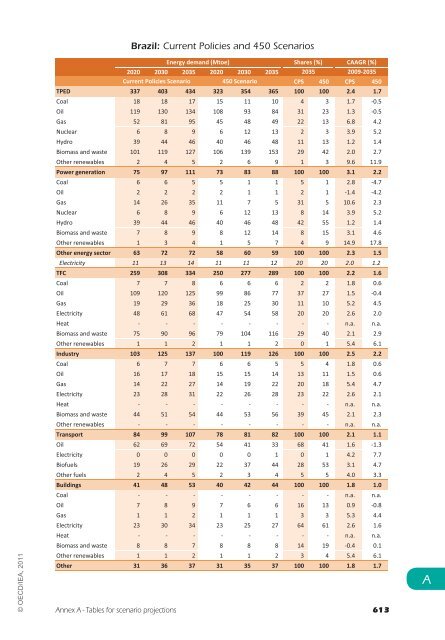
- Page 617 and 618: Brazil: Current Policies and 450 Sc
- Page 619 and 620: ANNEX B POLICIES AND MEASURES BY SC
- Page 621 and 622: The specific policies adopted for d
- Page 623 and 624: © OECD/IEA, 2011 Annex B - Policie
- Page 625 and 626: © OECD/IEA, 2011 Annex B - Policie
- Page 627 and 628: © OECD/IEA, 2011 Annex B - Policie
- Page 629 and 630: © OECD/IEA, 2011 Annex B - Policie
- Page 631 and 632: ANNEX C UNITS, DEFINITIONS, REGIONA
- Page 633 and 634: © OECD/IEA, 2011 Definitions Advan
- Page 635 and 636: Coking coal Coking coal is a type o
- Page 637 and 638: departure and port of arrival, and
- Page 639 and 640: manufacturing and mining), transpor
- Page 641 and 642: Latin America Argentina, Bolivia, B
- Page 643 and 644: © OECD/IEA, 2011 CNG compressed na
- Page 645 and 646: PSA PV RD&D RDD&D SAGD SCO SO 2 SRM
- Page 647 and 648: ANNEX D REFERENCES PART A: Global e
- Page 649 and 650: © OECD/IEA, 2011 O&GJ (Oil and Gas
- Page 651 and 652: © OECD/IEA, 2011 — (2011a), East
- Page 653 and 654: RosHydroMet (2011), Report on Clima
- Page 655 and 656: © OECD/IEA, 2011 Popel, O., et al.
- Page 657 and 658: © OECD/IEA, 2011 Morse, R. and G.
- Page 659 and 660: © OECD/IEA, 2011 GPOBA (Global Par
- Page 661 and 662: IEA, OECD (Organisaon for Economic
- Page 663 and 664: © OECD/IEA, 2011
- Page 665 and 666:
© OECD/IEA, 2011