Issue 16
Issue 16
Issue 16

You also want an ePaper? Increase the reach of your titles
YUMPU automatically turns print PDFs into web optimized ePapers that Google loves.
ERENET Profile Vol. IV, No. 4.<br />
www.erenet.org<br />
• number of employees is 50-250 workers<br />
• join stock company, limited company<br />
• building industry, manufacturing industry<br />
The results presented in this research are the result of the primary analysis. After the primary analysis<br />
were found scores of differences between family and non-family business. The results of this primary analysis<br />
are compared with the results of the research made in the family business in Europe and USA. For the<br />
primary analysis was used the SPSS program and the main differences were identified by the cross tables.<br />
Results<br />
The results are divided into the categories internal factors of competitiveness, external factor of<br />
competitiveness, and relationship with stakeholders.<br />
Internal factor of competitiveness<br />
The main differences between family and non-family business within the Czech Republic were found in these<br />
categories: financial efficiency, the innovation of production, consumers care, and level of qualification of<br />
employees. Similar results can be found in the research made in the Europe and also in the USA. 15 Family<br />
business is focus especially on the product range and product design. Family business is also more then nonfamily<br />
business focused on the consumers care. Interesting result is also the lower qualification level of<br />
employees within family business. This can be caused by the high social responsibilities which are in the family<br />
business, what was proved by the American business survey in 2007.<br />
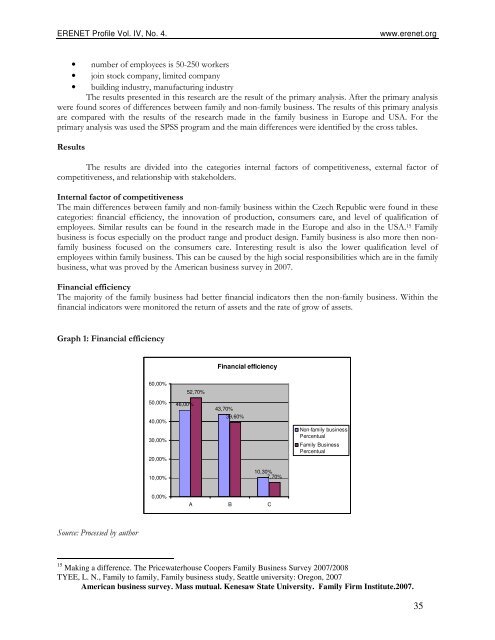
Financial efficiency<br />
The majority of the family business had better financial indicators then the non-family business. Within the<br />
financial indicators were monitored the return of assets and the rate of grow of assets.<br />
Graph 1: Financial efficiency<br />
Financial efficiency<br />
60,00%<br />
52,70%<br />
50,00%<br />
40,00%<br />
30,00%<br />
20,00%<br />
46,00%<br />
43,70%<br />
39,60%<br />
Non-family business<br />
Percentual<br />
Family Business<br />
Percentual<br />
10,00%<br />
10,30%<br />
7,70%<br />
0,00%<br />
A B C<br />
Source: Processed by author<br />
15 Making a difference. The Pricewaterhouse Coopers Family Business Survey 2007/2008<br />
TYEE, L. N., Family to family, Family business study, Seattle university: Oregon, 2007<br />
American business survey. Mass mutual. Kenesaw State University. Family Firm Institute.2007.<br />
35