Volume 2 - IFC
Volume 2 - IFC
Volume 2 - IFC

Create successful ePaper yourself
Turn your PDF publications into a flip-book with our unique Google optimized e-Paper software.
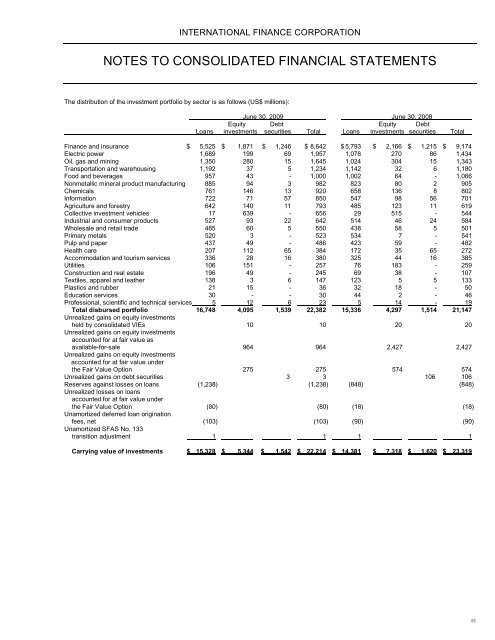
INTERNATIONAL FINANCE CORPORATION<br />
NOTES TO CONSOLIDATED FINANCIAL STATEMENTS<br />
The distribution of the investment portfolio by sector is as follows (US$ millions):<br />
June 30, 2009 June 30, 2008<br />
Equity Debt Equity Debt<br />
Loans investments securities Total Loans investments securities Total<br />
Finance and insurance $ 5,525 $ 1,871 $ 1,246 $ 8,642 $ 5,793 $ 2,166 $ 1,215 $ 9,174<br />
Electric power 1,689 199 69 1,957 1,078 270 86 1,434<br />
Oil, gas and mining 1,350 280 15 1,645 1,024 304 15 1,343<br />
Transportation and warehousing 1,192 37 5 1,234 1,142 32 6 1,180<br />
Food and beverages 957 43 - 1,000 1,002 64 - 1,066<br />
Nonmetallic mineral product manufacturing 885 94 3 982 823 80 2 905<br />
Chemicals 761 146 13 920 658 136 8 802<br />
Information 722 71 57 850 547 98 56 701<br />
Agriculture and forestry 642 140 11 793 485 123 11 619<br />
Collective investment vehicles 17 639 - 656 29 515 - 544<br />
Industrial and consumer products 527 93 22 642 514 46 24 584<br />
Wholesale and retail trade 485 60 5 550 438 58 5 501<br />
Primary metals 520 3 - 523 534 7 - 541<br />
Pulp and paper 437 49 - 486 423 59 - 482<br />
Health care 207 112 65 384 172 35 65 272<br />
Accommodation and tourism services 336 28 16 380 325 44 16 385<br />
Utilities 106 151 - 257 76 183 - 259<br />
Construction and real estate 196 49 - 245 69 38 - 107<br />
Textiles, apparel and leather 138 3 6 147 123 5 5 133<br />
Plastics and rubber 21 15 - 36 32 18 - 50<br />
Education services 30 - - 30 44 2 - 46<br />
Professional, scientific and technical services 5 12 6 23 5 14 - 19<br />
Total disbursed portfolio 16,748 4,095 1,539 22,382 15,336 4,297 1,514 21,147<br />
Unrealized gains on equity investments<br />
held by consolidated VIEs 10 10 20 20<br />
Unrealized gains on equity investments<br />
accounted for at fair value as<br />
available-for-sale 964 964 2,427 2,427<br />
Unrealized gains on equity investments<br />
accounted for at fair value under<br />
the Fair Value Option 275 275 574 574<br />
Unrealized gains on debt securities 3 3 106 106<br />
Reserves against losses on loans (1,238) (1,238) (848) (848)<br />
Unrealized losses on loans<br />
accounted for at fair value under<br />
the Fair Value Option (80) (80) (18) (18)<br />
Unamortized deferred loan origination<br />
fees, net (103) (103) (90) (90)<br />
Unamortized SFAS No. 133<br />
transition adjustment 1 1 1 1<br />
Carrying value of investments $ 15,328 $ 5,344 $ 1,542 $ 22,214 $ 14,381 $ 7,318 $ 1,620 $ 23,319<br />
49