Volume 2 - IFC
Volume 2 - IFC
Volume 2 - IFC

You also want an ePaper? Increase the reach of your titles
YUMPU automatically turns print PDFs into web optimized ePapers that Google loves.
INTERNATIONAL FINANCE CORPORATION<br />
NOTES TO CONSOLIDATED FINANCIAL STATEMENTS<br />
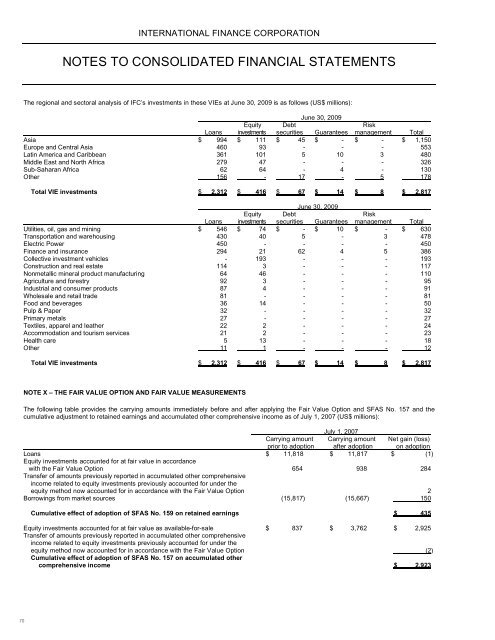
The regional and sectoral analysis of <strong>IFC</strong>’s investments in these VIEs at June 30, 2009 is as follows (US$ millions):<br />
June 30, 2009<br />
Equity Debt Risk<br />
Loans investments securities Guarantees management Total<br />
Asia $ 994 $ 111 $ 45 $ - $ - $ 1,150<br />
Europe and Central Asia 460 93 - - - 553<br />
Latin America and Caribbean 361 101 5 10 3 480<br />
Middle East and North Africa 279 47 - - - 326<br />
Sub-Saharan Africa 62 64 - 4 - 130<br />
Other 156 - 17 - 5 178<br />
Total VIE investments $ 2,312 $ 416 $ 67 $ 14 $ 8 $ 2,817<br />
June 30, 2009<br />
Equity Debt Risk<br />
Loans investments securities Guarantees management Total<br />
Utilities, oil, gas and mining $ 546 $ 74 $ - $ 10 $ - $ 630<br />
Transportation and warehousing 430 40 5 - 3 478<br />
Electric Power 450 - - - - 450<br />
Finance and insurance 294 21 62 4 5 386<br />
Collective investment vehicles - 193 - - - 193<br />
Construction and real estate 114 3 - - - 117<br />
Nonmetallic mineral product manufacturing 64 46 - - - 110<br />
Agriculture and forestry 92 3 - - - 95<br />
Industrial and consumer products 87 4 - - - 91<br />
Wholesale and retail trade 81 - - - - 81<br />
Food and beverages 36 14 - - - 50<br />
Pulp & Paper 32 - - - - 32<br />
Primary metals 27 - - - - 27<br />
Textiles, apparel and leather 22 2 - - - 24<br />
Accommodation and tourism services 21 2 - - - 23<br />
Health care 5 13 - - - 18<br />
Other 11 1 - - - 12<br />
Total VIE investments $ 2,312 $ 416 $ 67 $ 14 $ 8 $ 2,817<br />
NOTE X – THE FAIR VALUE OPTION AND FAIR VALUE MEASUREMENTS<br />
The following table provides the carrying amounts immediately before and after applying the Fair Value Option and SFAS No. 157 and the<br />
cumulative adjustment to retained earnings and accumulated other comprehensive income as of July 1, 2007 (US$ millions):<br />
July 1, 2007<br />
Carrying amount Carrying amount Net gain (loss)<br />
prior to adoption after adoption on adoption<br />
Loans $ 11,818 $ 11,817 $ (1)<br />
Equity investments accounted for at fair value in accordance<br />
with the Fair Value Option 654 938 284<br />
Transfer of amounts previously reported in accumulated other comprehensive<br />
income related to equity investments previously accounted for under the<br />
equity method now accounted for in accordance with the Fair Value Option 2<br />
Borrowings from market sources (15,817) (15,667) 150<br />
Cumulative effect of adoption of SFAS No. 159 on retained earnings $ 435<br />
Equity investments accounted for at fair value as available-for-sale $ 837 $ 3,762 $ 2,925<br />
Transfer of amounts previously reported in accumulated other comprehensive<br />
income related to equity investments previously accounted for under the<br />
equity method now accounted for in accordance with the Fair Value Option (2)<br />
Cumulative effect of adoption of SFAS No. 157 on accumulated other<br />
comprehensive income $ 2,923<br />
70