A quantitative approach to carbon price risk modeling - CiteSeerX
A quantitative approach to carbon price risk modeling - CiteSeerX
A quantitative approach to carbon price risk modeling - CiteSeerX

You also want an ePaper? Increase the reach of your titles
YUMPU automatically turns print PDFs into web optimized ePapers that Google loves.
A <strong>quantitative</strong> <strong>approach</strong> <strong>to</strong> <strong>carbon</strong> <strong>price</strong> <strong>risk</strong><br />
<strong>modeling</strong><br />
Max Fehr<br />
Institute for Operations Research<br />
ETH Zentrum<br />
CH-8092 Zurich, Switzerland<br />
e-mail fehr@ifor.math.ethz.ch<br />
Juri Hinz<br />
Institute for Operations Research and RiskLab<br />
ETH Zentrum<br />
CH-8092 Zurich, Switzerland<br />
e-mail hinz@ifor.math.ethz.ch<br />
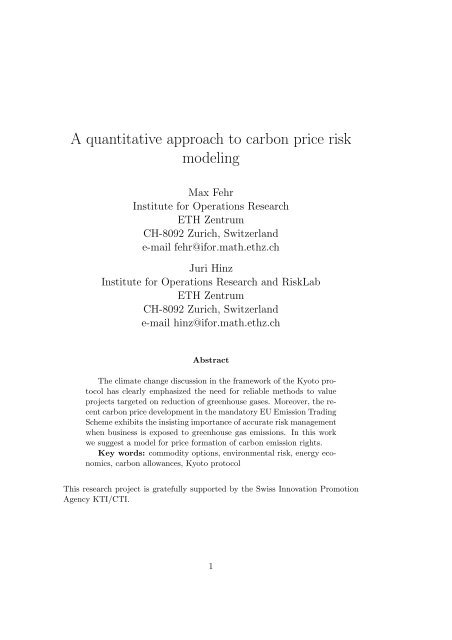
Abstract<br />
The climate change discussion in the framework of the Kyo<strong>to</strong> pro<strong>to</strong>col<br />
has clearly emphasized the need for reliable methods <strong>to</strong> value<br />
projects targeted on reduction of greenhouse gases. Moreover, the recent<br />
<strong>carbon</strong> <strong>price</strong> development in the manda<strong>to</strong>ry EU Emission Trading<br />
Scheme exhibits the insisting importance of accurate <strong>risk</strong> management<br />
when business is exposed <strong>to</strong> greenhouse gas emissions. In this work<br />
we suggest a model for <strong>price</strong> formation of <strong>carbon</strong> emission rights.<br />
Key words: commodity options, environmental <strong>risk</strong>, energy economics,<br />
<strong>carbon</strong> allowances, Kyo<strong>to</strong> pro<strong>to</strong>col<br />
This research project is gratefully supported by the Swiss Innovation Promotion<br />
Agency KTI/CTI.<br />
1
1 Introduction<br />
The world’s changing climate and actions designed <strong>to</strong> curtail the man-made effects<br />
on ecosystems continue <strong>to</strong> challenge policy makers. Here, one of the urgent<br />
themes is <strong>to</strong> establish regulations which provide a certain amount of flexibility,<br />
enabling agents <strong>to</strong> apply commitments for GHG reduction best suited <strong>to</strong> their<br />
circumstances.<br />
The idea <strong>to</strong> use market-based asset trading systems in order <strong>to</strong> achieve environmental<br />
targets goes back <strong>to</strong> [4] and [10]. The authors of these contributions envisaged<br />
a market for the public good environment introduced by tradable emission credits.<br />
Using a static model for a perfect market with pollution certificates in [10], it is<br />
shown that there exists a minimum cost equilibrium for companies facing a given<br />
environmental target. The conceptual basis for dynamic permit trading is, among<br />
others, addressed in [3], [16], [13], [8], [14] and [15]. This line of work is related <strong>to</strong><br />
our <strong>approach</strong> since it treats the aspects of banking, borrowing, and the problems<br />
of inter-temporal strategy optimization in a multi-period setting. The recent work<br />
[15] suggests also a continuous-time model for <strong>carbon</strong> <strong>price</strong> formation. Beyond<br />
these themes, there exists a vast work on several related <strong>to</strong>pics, for instance on<br />
equilibrium [2], empirical evidence from already existing markets [7], initial allocations,<br />
technology relations [1], uncertainty and <strong>risk</strong> [5], [9], [17] and game-theoretic<br />
questions addressed in [11], [6].<br />
Below, we give a short overview how different international, national and corporate<br />
policy frameworks are used <strong>to</strong> reduce GHG pollution in a flexible, cost effective<br />
manner by the introduction of marketable <strong>carbon</strong> emission credits. Thereby, we focus<br />
on the <strong>carbon</strong> emission market EU ETS designed by the European Community<br />
as an instrument <strong>to</strong> meet targets under the Kyo<strong>to</strong> pro<strong>to</strong>col.<br />
In 1997 governments adopted the Kyo<strong>to</strong> pro<strong>to</strong>col that broke new ground with its<br />
manda<strong>to</strong>ry constraints on reduction of GHG emissions. On the core of this agreement<br />
is a target <strong>to</strong> reduce GHG emissions for developed countries and economies<br />
in transition (the so-called Annex I members). These countries are set a legally<br />
binding cap for GHG emission <strong>to</strong> 5.2 % below their 1990 level. This reduction is<br />
<strong>to</strong> be attained in sum over all Annex I members in average over five years 2008<br />
– 2012. The concrete implementation is as follows: Each Annex I member is assigned<br />
a <strong>carbon</strong> dioxide credit which equals <strong>to</strong> (5 years) × (country’s emission<br />
in 1990) × (1-0.052). This credit is measured in the so-called Assigned Amount<br />
units (AAUs), corresponding <strong>to</strong> one <strong>to</strong>n of <strong>carbon</strong> dioxide.<br />
Moreover, the Kyo<strong>to</strong> pro<strong>to</strong>col contains three mechanisms: International Emission<br />
Trading (IET), Joint implementation (JI), and Clean Development Mechanism<br />
(CDM) that are designed <strong>to</strong> support Annex I members <strong>to</strong> meet their targets by<br />
purchasing emission credits from other parties, in particular<br />
2
• for the IET mechanism, these credits are AAUs from other Annex I members<br />
• for the JI mechanism, credits are the so-called ERUs (Emission Reduction<br />
Units) and RMUs (Specific Removable Units) which are obtained from<br />
projects within the Annex I area<br />
• for the CDM mechanism, that are the so-called CERs (Certified Emission<br />
Reductions), obtained from GHG reduction within non-Annex I countries.<br />
On this account, the need for trading of diverse emission allowances (AAU, ERU,<br />
RMU, CER) is obvious. Currently, futures and spot markets for these assets are<br />
being developed. Moreover, there is a number of regional and national emission<br />
reduction projects, where similarly <strong>to</strong> the above setting, agents trade diverse emission<br />
certificates.<br />
A remarkable example of such a project is the European initiative EU Emission<br />
Trading Scheme (EU ETS), launched by the Directive 2003/87/EC of the European<br />
Parliament and the Council of 13th of Oc<strong>to</strong>ber 2003. This scheme is intended<br />
<strong>to</strong> ensure reduction of GHG emissions from large industrial sources within the<br />
European Union as a contribution <strong>to</strong>wards EU’s targets under the Kyo<strong>to</strong> Pro<strong>to</strong>col.<br />
EU ETS imposes manda<strong>to</strong>ry participation of more than 12,000 installations.<br />
These are power plants and industrial users responsible for approximately 45 %<br />
of the entire EU <strong>carbon</strong> emission. Among these installations, <strong>carbon</strong> emission allowances<br />
(EUAs) are yearly allocated by the responsible governments, according<br />
<strong>to</strong> the corresponding National Allocation Plan (NAP). Installations have <strong>to</strong> cover<br />
their emissions by allowances year by year. To do so, they are able <strong>to</strong> procure<br />
credits CERs (from 2008 onwards also ERUs) and <strong>to</strong> trade in EUAs. The precise<br />
regulation is as follows: There are two periods 2005–2007 and 2008-20012. Within<br />
each period, allowances are valid for compliance against emissions regardless of<br />
the year they are allocated. At the end of each period, a penalty of is <strong>to</strong> be paid<br />
for each <strong>to</strong>n of emitted <strong>carbon</strong> dioxide which is not covered by allowances. The<br />
size of the potential payment is considerable: At the end of the first period, the<br />
penalty is amounted at 40 EURO plus one AAU from the second period, whereas<br />
at the end of the second period agents have <strong>to</strong> pay 100 EURO per <strong>to</strong>n of <strong>carbon</strong><br />
dioxide in the case of non-compliance.<br />
EU ETS has earned the reputation of a leader in fighting the climate change,<br />
especially as there is a global reach that facilitates sustainable development, in<br />
particular through the settlement of emission rights trading. Several exchanges<br />
in Europe are now committed <strong>to</strong> the trading of EUAs. The products listed there<br />
are spot and forward contracts with physical delivery. Exchange trading mitigates<br />
counterparty <strong>risk</strong> and is able <strong>to</strong> boost liquidity. The development of <strong>carbon</strong><br />
markets <strong>to</strong>wards increasing standardization raises also questions of pricing diverse<br />
financial contracts related <strong>to</strong> <strong>carbon</strong>. The present work is devoted <strong>to</strong> this problem.<br />
3
30<br />
25<br />
20<br />
Euro/ t CO2<br />
15<br />
10<br />
5<br />
01/05/05 01/07/05 01/09/05 01/11/05 01/01/06 01/03/06 01/05/06 01/07/06<br />
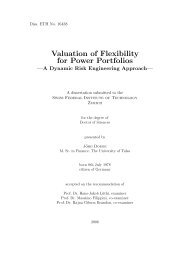
Figure 1: EUA spot <strong>price</strong>, listed at the European Energy Exchange EEX.<br />
The recent <strong>price</strong> drop occurred while <strong>carbon</strong> emission data became public<br />
showing that the overall market position is long<br />
Let us explain why we feel that the valuation of <strong>carbon</strong> derivatives is important,<br />
although not many options are issued yet. The point here is that any GHG project,<br />
by its nature, yields a payoff depending on (even expressed in) market <strong>price</strong>s of<br />
<strong>carbon</strong> allowances at future times when the project returns GHG reduction. Thus,<br />
we have <strong>to</strong> consider any purposed investment in CDM– or JI–undertaking as a<br />
long position in appropriate option written on upcoming spot <strong>price</strong>s for <strong>carbon</strong><br />
allowances. Moreover, a related aspect, referred <strong>to</strong> as <strong>carbon</strong> finance has recently<br />
attracted the attention of international inves<strong>to</strong>rs. In this concept, investment<br />
decisions yielding <strong>carbon</strong> emission savings in form of energy consumption reduction<br />
(or its production from renewable/low-emitting sources) are examined with respect<br />
<strong>to</strong> all potentially generated ”<strong>carbon</strong> assets” . The revenue from these assets can<br />
be used <strong>to</strong> (partially) pay back the investments. Needless <strong>to</strong> say, that the success<br />
of projects including a <strong>carbon</strong> finance component is determined by the correct<br />
valuation of their returns, and these cash-flows are equivalent <strong>to</strong> derivatives written<br />
on future <strong>carbon</strong> <strong>price</strong>s.<br />
In a cap and trade system (like EU ETS) the allowance <strong>price</strong>s are determined by<br />
the existing abatement strategies, in particular by their costs and their flexibility.<br />
In the case of EU ETS, we have <strong>to</strong> distinguish between two types of abatement<br />
policies, referred <strong>to</strong> as long term and short term measures in the sequel. As the<br />
name reveals, the main difference is the time horizon needed <strong>to</strong> return the corresponding<br />
<strong>carbon</strong> emission savings. Furthermore, the long-term measures require<br />
high investments (fixed costs) which are, in general irreversible, whereas short-term<br />
measures cause merely costs which are proportional <strong>to</strong> the saved amount of <strong>carbon</strong><br />
(variable costs). Examples of long-term measures are optimization/substitution of<br />
high polluting production units, installation of scrubbers, investment in CDM-<br />
4
and JI- projects. On the contrary, short term abatement measures yield emission<br />
savings within days, typically by replacing fuels or skipping/re-scheduling the<br />
production. The main short term abatement potential stems from the electricity<br />
sec<strong>to</strong>r, where the production is switched from hard coal <strong>to</strong> gas. On this account,<br />
commodity <strong>price</strong> models (in particular, fuel <strong>price</strong> models) form an intrinsic part of<br />
<strong>carbon</strong> <strong>price</strong> description. Consequently, we attempt <strong>to</strong> find out how the emission<br />
allowances <strong>price</strong> evolution is <strong>quantitative</strong>ly related <strong>to</strong> the fuel <strong>price</strong> development<br />
and emission influencing fac<strong>to</strong>rs, e.g. weather, plant outages. Both, long and short<br />
term abatements influence allowance <strong>price</strong>s in related but conceptually different<br />
ways, which are incorporated in the following model.<br />
2 Mathematical model<br />
In this <strong>approach</strong>, a stylized cap and trade system is considered, where market<br />
participants trade allowances and apply long and short term abatement policies<br />
<strong>to</strong> fulfill the compliance.<br />
We proceed from the realization that the <strong>carbon</strong> <strong>price</strong> development reflects the<br />
private economic interests of installations, concerned by emission regulations in a<br />
cap and trade framework. Thus, the main aspect in our <strong>modeling</strong> is <strong>to</strong> face the<br />
individual strategy optimization of single market participants, exposed <strong>to</strong> <strong>carbon</strong><br />
<strong>price</strong> <strong>risk</strong>. We consider personal incentives of stylized agents who possess the<br />
flexibility of short term emission reduction, which is exercised whenever emission<br />
allowance <strong>price</strong>s indicate that this is reasonable. On this account, commodity <strong>price</strong><br />
models (in particular, fuel <strong>price</strong> models) form an intrinsic part of <strong>carbon</strong> <strong>price</strong><br />
description. Consequently, we attempt <strong>to</strong> find out how the emission allowances<br />
<strong>price</strong> evolution is <strong>quantitative</strong>ly related <strong>to</strong> the fuel <strong>price</strong> development.<br />
We consider N ∈ N market participants trading <strong>carbon</strong> allowances at the discrete<br />
times {0, 1, . . . , T } ⊂ N. At these times, they also produce electricity from fossil<br />
fuel. The entire time horizon corresponds <strong>to</strong> one compliance period, that is, at<br />
maturity T all agents have <strong>to</strong> cover their <strong>carbon</strong> emissions by allowances or, on<br />
the contrary, <strong>to</strong> pay penalties. Let us introduce the model ingredients.<br />
We agree <strong>to</strong> describe all <strong>price</strong>s and strategies by appropriate adapted s<strong>to</strong>chastic<br />
processes on a filtered probability space (Ω, F, P, (F t ) T t=0 ).<br />
Write A = (A t ) T t=0 for the futures <strong>price</strong> with delivery date T of <strong>carbon</strong> allowances<br />
and assume that it follows a positive–valued s<strong>to</strong>chastic process. Note that due<br />
<strong>to</strong> the definition of the futures <strong>price</strong>, A T equals <strong>to</strong> the spot <strong>price</strong> for <strong>carbon</strong><br />
allowances at the final time T . A futures trading strategy of the agent i is given<br />
by the process θ i = (θt) i T t=0 −1 , where θi t for t = 0, . . . , T − 1 stands for the number<br />
of futures contracts held by the producer i = 1, . . . , N . The wealth (V θi ,A<br />
t ) T t=0 of<br />
5
such a strategy follows the recursion<br />
V θi ,A<br />
t+1 = V θi ,A<br />
t + θ i t(A t+1 − A t ) t = 0, . . . , T − 1, V θi ,A<br />
0 = 0 (1)<br />
reflecting the cash settlement of the future at any time t = 0, . . . , T . At maturity<br />
T , each producer i faces the difference between its actually emitted <strong>carbon</strong> and<br />
that allocated at the beginning. We model this quantity by an F T –measurable<br />
random variable Γ i . Note that we allow for both, negative and positive realizations<br />
of Γ i , occurring if the credit exceeds or drops below the actually realized demand<br />
. To fulfill the compliance at the end of the period, each agent adjusts the number<br />
of credits depending on the actually realized demand. We describe this action by<br />
the number of allowances θT<br />
i which the agent purchases/procures at T giving the<br />
final emission balance Γ i − θT i . In the case Γi − θT<br />
i ≥ 0 the emissions <strong>to</strong>p the<br />
amount of allowances owned at the end, a penalty of π ∈]0, ∞[ EURO is <strong>to</strong> pay<br />
for each <strong>to</strong>n which is not covered. Thus, the final wealth from trading allowances<br />
equals <strong>to</strong><br />
V θi ,A<br />
T<br />
− θT i A T − π(Γ i − θT i ) + . (2)<br />
Remark The individual allowance demand Γ i describes the compliance gap of<br />
the agent i at maturity T . Here we can agree that the long-term abatement<br />
measures are included in the sense that the emitted <strong>carbon</strong> is already adjusted<br />
by the estimated reduction from the proposed long-term measures. Thus, in this<br />
contribution, we do not explicitly consider the impact of the long-term emission<br />
reduction policies since their optimization follows its own logic and the outcome<br />
is well-foreseen.<br />
Further, we model short term abatement strategies. Let us assume that each<br />
agent i = 1, . . . , N observes its own short term abatement <strong>price</strong> (Et) i T t=0 −1 which<br />
is supposed <strong>to</strong> follow an adapted s<strong>to</strong>chastic process (note that fuel switch <strong>price</strong> is<br />
not necessarily positive). To give the reader an intuition, we illustrate the <strong>price</strong> of<br />
fuel switching from coal <strong>to</strong> gas in electricity generation, which is the main short<br />
term abatement measure in the EU ETS.<br />
Fuel switching Consider an agent i switching from a hard coal plant <strong>to</strong> a cleaner<br />
CCGT (Combined Cycle Gas Turbine) plant. In this case, the agent’s technology<br />
possesses specific emissions for gas<br />
and coal<br />
e i t CO2 1 MWh therm<br />
g = 0.202<br />
·<br />
= 0.388 t CO 2<br />
(3)<br />
MWh therm 0.52 MWh el MWh el<br />
e i t CO2 1 MWh therm<br />
c = 0.341<br />
·<br />
= 0.897 t CO 2<br />
(4)<br />
MWh therm 0.38 MWh el MWh el<br />
measured in <strong>to</strong>n of emitted <strong>carbon</strong> for the generation of one MWh of electricity.<br />
(Here, t CO2 and MWh therm , MWh el denote the <strong>to</strong>n of <strong>carbon</strong> dioxide and the<br />
Mega Watt of thermic, electrical power respectively. The CO 2 emission fac<strong>to</strong>rs<br />
6
are default values provided by the Intergovernmental Panel on Climate Change<br />
(IPCC)). The switch of production technology at time t yields per MWh of electricity<br />
a reduction of e i c − e i g = 0.509 <strong>to</strong>n <strong>carbon</strong> dioxide. At the same time, this<br />
fuel switch causes costs of h i gG i t − h i cC i t EURO per MWh, where G i t , C i t are gas<br />
and coal spot <strong>price</strong>s for the agent i at time t (expressed in EURO per MWh therm<br />
and in EURO per <strong>to</strong>n respectively). The coefficients<br />
h i g =<br />
h i c =<br />
MWh therm<br />
1<br />
= 1.92 MWh therm<br />
0.52 MWh el MWh el<br />
1 t coal 1 MWh therm<br />
= 0.378 t coal<br />
6.961 MWh therm 0.38 MWh el MWh el<br />
are specific heating rates, expressing how much fuel is consumed for generation of<br />
one MWh of electricity. (Here we have assumed that the amount of coal is measured<br />
in <strong>to</strong>n, whereas the gas amount is expressed in Mega Watt hours of thermal<br />
power since gas <strong>price</strong>s we use are given in EURO/MWh therm . The calculation of<br />
h i g is based on the reference value of 6000kcal/kg reported in McCloskey’s NWE<br />
Steam Coal Marker.) With these quantities, we have the fuel switching <strong>price</strong><br />
E i t = hi gG i t − h i cC i t<br />
e i g − e i c<br />
for all t = 0, . . . , T − 1 (5)<br />
measured in EURO per <strong>to</strong>n of <strong>carbon</strong> dioxide. Based on a given time series for<br />
coal and gas spot <strong>price</strong>s, the formula (5) yields the corresponding fuel switching<br />
<strong>price</strong> process.<br />
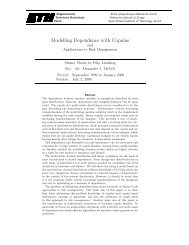
In commodity business, companies which are exposed <strong>to</strong> <strong>risk</strong>s from several input<br />
commodities hedge themselves by an appropriate futures portfolio, thus <strong>price</strong> correlations<br />
of diverse commodities become essential. In particular, the European<br />
energy business is concerned about correlations of EUA and fuel <strong>price</strong>s. However<br />
as can be seen in Figure 2 their interdepence is not obvious. A study based on our<br />
model could shed light on this important aspect.<br />
Let us turn back <strong>to</strong> the <strong>modeling</strong> of <strong>carbon</strong> <strong>price</strong> formation. We suppose that<br />
each producer i possesses a technology which at any time t = 0, . . . , T − 1 allows<br />
a reduction ξt<br />
i of at most λ i ∈ [0, ∞[ <strong>to</strong>n of <strong>carbon</strong> emitted within the period<br />
[t, t + 1] by fuel-switching. The fuel switching policy ξ i = (ξt) i T t=0 −1 yields expenses<br />
which are modeled by cash payment of the amount<br />
∑<br />
T −1<br />
ξt<br />
i<br />
t=0<br />
Et<br />
i T −1<br />
p t (T ) =<br />
∑<br />
ξtE i t i (6)<br />
at maturity T . Here, <strong>to</strong> incorporate interest effects, we have related the fuel switch<br />
spot <strong>price</strong> E t <strong>to</strong> the <strong>price</strong> p t (T ) of the zero bond maturing at T by<br />
t=0<br />
E i t := E i t/p t (T ) t = 0, . . . , T.<br />
7
350<br />
300<br />
250<br />
40<br />
35<br />
30<br />
25<br />
EUA Intraday<br />
Switch Coal-Gas<br />
Euro/t CO2<br />
200<br />
150<br />
20<br />
15<br />
10<br />
5<br />
01/04 01/05 01/06 01/07 01/08 01/09 01/10<br />
100<br />
50<br />
0<br />
01/05/05 01/07/05 01/09/05 01/11/05 01/01/06 01/03/06<br />
Figure 2: The <strong>price</strong> for EUA versus fuel switching <strong>price</strong> calculated for<br />
gas/coal spot <strong>price</strong>s.<br />
The strategy <strong>to</strong> perform fuel switch helps <strong>to</strong> meet the emission cap, since instead<br />
of the business-as-usual allowance demand Γ i merely Γ i − ∑ T −1<br />
t=0 ξi t <strong>to</strong>n of <strong>carbon</strong><br />
dioxide are <strong>to</strong> be covered at the end of the compliance period. Thus, we correct<br />
Γ i in the equation (6) by Γ i − ∑ T −1<br />
t=0 ξi t which with (2) expresses the win/loss of<br />
the producer i by<br />
I θi ,ξ i ,A,i<br />
T<br />
= V θi ,A<br />
T<br />
− θT i A T − π(Γ i − ∑ T −1<br />
t=0 ξi t − θT i )+ − ∑ T −1<br />
t=0 ξi tEt. i (7)<br />
Assumption To avoid problems in existence of expected values for (7) and (13),<br />
we suppose that<br />
Γ i , E i t are integrable for i = 1, . . . , N , t = 0, . . . , T − 1. (8)<br />
We substantiate further argumentation using Banach spaces L 1 and L ∞ of P –<br />
integrable and essentially bounded F T –measurable random variables respectively.<br />
Further, we introduce the following spaces of adapted processes<br />
L 1 := {(Ξ t ) T t=0 −1 t ∈ L 1 , t = 0, . . . , T − 1}<br />
L ∞ := {(ξ t ) T t=0 −1 t ∈ L ∞ , t = 0, . . . , T − 1}<br />
U i := {(ξt) i T t=0 −1 i]-valued process}<br />
U := × N i=1U i<br />
Following the conception that each market participant maximizes the own wealth<br />
by trading allowances and applying fuel switching, we formulate the individual<br />
optimization problem, given the fuel switch process A = (A t ) T t=0 as<br />
L 1 × L 1 × U i → R,<br />
(θ i , ξ i ) ↦→ E(I A,i<br />
T (θi , ξ i )). (9)<br />
8
With these notations, the equilibrium definition is introduced as<br />
Definition 1. Given fuel switching <strong>price</strong> process E = ((Et) i N −1<br />
i=1 )Tt=0 ∈ LN 1 of agents<br />
i = 1, . . . , N , the <strong>price</strong> process A ∗ = (A ∗ t ) T t=0 is called equilibrium <strong>carbon</strong> <strong>price</strong><br />
process, if there exists (θ i∗ , ξ i∗ ) ∈ L 1 × L 1 × U i for i = 1, . . . , N with<br />
E(I A∗ ,i<br />
T<br />
(θ i∗ , ξ i∗ )) ≥ E(I A∗ ,i<br />
T<br />
(θ i , ξ i )) for all<br />
(θ i , ξ i ) ∈ L 1 × L 1 × U i , i = 1, . . . , N<br />
(10)<br />
such that financial positions are in zero net supply<br />
N∑<br />
i=1<br />
θ ∗i<br />
t = 0 at any time t = 0, . . . , T . (11)<br />
Remark It should be emphasized that zero net supply (10) is stated at t =<br />
0, . . . , T − 1 for another reason than at t = T . For t = 0, . . . , T − 1 we have<br />
agreed that (θt ∗i ) N i=1 are futures positions, whereas at maturity, (θ∗i<br />
T )N i=1 stand for<br />
the change in the initial physical allocation of the agents i = 1, . . . , N .<br />
It turns out that the above equilibrium notion enjoys the property of social optimality.<br />
Namely, we show that equilibrium in the above sense au<strong>to</strong>matically results<br />
in the solution of a certain global optimization problem, where the <strong>to</strong>tal pollution<br />
is reduced at minimal overall costs. Beyond the economical interpretations<br />
of social-optimality, the importance of the global optimization is that its solutions<br />
helps <strong>to</strong> show the equilibrium existence and <strong>to</strong> calculate the corresponding <strong>carbon</strong><br />
<strong>price</strong>s. Let us explore this connection.<br />
Suppose we are given the fuel switching <strong>price</strong>s E ∈ L N 1 of agents i = 1, . . . , N .<br />
For the switching policy ξ ∈ U , we denote the final overall switching costs by<br />
Further, write<br />
F (ξ) =<br />
N∑<br />
T∑<br />
−1<br />
ξtE i t.<br />
i<br />
i=1 t=0<br />
Π(ξ) =<br />
N∑<br />
T∑<br />
−1<br />
ξt, i (12)<br />
i=1 t=0<br />
for the entire saved <strong>carbon</strong>, when following policy ξ and denote by<br />
Γ =<br />
N∑<br />
i=1<br />
the overall allowance demand. Finally, express the <strong>to</strong>tal objective from fuel switching<br />
and penalty payments as<br />
Γ i<br />
G(ξ) = −F (ξ) − π(Γ − Π(ξ)) + , ξ ∈ U, (13)<br />
9
and introduce the global optimization problem<br />
E(G(ξ ∗ )) = sup E(G(ξ)), (14)<br />
ξ∈U<br />
where a switching policy ξ ∗ ∈ U for all agents is <strong>to</strong> be determined, which minimizes<br />
the social costs of non-compliance.<br />
The existence of ξ ∗ is ensured by standard arguments presented in section 4.1<br />
Proposition 1. With above notations and assumptions, there exists a solution<br />
ξ ∗ ∈ U <strong>to</strong> the global optimal control problem (14).<br />
It turns out that the equilibrium <strong>carbon</strong> <strong>price</strong> equals <strong>to</strong> the marginal contribution<br />
of an extra allowance <strong>to</strong> lower the potential payment in the case of non-compliance<br />
A ∗ t = − ∂<br />
∂x E(π(Γ − Π(ξ∗ ) − x) + | F t )<br />
provided that the global-optimal fuel switching policy ξ ∗ ∈ U from (13) is followed.<br />
However, the precise formulation is given in the main theorem below, whose proof<br />
is based on additional results, and therefore, is addressed in a separate Section 4.1.<br />
Theorem 1. Suppose that<br />
the F T −1 -conditional distribution of Γ<br />
posseses almost surely no point mass.<br />
(15)<br />
With above notations and assumptions, the equilibrium <strong>carbon</strong> <strong>price</strong> process is<br />
given in terms of global-optimal policy ξ ∗ ∈ U from the Proposition 1 by<br />
A ∗ t = πE(1 {Γ−Π(ξ ∗ )≥0} | F t ) for t = 0, . . . , T . (16)<br />
3 Quantitative results<br />
For illustration purposes, this section is devoted <strong>to</strong> <strong>quantitative</strong> aspects of <strong>carbon</strong><br />
market equilibrium. We elaborate on a generic model whose parameters are chosen<br />
close <strong>to</strong> the situation of EU ETS. However, <strong>to</strong> realize calculations, we have <strong>to</strong> agree<br />
on several simplifications, which are justified through the case-by-case arguments<br />
given below.<br />
For simplicity, we neglect the discounting effects by supposing that the interest<br />
rate equals <strong>to</strong> zero. Further, we focus on the one-period market implementing<br />
so the theoretical considerations from the previous sections. Note however that<br />
such a description does not fully reflect the situation of EU ETS in the period<br />
2005–2007, since a certain amount of allowances could be banked in<strong>to</strong> the next<br />
10
period 2008–2012 and, more importantly, the penalty structure is different from<br />
what we model. At the end of the first EU ETS period, one EUA from the second<br />
period is charged for non-compliance in addition <strong>to</strong> a fee of 40 EURO. Another<br />
simplification is that we do not consider the impact of allowances gained from<br />
CDM- and JI-projects. This assumption seems maintainable, since the allowance<br />
demand reduction resulting from CDM and JI is well-forseen, hence it is captured<br />
by the anticipated demand dynamics (E(Γ|F t )) T t=0 . However, more difficile is that<br />
we consider a single fuel switch <strong>price</strong> process. The argument therefore is that<br />
in order <strong>to</strong> save <strong>carbon</strong>, the cheapest technology is applied first. Thus, given a<br />
sufficient amount of the corresponding switch capacity, other technologies are never<br />
used. We belive that this situation matches the European electricity business,<br />
where the new CCGT-technology (giving 52 % efficiency) captures a notable part<br />
of production with more than 100 Giga Watt of installed capacity in 2008. In<br />
our calculation, we assume the fuel switch capacity amounts <strong>to</strong> λ := 570.08 Mega<br />
<strong>to</strong>nn per day, i.e. a the power of 70 GW from CCGT technology is available 16h a<br />
day (since within 8h of peak load time both, the CCGT and coal technology run<br />
simultaneously). Next, let us elaborate on the time resolution in our calculations.<br />
Since the model is set up in terms of<br />
(E t ) T −1<br />
t=0 , (Γ t = E(Γ|F t )) T t=0 (17)<br />
which represent the evolutions of fuel switch <strong>price</strong> and of expected demand respectively,<br />
the reasonable time unit should not fall below the time required <strong>to</strong><br />
re-schedule a CCGT turbine. Nonetheless, we put this fact back in favor of using<br />
continuous-time pendants<br />
(E(t)) t∈[0,T ] , (Γ(t)) t∈[0,T ] (18)<br />
for fuel switch <strong>price</strong> and expected demand evolutions. Note that we write the time<br />
parameter in parenthesizes instead using subscript, <strong>to</strong> indicate continuous-time<br />
processes. Moreover, the horizon for continuous time is [0, T ], where we suppose<br />
that the time unit equals <strong>to</strong> one year. By sampling (18) at discrete times, we<br />
obtain discrete-time versions for (17) on the daily time step resolution.<br />
Fuel switch process Since during the pre-Kyo<strong>to</strong> period 2005 – 2007 at least<br />
half of the entire EU fuel switch capacity is located within the United Kingdom,<br />
we have decided <strong>to</strong> base fuel switch <strong>price</strong>s on the McCloskey North-West Europe<br />
Steam Coal Index and on natural gas <strong>price</strong>s from NBP (National Balancing Point,<br />
which specifies delivery location within the UK). The continuous–time fuel switch<br />
<strong>price</strong> process is modeled by<br />
where the deterministic part<br />
P (t) = a + bt +<br />
E(t) = P (t) + X(t) t ∈ [0, T ] (19)<br />
2∑<br />
c j cos(2πϕ j t + l j ) t ∈ [0, T ] (20)<br />
j=0<br />
11
70<br />
60<br />
50<br />
40<br />
Euro/MWh<br />
30<br />
20<br />
10<br />
0<br />
-10<br />
-20<br />
01/01/03 07/01/03 01/01/04 07/01/04 01/01/05 07/01/05<br />
Figure 3: His<strong>to</strong>rical fuel switch <strong>price</strong>s for CCGT technology calculated with<br />
(5) and based on his<strong>to</strong>rical data from McCloskey Index and NBP natural gas<br />
spot <strong>price</strong>s.<br />
accounts for a linear <strong>price</strong> increase superposed by seasonal <strong>price</strong> fluctuations. The<br />
s<strong>to</strong>chastic part (X(t)) t∈[0,T ] is modeled by an Ornstein-Uhlenbeck process whose<br />
evolution follows the s<strong>to</strong>chastic differential equation<br />
dX(t) = γ(α − X(t))dt + σdW (t) (21)<br />
driven by Brownian motion (W (t)) t∈[0,T ] with parameters γ, α, σ ∈ R. After<br />
performing estimation (for details, we refer the reader <strong>to</strong> the Section 4.2) based<br />
on his<strong>to</strong>rical data depicted in the Figure 3, the process (19) is identified with the<br />
following parameters:<br />
s<strong>to</strong>chastic part (X(t)) t∈[0,T ]<br />
γ α σ<br />
31.82 −0.12 68.24<br />
(22)<br />
deterministic part (P (t)) t∈[0,T ]<br />
a b c 0 ϕ 0 l 0 c 1 ϕ 1 l 1 c 2 ϕ 2 l 2<br />
21.42 6.19 7.62 1 5.95 0.55 2 1.14 1.11 3 3.24<br />
(23)<br />
Expected allowance demand The continuous-time pendant for the expected<br />
allowance demand is described by<br />
Γ(t) := m + vW ′ (t) t ∈ [0, T ]<br />
where (W ′ (t)) t∈[0,T ] follows a Brownian motion independent of (W (t)) t∈[0,T ] in<br />
(21). In this context, the parameters m and v are interpreted as the mean and<br />
the standard deviation (times T ) of the final allowance demand. In accordance<br />
with market data for EU ETS we have set m = 52, v = 52 which are expressed<br />
12
in Mega <strong>to</strong>ns of <strong>carbon</strong> dioxide.<br />
Numerical implementation As mentioned earlier, both processes (E(t)) t∈[0,T ]<br />
and (Γ(t)) t∈[0,T ] are interpreted as continuous time pendants of fuel switch <strong>price</strong>s<br />
and expected allowance demand respectively. For numerical calculations, we have<br />
applied the standard trinomial tree discretization of each component of the twodimensional<br />
diffusion process (E(t), Γ(t)) t∈[0,T ] <strong>to</strong> solve the corresponding dynamic<br />
optimization problem (14) through backward induction method. The Figure 4<br />
graphically illustrates this technique. At each node, we see a splitting in<strong>to</strong> three<br />
Figure 4: The optimal control by backward induction, applied <strong>to</strong> the trinomial<br />
tree discretization <strong>to</strong> each component of the processes (E(t), Γ(t)) t∈[0,T ] .<br />
vertical and three horizontal directions, giving nine branches in all. The vertical<br />
direction describes the movement of the fuel switch <strong>price</strong>, whereas the horizontal<br />
illustrates the expected demand dynamics. At maturity time, paths disembogue<br />
either at positive realizations of the allowance demand (blue points) or at nonpositive<br />
(red points). The optimally controlled fuel switch process is calculated<br />
by backward induction: At each node the maximum principle is applied <strong>to</strong> decide<br />
either <strong>to</strong> apply the fuel switch or not. If the fuel switch is performed, then the<br />
state is changed due <strong>to</strong> the effectively reduced allowance demand, indicated by a<br />
move <strong>to</strong> the next lower tree in the forest diagram.<br />
We now discuss the impact of parameters on <strong>carbon</strong> <strong>price</strong>. The following numerical<br />
illustration is based on discrete-time model (E t ) T t=0 −1 , (Γ t) T t=0 which corresponds<br />
<strong>to</strong> the parameters (22), (23) estimated in Section 4.2. Here, time horizon<br />
0, . . . , T = 253 stands for the year 2005 (the fuel switch process is based on the<br />
deterministic component from this year and the starting point E 0 is set at the<br />
value of the deterministic component at the beginning of January 2005).<br />
Present values For commensurability reasons, we have decided <strong>to</strong> show the dependence<br />
of allowance <strong>price</strong> A ∗ t on allowance demand Γ t in terms of the relative<br />
13
demand<br />
s=0 ξ s<br />
δ t = Γ t − ∑ t<br />
λ(T − t)<br />
, t = 0, . . . , T − 1<br />
which stands for the percentage of time steps at which the fuel switch at full intensity<br />
is needed in order <strong>to</strong> meet the compliance. The dependence illustrated in<br />
the Figure 5 is obvious. The <strong>price</strong> A ∗ t is increasing in δ t and E t . Moreover, for<br />
δ t → +∞, the allowance <strong>price</strong> <strong>approach</strong>es the boundary π of 40 EURO, whereas<br />
*<br />
A t2 *<br />
A t1 40<br />
40<br />
40<br />
35<br />
35<br />
30<br />
25<br />
40<br />
35<br />
35<br />
30<br />
25<br />
30<br />
25<br />
20<br />
15<br />
10<br />
30<br />
25<br />
20<br />
15<br />
10<br />
20<br />
15<br />
5<br />
0<br />
20<br />
15<br />
5<br />
0<br />
10<br />
10<br />
5<br />
5<br />
0<br />
250<br />
200<br />
150<br />
100<br />
50<br />
0<br />
-50<br />
-100<br />
-150<br />
-10 10305070 E t2<br />
0<br />
250<br />
200<br />
150<br />
100<br />
50<br />
0<br />
-50<br />
-100<br />
-150<br />
-10 10305070 E t1<br />
δ t2<br />
δ t1<br />
Figure 5: The dependence of allowance <strong>price</strong> on the present expected demand<br />
δ t and E t for different times (right: t = t 1 beginning of March, left: t = t 2<br />
beginning of September).<br />
for δ t → −∞ it tends <strong>to</strong> 0. Further, A ∗ t changes significantly with moderate deviations<br />
in δ t . On the contrary, the impact of the present fuel switch <strong>price</strong> E t is weak<br />
due <strong>to</strong> the distinct mean reversion. This poor correlation between instantanuous<br />
fuelswitch <strong>price</strong> and allowance <strong>price</strong> is accurate also in reality as can be observed<br />
in Figure 2. Despite the low dependence of A ∗ t on E t , we suppose though that fuel<br />
switch <strong>price</strong> is a significant fac<strong>to</strong>r, whose impact is effected through the expected<br />
long term fuel switch <strong>price</strong>s (<strong>to</strong> be deduced from fuel futures, whose dynamics is<br />
not modeled here).<br />
Dependence on model parameters In accordance, the left picture in Figure 6<br />
shows high sensitivity of allowance <strong>price</strong> on α, which settles the level of expected<br />
long term fuel <strong>price</strong>s. For this reason, we have decided <strong>to</strong> visualize the effect of<br />
α by a plot of A ∗ 0 against E(∑ T −1<br />
t=0 E t)/T . Moreover, this figure shows a weak<br />
dependence of allowance <strong>price</strong> on σ , which we illustrate by a plot of A ∗ 0 against<br />
the stationary fuel switch <strong>price</strong> variance σ 2 /(2γ). The right picture in the Figure<br />
6 shows that dependence of A ∗ 0 with respect <strong>to</strong> changes in E(Γ)/(λT ) is higher<br />
than in v . In other words, the dependence of allowance <strong>price</strong> on the need for<br />
emission reductions is high whereas the uncertainty about necessitative emission<br />
reduction is of secondary importance.<br />
14
Let us summarize our findings. The allowance <strong>price</strong> should be significantly correlated<br />
<strong>to</strong> the expected long term fuel <strong>price</strong>s and <strong>to</strong> the expected need for emission<br />
reduction amount. That are the main <strong>price</strong> drives, since the remaining fac<strong>to</strong>rs<br />
(recent fuel switch <strong>price</strong>s, their volatility, uncertainty on the required emission<br />
reduction amount) have a minor effect on the <strong>carbon</strong> <strong>price</strong> formation.<br />
*<br />
A 0<br />
*<br />
A 0<br />
40<br />
35<br />
30<br />
40<br />
40<br />
35<br />
35<br />
30<br />
25<br />
20<br />
25<br />
20<br />
15<br />
10<br />
5<br />
35<br />
30<br />
25<br />
20<br />
30<br />
25<br />
20<br />
15<br />
10<br />
5<br />
15<br />
0<br />
15<br />
0<br />
10<br />
10<br />
5<br />
5<br />
0<br />
90<br />
70<br />
50<br />
σ 2 /(2γ)<br />
30<br />
10<br />
-10<br />
10<br />
30<br />
70<br />
50<br />
∑<br />
E( E s )/T<br />
s<br />
0<br />
50<br />
40<br />
30<br />
v<br />
20<br />
10<br />
-40<br />
0<br />
40<br />
120<br />
80<br />
Γ 0 /(λT)<br />
Figure 6: On the left: the impact of α and σ on allowance <strong>price</strong>, expressed<br />
for γ = 31.82 through long-term fuel switch <strong>price</strong> mean E( ∑ T −1<br />
t=0 E t)/T and<br />
variance σ 2 /(2γ) respectively. On the right: the impact of v and E(Γ)/(λT ).<br />
Regula<strong>to</strong>ry aspects Designing a legally binding scheme, one of the main concerns<br />
for regula<strong>to</strong>ry authority is on one hand, <strong>to</strong> fulfill environmental targets (at<br />
least with a certain probability) and, on the other hand, <strong>to</strong> achieve this emission<br />
reduction at the lowest costs for the final consumer. Thus, we have studied the<br />
dependence of compliance probability and allowance <strong>price</strong> on the penalty level and<br />
on the initial expected allowance demand (note that this value is controlled by the<br />
<strong>to</strong>tal amount of allocated allowances). The diagrams in the Figure 7 show the<br />
corresponding calculations. Again we show this influence in terms of the relative<br />
demand δ 0 = E(Γ)/(λT ), which stands for the percentage of time steps at which<br />
the fuel switch at full intensity is needed in order <strong>to</strong> meet the initially expected<br />
allowance demand. One concludes that up <strong>to</strong> the relative demand of 50% the<br />
penalty can be increased without a notable increase of the allowance <strong>price</strong>, giving,<br />
however a strong increase of the compliance probability. If the relative demand is<br />
far above 50%, then the situation changes. The moderate increase of compliance<br />
probability is reached only at the expenses of high allowance <strong>price</strong>. Note that the<br />
initial allowance <strong>price</strong> is directly related <strong>to</strong> the consumers costs since EUA’s are<br />
added <strong>to</strong> electricity <strong>price</strong>s as an extra consumed commodity.<br />
Derivatives payoff In this <strong>approach</strong>, we do not discuss <strong>risk</strong> neutral valuation<br />
of <strong>carbon</strong> derivatives, since the corresponding <strong>risk</strong> neutral dynamics has not been<br />
15
0.1<br />
P(Γ>Π(ξ * ))<br />
*<br />
A 0<br />
1<br />
80<br />
1<br />
0.8<br />
0.6<br />
0.4<br />
0.9<br />
0.8<br />
0.7<br />
0.6<br />
0.5<br />
0.4<br />
0.3<br />
0.2<br />
0.1<br />
90<br />
80<br />
70<br />
60<br />
50<br />
40<br />
30<br />
70<br />
60<br />
50<br />
40<br />
30<br />
20<br />
10<br />
0<br />
0.2<br />
20<br />
0<br />
110<br />
90<br />
70<br />
π<br />
50<br />
30<br />
90<br />
70 50 30 Γ 0 /(λT)<br />
10<br />
10<br />
0<br />
110<br />
90<br />
70<br />
π<br />
50<br />
30<br />
90<br />
70 50 30 Γ 0 /(λT)<br />
10<br />
Figure 7: The probability of non-compliance and the initial allowance <strong>price</strong><br />
depending on penalty size and fuel switch demand.<br />
C t2<br />
C t1<br />
5<br />
4<br />
3<br />
2<br />
C t2<br />
0<br />
0<br />
5<br />
4.5<br />
4<br />
3.5<br />
3<br />
2.5<br />
2<br />
1.5<br />
1<br />
0.5<br />
0<br />
5<br />
4<br />
3<br />
2<br />
C t1<br />
0<br />
5<br />
4.5<br />
4<br />
3.5<br />
3<br />
2.5<br />
2<br />
1.5<br />
1<br />
0.5<br />
1<br />
1<br />
0<br />
250<br />
200<br />
150<br />
100<br />
50<br />
0<br />
-50<br />
-10 10305070 E t2<br />
0<br />
250<br />
200<br />
150<br />
100<br />
50<br />
0<br />
-50<br />
-10 10305070 E t1<br />
δ t2<br />
δ t1<br />
Figure 8: Expected payoff of the European Call with strike <strong>price</strong> 35 EURO<br />
with maturity at the beginning of Oc<strong>to</strong>ber at different times; t = t 1 beginning<br />
of March, t = t 2 beginning of September. The call payoff is plotted against<br />
the recent fuel switch <strong>price</strong> E t and the relative allowance demand δ t .<br />
addressed. However, the practice of weather derivatives has shown that an estimation<br />
of derivatives payoffs is also important in <strong>risk</strong> management. Figure 8 shows<br />
the expected payoff of a European Call. Again, we observe a weaker dependence<br />
on the initial fuel switch <strong>price</strong> than on the allowance demand.<br />
4 Appendix<br />
4.1 The equilibrium <strong>carbon</strong> <strong>price</strong> process<br />
To show that the equilibrium <strong>carbon</strong> <strong>price</strong> is connected <strong>to</strong> the solution of the<br />
global control problem (14) via (16), the following re-parameterization is required.<br />
16
Given the fuel switching policy (ξt) i T t=0 −1 ∈ U i of the agent i, replace the de fac<strong>to</strong><br />
allowances trading (θt) i T t=0 ∈ L 1 × L 1 by the virtual trading (ϑ i t) T t=0 ∈ L 1 × L 1<br />
given by<br />
t∑<br />
ϑ i t = θt i + ξs, i t = 0, . . . , T. (24)<br />
Next, for (ϑ i t) T t=0 ∈ L 1 × L 1 , (ξ i t) T −1<br />
t=0 ∈ U i introduce the objective<br />
s=0<br />
I A,i<br />
T (ϑi , ξ i ) := V ϑi ,A<br />
T<br />
− ϑ i T A T − π(Γ i − ϑ i T )+ + ∑ T −1<br />
t=0 ξi t(A t − Et). i (25)<br />
which, as shown in the proof of the following proposition, expresses (7) in terms<br />
of the virtual trading in the sense that<br />
if (ξ i t) T −1<br />
t=0 , (ϑi t) T t=0 , (θi t) T t=0<br />
fulfill (24), then IA,i<br />
T<br />
(θi , ξ i ) = I A,i<br />
T (ϑi , ξ i ). (26)<br />
Consequently, we have the following equilibrium characterization for the new parameterization<br />
(compare with Definition 1)<br />
Proposition 2. A ∗ = (A ∗ t ) T t=0 is an equilibrium <strong>carbon</strong> <strong>price</strong> process, if for i =<br />
1, . . . , N there exist (ϑ i∗ , ξ i∗ ) ∈ L 1 × L 1 × U i satisfying<br />
E(I A∗ ,i<br />
T<br />
(ϑ i∗ , ξ i∗ )) ≥ E(I A∗ ,i<br />
T<br />
(ϑ i , ξ i )) for all<br />
(ϑ i , ξ i ) ∈ L 1 × L 1 × U i , i = 1, . . . , N<br />
(27)<br />
and<br />
N∑<br />
i=1<br />
ϑ ∗i<br />
t =<br />
N∑<br />
t∑<br />
i=1 s=0<br />
ξ ∗i<br />
s holds at each time t = 0, . . . , T . (28)<br />
Proof. Since the re-parameterization mappings<br />
L 1 × L 1 × U i → L 1 × L 1 × U i , (θ i , ξ i ) → (ϑ i , ξ i )<br />
from (24) are bijections for all i = 1, . . . , N and (θ i , ξ i ) N i=1 fulfills (11) if and only<br />
if (ϑ i , ξ i ) N i=1 satisfies (28), it suffices <strong>to</strong> prove (26). This assertion is derived as<br />
follows:<br />
V θi ,A<br />
T<br />
− θ i T A T =<br />
T∑<br />
θ s (A s+1 − A s ) − θT i A T<br />
s=0<br />
= −θ 0 A 0 +<br />
= −ϑ 0 A 0 +<br />
T∑<br />
(θ s−1 − θ s )A s<br />
s=1<br />
T∑<br />
T∑<br />
−1<br />
(ϑ s−1 − ϑ s )A s + ξ s A s<br />
s=1<br />
s=0<br />
T∑<br />
−1<br />
= V ϑi ,A<br />
T<br />
− ϑ i T A T + ξ s A s , (29)<br />
17<br />
s=0
next, utilize (24) in <strong>to</strong> obtain<br />
T∑<br />
−1<br />
π(Γ i − ξt i − θT i ) + = π(Γ i − ϑ i T ) + (30)<br />
t=0<br />
and subtract (30) from (29) <strong>to</strong> verify (26).<br />
Remark Before entering the proof of the Proposition 1, let us give some feeling<br />
about the mechanism responsible for the equilibrium <strong>carbon</strong> <strong>price</strong> formation. The<br />
objective (25) shows two effects working on opposite directions<br />
i) the impact of <strong>carbon</strong> <strong>price</strong> on emission reduction strategies<br />
ii) the overall effect of emission reduction on the <strong>carbon</strong> <strong>price</strong><br />
Namely, the last term in (25) is responsible for i), illustrating that the fuel switching<br />
ξt i > 0 is optimally performed if and only if the own switching <strong>price</strong> falls below<br />
the market <strong>carbon</strong> <strong>price</strong>: A t − Et i ≥ 0. This emission reduction, in turn, is connected<br />
<strong>to</strong> ii) through the expected final <strong>carbon</strong> <strong>price</strong> A T . The higher is the current<br />
<strong>price</strong> A t , the more agents apply fuel switching decreasing so the probability that<br />
the market will be short of credits at the end of the compliance period. However<br />
decreasing this probability also decreases the expected final need for <strong>carbon</strong> allowances<br />
and consequently lowers the expected final <strong>carbon</strong> <strong>price</strong> A T . Being a<br />
financial asset, <strong>carbon</strong> allowances can not exhibit a significant <strong>price</strong> decay from<br />
A t <strong>to</strong> A T , that is, the fuel switching at time t also diminishes A t . Thus, there<br />
is an equilibrium level <strong>to</strong> be reached by <strong>carbon</strong> <strong>price</strong> at any time. At time t, the<br />
equilibrium <strong>carbon</strong> <strong>price</strong> depends on the expected overall compliance gap E(Γ | F t )<br />
and on the expected future <strong>price</strong>s (E(E s | F t )) T s=t<br />
−1 of fuel switching.<br />
We are now prepared <strong>to</strong> prove the main Theorem 1.<br />
Proof. Due <strong>to</strong> the Proposition 2, the equilibrium property of (A ∗ t ) T t=0 can be shown<br />
by an explicit construction of (ϑ i∗ , ξ i∗ ) ∈ L 1 × L 1 × U i , i = 1, . . . , N which fulfill<br />
(27) and (28). To proceed so, let ξ ∗ ∈ U be from the Proposition 1 and define by<br />
(ϑ i∗ ) N i=1 ∈ (L 1 × L 1 ) N<br />
ϑ ∗i<br />
t =<br />
t∑<br />
s=0<br />
ξ ∗i<br />
s for all i = 1, . . . , N, t = 0, . . . , T − 1,<br />
ϑ i∗<br />
T = Γ i − (Γ − Π(ξ ∗ ))/N.<br />
The restriction (28) is obviously fulfilled, so we focus on (27).<br />
18
For ϑ ∈ (L 1 × L 1 ) N , ξ ∈ U , and <strong>carbon</strong> <strong>price</strong> processes (16), express (25) as<br />
T∑<br />
−1<br />
T∑<br />
−1<br />
I A∗ ,i<br />
T<br />
(ϑ i , ξ i ) = ϑ i t(A ∗ t+1 − A ∗ t ) − ϑ i T A ∗ T − π(Γ i − ϑ i T ) + + ξt(A i ∗ t − Et) i (31)<br />
t=0<br />
which gives the expected value<br />
T∑<br />
−1<br />
E(I A∗ ,i<br />
T<br />
(ϑ i , ξ i )) = E(−ϑ i T A ∗ T − π(Γ i − ϑ i T ) + ) + E( ξt(A i ∗ t − Et))<br />
i<br />
since the process A ∗ ∈ L ∞ follows a martingale by definition (16) and (ϑ i t) T −1<br />
t=0 is<br />
an element from L 1 . Thus, <strong>to</strong> show (27), it suffices <strong>to</strong> prove that<br />
t=0<br />
t=0<br />
ϑ i T ↦→ E(−ϑ i T A ∗ T − π(Γ i − ϑ i T ) + )<br />
is maximized on L 1 at ϑ i∗<br />
T , (32)<br />
T∑<br />
−1<br />
whereas ξ i ↦→ E( ξt(A i ∗ t − Et)) i is maximized on U i at ξ i∗ . (33)<br />
t=0<br />
First, we turn <strong>to</strong> (32) showing that the maximum is attained pointwise. By (16),<br />
ω ∈ {Γ − Π(ξ ∗ ) < 0} implies that A ∗ T<br />
(ω) = 0 and ϑi∗<br />
T (ω) > Γi (ω). Moreover, the<br />
maximum of<br />
z ↦→ −zA T (ω) − π(Γ i (ω) − z) + (34)<br />
is attained on each point from [Γ i (ω), ∞[, thus ϑ i∗<br />
T<br />
(ω) is a maximizer. In the other<br />
case, ω ∈ {Γ − Π(ξ ∗ ) ≥ 0}, we have A ∗ T<br />
(ω) = π and ϑi∗<br />
T (ω) ≤ Γi (ω). Here the<br />
maximum of (34) is attained on [0, Γ i (ω)], thus ϑ ∗ T<br />
(ω) is a maximizer.<br />
Now we turn <strong>to</strong> (33). It suffices <strong>to</strong> show that for each i = 1, . . . , N and t ∈<br />
{0, . . . , T − 1} the following inclusions hold almost surely<br />
{A ∗ t − Et i > 0} ⊆ {ξt ∗i = λ i }, (35)<br />
{A ∗ t − Et i < 0} ⊆ {ξt ∗i = 0}. (36)<br />
First, we emphasize that the dynamical principle of optimal control implies that<br />
for any ξ ∈ U with ξ s = ξs ∗ for s = 0, . . . , t − 1.<br />
E(G(ξ)|F t ) ≤ E(G(ξ ∗ )|F t ) holds almost surely<br />
(37)<br />
This assertion is seen by the following argumentation: On the contrary, one uses<br />
the F t –measurable set<br />
M := {E(G(ξ)|F t ) > E(G(ξ ∗ )|F t )} of positive measure P (M) > 0,<br />
<strong>to</strong> outperform ξ ∗ by ξ ′ as<br />
ξ ′ s = 1 M ξ s + 1 Ω\M ξ ∗ s for all s = 0, . . . , T − 1. (38)<br />
19
Note that since ξ and ξ ′ coincide at times 0, . . . , t−1, this definition indeed yields<br />
an adapted process ξ ′ ∈ U . With (38), we have the decomposition<br />
G(ξ ′ ) = 1 M G(ξ) + 1 Ω\M G(ξ ∗ ),<br />
which gives a contradiction <strong>to</strong> the optimality of ξ ∗ :<br />
E(G(ξ ′ )) = E(E(1 M G(ξ) + 1 Ω\M G(ξ ∗ )|F t ))<br />
= E(1 M E(G(ξ)|F t ) + 1 Ω\M E(G(ξ ∗ )|F t ))<br />
> E(1 M E(G(ξ ∗ )|F t ) + 1 Ω\M E(G(ξ ∗ )|F t )) = E(G(ξ ∗ )).<br />
To prove (35) and (36) we consider for each λ in the countable set Q := [0, λ i ] ∩ Q<br />
a strategy ξ(λ, i) ∈ U defined by<br />
{<br />
ξs k λ if s = t and k = i<br />
(q, i) =<br />
,<br />
else<br />
ξ ∗k<br />
s<br />
That is, ξ(λ, i) coincides with ξ ∗ with the exception of time t, where only for<br />
the agent i the fuel switch intensity is changed from ξt<br />
∗i <strong>to</strong> a deterministic value<br />
λ ∈ Q. The policy ξ(λ, i) satisfies<br />
Π(ξ(λ, i)) = Π(ξ ∗ ) − (ξt ∗i − λ)<br />
F (ξ(λ, i)) = F (ξ ∗ ) − (ξt<br />
i∗ − λ)Et<br />
i<br />
for all λ ∈ Q. (39)<br />
Since the set Q is countable due <strong>to</strong> (37), there exists a set ˜Ω with P (˜Ω) = 1 such<br />
that<br />
E(G(ξ ∗ |F t ))(ω) − E(G(ξ(λ, i)|F t ))(ω)<br />
≥<br />
(ω) − λ|<br />
|ξ ∗i<br />
t<br />
Using (39) and (13), we conclude from this inequality that<br />
0 ≤ − ξ∗i t (ω) − λ<br />
|ξt ∗i(ω)<br />
− t(ω)<br />
λ|Ei<br />
0 for all ω ∈ ˜Ω with λ ≠ ξ ∗i<br />
t (ω).<br />
−E(π (Γ T − Π(ξ ∗ )) + − (Γ T − Π(ξ ∗ ) + (ξt ∗i − λ)) +<br />
|ξt ∗i<br />
| F t )(ω) (40)<br />
− λ|<br />
holds for all ω ∈ ˜Ω with λ ≠ ξt ∗i (ω). Let us denote the term in in (40) by<br />
D(ξ ∗ , λ)(ω) Approaching ξt ∗i (ω) by λ ∈ Q \ {ξt ∗i (ω)}, we apply dominated convergence<br />
theorem <strong>to</strong> obtain<br />
lim<br />
λ↑ξt ∗(ω) D(ξ∗ , λ)(ω) = −E ( )<br />
π1 {Γ−Π(ξ ∗ )≥0} | F t (ω) for ξ<br />
∗i<br />
t (ω) ∈]0, λ i ],<br />
lim<br />
λ↓ξt ∗(ω) D(ξ∗ , λ)(ω) = E ( )<br />
π1 {Γ−Π(ξ ∗ )>0} | F t (ω) for ξ<br />
∗i<br />
t (ω) ∈ [0, λ i [.<br />
Now (15) gives<br />
E ( π1 {Γ−Π(ξ ∗ )≥0} | F t<br />
)<br />
= E<br />
(<br />
π1{Γ−Π(ξ ∗ )>0} | F t<br />
)<br />
= A<br />
∗<br />
t<br />
20
which with (40) implies that the following inclusions hold almost surely: Calculating<br />
left limit λ ↑ ξ i t(ω), we have<br />
{ξ ∗i<br />
t ∈]0, λ i ]} ⊆ {A ∗ t − E i t ≥ 0} ⇔ {A ∗ t − E i t < 0} ⊆ {ξ ∗i<br />
t = 0} (41)<br />
For the right limit λ ↓ ξ i t(ω), we obtain<br />
{ξ ∗i<br />
t ∈ [0, λ i [} ⊆ {A ∗ t − E i t ≤ 0} ⇔ {A ∗ t − E i t > 0} ⊆ {ξ ∗i<br />
t = λ i }. (42)<br />
The assertions (41) and (42) give (35) and (36) respectively.<br />
Finally, it remains <strong>to</strong> show the existence of the solution <strong>to</strong> the global optimization<br />
problem (14) formulated in the Proposition 1.<br />
Proof. Let us utilize techniques from functional analysis. First, note that L N 1 ,<br />
equipped with the norm<br />
T∑<br />
−1 N∑<br />
‖Ξ‖ = E(|Ξ i t|)<br />
t=0 i=1<br />
is a Banach space with dual L N ∞ . The canonical bilinear form is<br />
〈Ξ, ξ〉 :=<br />
T∑<br />
−1<br />
t=0 i=1<br />
N∑<br />
E(Ξ i tξt) i Ξ ∈ L N 1 , ξ ∈ L N ∞.<br />
Next, we consider the weak <strong>to</strong>pology σ(L N ∞, L N 1 ) on LN ∞ (see [12]). Note that<br />
in this <strong>to</strong>pology, the neighborhood basis of a point ξ ∈ L N ∞ is given by all finite<br />
intersections of sets<br />
B ξ (Ξ, δ) := {ξ ′ ∈ L N ∞ : |〈Ξ, ξ ′ − ξ〉| < δ}, Ξ ∈ L N 1 , δ > 0. (43)<br />
In other words, σ(L N ∞, L N 1 ) is the weakest <strong>to</strong>pology for which any linear functional<br />
L N ∞ → R, ξ ↦→ 〈Ξ, ξ〉, Ξ ∈ L N 1 (44)<br />
is continuous. A function f : L N ∞ → R is lower semicontinuous at ξ if for each<br />
ε > 0 there exist a neighborhood B ξ of ξ such that f(ξ ′ ) > f(ξ) − ε for all<br />
ξ ′ ∈ B ξ , the function is called lower semicontinuous, if it is lower semicontinuous<br />
at each point. This generalization of continuity is useful since lower semicontinuous<br />
functions attain their minima on compact sets. We use this property <strong>to</strong> show the<br />
existence of ξ ∗ , being a minimizer of ξ ↦→ E(−G(ξ)) on U . To proceed so, we need<br />
<strong>to</strong> prove that ξ ↦→ E(−G(ξ)) is lower semicontinuous with respect <strong>to</strong> σ(L N ∞, L N 1 ).<br />
Given ξ ∈ L N ∞ , write<br />
E(−G(ξ)) =<br />
T∑<br />
−1<br />
t=0 i=1<br />
N∑<br />
E(Etξ i t) i + πE((Γ − Π(ξ)) + ).<br />
21
Since the first term is a continuous linear functional of the type (44) (evaluated at<br />
ξ ), it suffices <strong>to</strong> discuss the lower semicontinuity of the remaining expression<br />
ξ ↦→ E((Γ − Π(ξ)) + ).<br />
Fix the point ξ and consider for ξ ′ ∈ L N ∞ the estimate<br />
thus<br />
(Γ − Π(ξ ′ )) + ≥ (Γ − Π(ξ ′ ))1 {Γ−Π(ξ)≥0}<br />
≥ (Γ − Π(ξ))1 {Γ−Π(ξ)≥0} − (Π(ξ ′ ) − Π(ξ))1 {Γ−Π(ξ)≥0}<br />
≥ (Γ − Π(ξ)) + − (Π(ξ ′ ) − Π(ξ))1 {Γ−Π(ξ)≥0} ,<br />
E((Γ − Π(ξ ′ )) + ) ≥ E((Γ − Π(ξ)) + ) − E((Π(ξ ′ ) − Π(ξ))1 {Γ−Π(ξ)≥0} )<br />
≥ E((Γ − Π(ξ)) + ) − |〈Ξ, ξ ′ − ξ〉| (45)<br />
where Ξ ∈ L N 1 is given by Ξ i t = E(1 {Γ−Π(ξ)≥0} |F t ) for all i = 1, . . . , N and<br />
t = 0, . . . , T − 1. Hence, given ε, define the neighborhood B ξ (Ξ, ε) of ξ as in (43)<br />
which ensures that |〈Ξ, ξ ′ − ξ〉| < ε for all ξ ∈ B ξ (Ξ, ε) and finally with (45) yields<br />
the lower semicontinuity<br />
E((Γ − Π(ξ ′ )) + ) ≥ E((Γ − Π(ξ)) + ) − ε for all ξ ′ ∈ B ξ (Ξ, ε).<br />
Let now (ξ(n)) n∈N ⊂ U be a sequence <strong>approach</strong>ing the infimum<br />
lim E(−G T (ξ(n))) = inf E(−G T (ξ)).<br />
n→∞ ξ∈U<br />
By the theorem of Banach–Alaoglu, it contains a subsequence (ξ(n k )) k∈N which<br />
converges <strong>to</strong> ξ ∗ in the weak <strong>to</strong>pology. Since U is convex and norm-closed in L N ∞ ,<br />
it is also weakly closed, hence ξ ∗ ∈ U . Moreover, the semicontinuity ensures that<br />
E(−G T (ξ ∗ )) = inf ξ∈U E(−G T (ξ)).<br />
4.2 Parameters of fuel switch <strong>price</strong> process<br />
The present estimation is based on a series of n = 758 daily observations<br />
(E(t∆)(ω)) n t=1<br />
(where ∆ = 1/253 corresponds <strong>to</strong> one day), which are shown in the Figure 3. The<br />
deterministic harmonics (20) in the fuel switch <strong>price</strong> process are identified with<br />
parameters (23) obtained from peaks in the Fourier transform. After removing the<br />
deterministic part (P (t · ∆)(ω)) n t=1 (red line in this figure) the residual component<br />
X(t∆)(ω) = E(t∆)(ω) − P (t∆)(ω), t = 1, . . . , n (46)<br />
22
40<br />
30<br />
20<br />
10<br />
∆X<br />
0<br />
-10<br />
-20<br />
-30<br />
-40<br />
-20 -15 -10 -5 0 5 10 15 20<br />
X<br />
Figure 9: Scatter plot of (Y (t∆)(ω), X(t∆)(ω)) n−1<br />
t=1 calculated by (49) and<br />
based on his<strong>to</strong>rical fuel switch <strong>price</strong>s from the Figure 3. The straight line<br />
depicts the estimated linear regression.<br />
is modeled as a realization of the Ornstein-Uhlenbeck process (21) whose parameters<br />
γ, α, σ are estimated from the data (46) by a standard linear regression<br />
method applied as follows: From the formulas for conditional mean and variance<br />
we obtain the regression<br />
E(X(t)|F s ) = X(s)e −γ(t−s) + α(1 − e −γ(t−s) ) s ≤ t (47)<br />
Var(X(t)|F s ) = σ2<br />
2γ (1 − e−2γ(t−s) ) s ≤ t (48)<br />
Y (t∆) := X((t + 1)∆) − X(t∆) = β 0 + β 1 X(t∆) + β 2 ɛ t t = 1, . . . , n − 1 (49)<br />
where (ɛ t ) n−1<br />
t=1 are independent, standard Gaussian random variables and β 0, β 1 , β 2<br />
are connected <strong>to</strong> α, γ, σ by<br />
α = − β 0<br />
β 1<br />
γ = − 1 ∆ ln(1 + β 1)<br />
√<br />
2γβ2<br />
σ =<br />
1 − e −2γ∆<br />
The Figure 9 shows the plot of (Y (t∆)(ω), X(t∆)(ω)) t=1 n−1 , where the maximum<br />
likelihood parameter estimate gave β 0 = −0.0147, β 1 = −0.1182, β 2 = 16.2708<br />
from which we have calculated the original parameters α, β, σ displayed in (22).<br />
23
References<br />
[1] O. Bahn, B. Büler, S. Kypreos, and H.-J. Lüthi. Modelling an international<br />
market of co 2 emission permits. Int. J. of Global Energy Issues, 12(1-6):283–<br />
291, 1997.<br />
[2] B. Bueler. Solving an equilibrium model for trade of co 2 emission permits.<br />
European Journal of Operational Research, 102(2):393–403, 1997.<br />
[3] M. Cronshaw and J. B. Kruse. Regulated firms in pollution permit markets<br />
with banking. Journal of Regula<strong>to</strong>ry Economics, 9(2):179–89, 1996.<br />
[4] J. H. Dales. Pollution, Property and Prices. University of Toron<strong>to</strong> Press,<br />
Toron<strong>to</strong>, 1968.<br />
[5] H. L. Feng and J. Zhao. Alternative intertemporal permit trading regimes<br />
with s<strong>to</strong>chastic abatement costs. Resource and Energy Economics, 28(1):24–<br />
40, 2006.<br />
[6] A. Haurie and L. Viguier. A s<strong>to</strong>chastic dynamic game of <strong>carbon</strong> emissions<br />
trading. Environmental Modeling and Assessment, 8(3):239–248, 2003.<br />
[7] P. L. Joskow, R. B. Schmalensee, and E. Bailey. The market for sulfur dioxide<br />
emissions. The American Economic Review, 88(4):669–685, 1998.<br />
[8] P. Leiby and J. Rubin. Intertemporal permit trading for the control of greenhouse<br />
gas emissions. Environmental and Resource Economics, 19(3):229–256,<br />
2001.<br />
[9] J. Lemming. Financial <strong>risk</strong>s for green electricity inves<strong>to</strong>rs and producers in a<br />
tradable green certificate market. Energy Policy, 31(1):21–32, 2003.<br />
[10] W. D. Montgomery. Markets in licenses and efficient pollution control programs.<br />
Journal of Economic Theory, 5(3):395–418, 1972.<br />
[11] S. Pickl. Optimization of the tem-model co-funding and joint international<br />
emissions trading. Preprint, 2000.<br />
[12] A.P. Robertson and W.S. Robertson. Topological vec<strong>to</strong>r spaces. Cambridge<br />
Univ. Press, 1973.<br />
[13] J. Rubin. A model of intertemporal emission trading, banking and borrowing.<br />
Journal of Environmental Economics and Management, 31(3):269–286, 1996.<br />
[14] S. M. Schennach. The economics of pollution permit banking in the context<br />
of title iv of the 1990 clean air act amendments. Journal of Environmental<br />
Economics and Management, 40(3):189–21, 2000.<br />
24
[15] J. Seifert, M. Uhrig-Homburg, and M. Wagner. Dynamic behavior of <strong>carbon</strong><br />
spot <strong>price</strong>s .theory and empirical evidence. Preprint, 2006.<br />
[16] T. Tietenberg. Environmental Natural and Resource Economics. Addison<br />
Wesley, Bos<strong>to</strong>n, 2003.<br />
[17] F. Wirl. Consequences of irreversibilities on optimal intertemporal co 2 emission<br />
policies under uncertainty. Resource and Energy Economics, 28(2):105–<br />
123, 2006.<br />
25