A quantitative approach to carbon price risk modeling - CiteSeerX
A quantitative approach to carbon price risk modeling - CiteSeerX
A quantitative approach to carbon price risk modeling - CiteSeerX

Create successful ePaper yourself
Turn your PDF publications into a flip-book with our unique Google optimized e-Paper software.
70<br />
60<br />
50<br />
40<br />
Euro/MWh<br />
30<br />
20<br />
10<br />
0<br />
-10<br />
-20<br />
01/01/03 07/01/03 01/01/04 07/01/04 01/01/05 07/01/05<br />
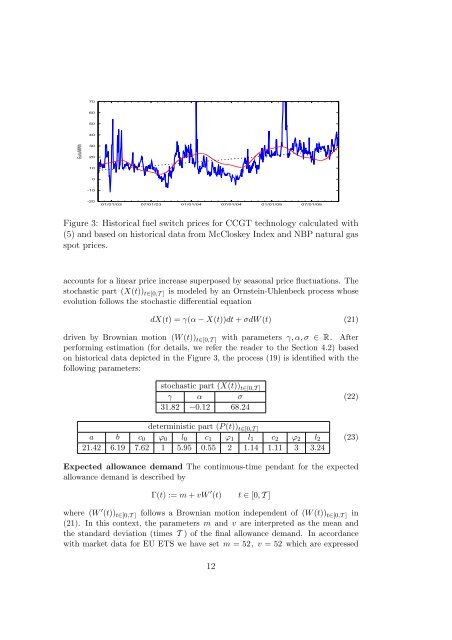
Figure 3: His<strong>to</strong>rical fuel switch <strong>price</strong>s for CCGT technology calculated with<br />
(5) and based on his<strong>to</strong>rical data from McCloskey Index and NBP natural gas<br />
spot <strong>price</strong>s.<br />
accounts for a linear <strong>price</strong> increase superposed by seasonal <strong>price</strong> fluctuations. The<br />
s<strong>to</strong>chastic part (X(t)) t∈[0,T ] is modeled by an Ornstein-Uhlenbeck process whose<br />
evolution follows the s<strong>to</strong>chastic differential equation<br />
dX(t) = γ(α − X(t))dt + σdW (t) (21)<br />
driven by Brownian motion (W (t)) t∈[0,T ] with parameters γ, α, σ ∈ R. After<br />
performing estimation (for details, we refer the reader <strong>to</strong> the Section 4.2) based<br />
on his<strong>to</strong>rical data depicted in the Figure 3, the process (19) is identified with the<br />
following parameters:<br />
s<strong>to</strong>chastic part (X(t)) t∈[0,T ]<br />
γ α σ<br />
31.82 −0.12 68.24<br />
(22)<br />
deterministic part (P (t)) t∈[0,T ]<br />
a b c 0 ϕ 0 l 0 c 1 ϕ 1 l 1 c 2 ϕ 2 l 2<br />
21.42 6.19 7.62 1 5.95 0.55 2 1.14 1.11 3 3.24<br />
(23)<br />
Expected allowance demand The continuous-time pendant for the expected<br />
allowance demand is described by<br />
Γ(t) := m + vW ′ (t) t ∈ [0, T ]<br />
where (W ′ (t)) t∈[0,T ] follows a Brownian motion independent of (W (t)) t∈[0,T ] in<br />
(21). In this context, the parameters m and v are interpreted as the mean and<br />
the standard deviation (times T ) of the final allowance demand. In accordance<br />
with market data for EU ETS we have set m = 52, v = 52 which are expressed<br />
12