A quantitative approach to carbon price risk modeling - CiteSeerX
A quantitative approach to carbon price risk modeling - CiteSeerX
A quantitative approach to carbon price risk modeling - CiteSeerX
Create successful ePaper yourself
Turn your PDF publications into a flip-book with our unique Google optimized e-Paper software.
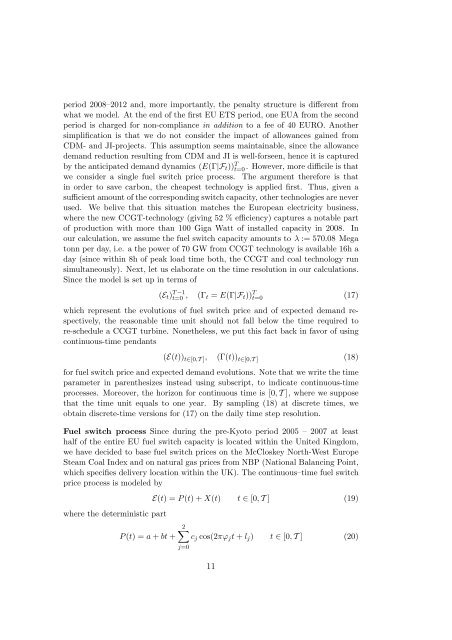
period 2008–2012 and, more importantly, the penalty structure is different from<br />
what we model. At the end of the first EU ETS period, one EUA from the second<br />
period is charged for non-compliance in addition <strong>to</strong> a fee of 40 EURO. Another<br />
simplification is that we do not consider the impact of allowances gained from<br />
CDM- and JI-projects. This assumption seems maintainable, since the allowance<br />
demand reduction resulting from CDM and JI is well-forseen, hence it is captured<br />
by the anticipated demand dynamics (E(Γ|F t )) T t=0 . However, more difficile is that<br />
we consider a single fuel switch <strong>price</strong> process. The argument therefore is that<br />
in order <strong>to</strong> save <strong>carbon</strong>, the cheapest technology is applied first. Thus, given a<br />
sufficient amount of the corresponding switch capacity, other technologies are never<br />
used. We belive that this situation matches the European electricity business,<br />
where the new CCGT-technology (giving 52 % efficiency) captures a notable part<br />
of production with more than 100 Giga Watt of installed capacity in 2008. In<br />
our calculation, we assume the fuel switch capacity amounts <strong>to</strong> λ := 570.08 Mega<br />
<strong>to</strong>nn per day, i.e. a the power of 70 GW from CCGT technology is available 16h a<br />
day (since within 8h of peak load time both, the CCGT and coal technology run<br />
simultaneously). Next, let us elaborate on the time resolution in our calculations.<br />
Since the model is set up in terms of<br />
(E t ) T −1<br />
t=0 , (Γ t = E(Γ|F t )) T t=0 (17)<br />
which represent the evolutions of fuel switch <strong>price</strong> and of expected demand respectively,<br />
the reasonable time unit should not fall below the time required <strong>to</strong><br />
re-schedule a CCGT turbine. Nonetheless, we put this fact back in favor of using<br />
continuous-time pendants<br />
(E(t)) t∈[0,T ] , (Γ(t)) t∈[0,T ] (18)<br />
for fuel switch <strong>price</strong> and expected demand evolutions. Note that we write the time<br />
parameter in parenthesizes instead using subscript, <strong>to</strong> indicate continuous-time<br />
processes. Moreover, the horizon for continuous time is [0, T ], where we suppose<br />
that the time unit equals <strong>to</strong> one year. By sampling (18) at discrete times, we<br />
obtain discrete-time versions for (17) on the daily time step resolution.<br />
Fuel switch process Since during the pre-Kyo<strong>to</strong> period 2005 – 2007 at least<br />
half of the entire EU fuel switch capacity is located within the United Kingdom,<br />
we have decided <strong>to</strong> base fuel switch <strong>price</strong>s on the McCloskey North-West Europe<br />
Steam Coal Index and on natural gas <strong>price</strong>s from NBP (National Balancing Point,<br />
which specifies delivery location within the UK). The continuous–time fuel switch<br />
<strong>price</strong> process is modeled by<br />
where the deterministic part<br />
P (t) = a + bt +<br />
E(t) = P (t) + X(t) t ∈ [0, T ] (19)<br />
2∑<br />
c j cos(2πϕ j t + l j ) t ∈ [0, T ] (20)<br />
j=0<br />
11


