A quantitative approach to carbon price risk modeling - CiteSeerX
A quantitative approach to carbon price risk modeling - CiteSeerX
A quantitative approach to carbon price risk modeling - CiteSeerX

You also want an ePaper? Increase the reach of your titles
YUMPU automatically turns print PDFs into web optimized ePapers that Google loves.
Let us summarize our findings. The allowance <strong>price</strong> should be significantly correlated<br />
<strong>to</strong> the expected long term fuel <strong>price</strong>s and <strong>to</strong> the expected need for emission<br />
reduction amount. That are the main <strong>price</strong> drives, since the remaining fac<strong>to</strong>rs<br />
(recent fuel switch <strong>price</strong>s, their volatility, uncertainty on the required emission<br />
reduction amount) have a minor effect on the <strong>carbon</strong> <strong>price</strong> formation.<br />
*<br />
A 0<br />
*<br />
A 0<br />
40<br />
35<br />
30<br />
40<br />
40<br />
35<br />
35<br />
30<br />
25<br />
20<br />
25<br />
20<br />
15<br />
10<br />
5<br />
35<br />
30<br />
25<br />
20<br />
30<br />
25<br />
20<br />
15<br />
10<br />
5<br />
15<br />
0<br />
15<br />
0<br />
10<br />
10<br />
5<br />
5<br />
0<br />
90<br />
70<br />
50<br />
σ 2 /(2γ)<br />
30<br />
10<br />
-10<br />
10<br />
30<br />
70<br />
50<br />
∑<br />
E( E s )/T<br />
s<br />
0<br />
50<br />
40<br />
30<br />
v<br />
20<br />
10<br />
-40<br />
0<br />
40<br />
120<br />
80<br />
Γ 0 /(λT)<br />
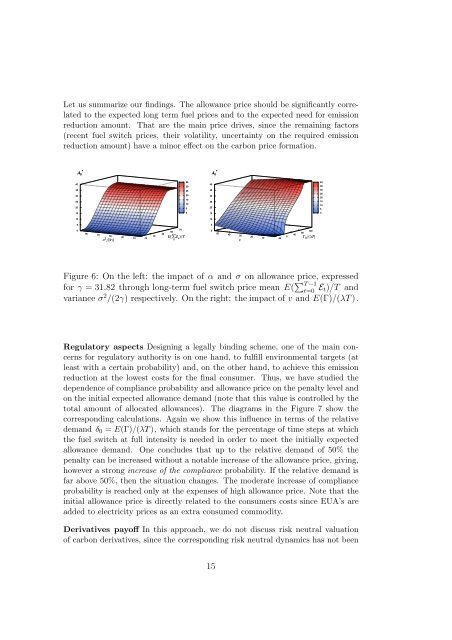
Figure 6: On the left: the impact of α and σ on allowance <strong>price</strong>, expressed<br />
for γ = 31.82 through long-term fuel switch <strong>price</strong> mean E( ∑ T −1<br />
t=0 E t)/T and<br />
variance σ 2 /(2γ) respectively. On the right: the impact of v and E(Γ)/(λT ).<br />
Regula<strong>to</strong>ry aspects Designing a legally binding scheme, one of the main concerns<br />
for regula<strong>to</strong>ry authority is on one hand, <strong>to</strong> fulfill environmental targets (at<br />
least with a certain probability) and, on the other hand, <strong>to</strong> achieve this emission<br />
reduction at the lowest costs for the final consumer. Thus, we have studied the<br />
dependence of compliance probability and allowance <strong>price</strong> on the penalty level and<br />
on the initial expected allowance demand (note that this value is controlled by the<br />
<strong>to</strong>tal amount of allocated allowances). The diagrams in the Figure 7 show the<br />
corresponding calculations. Again we show this influence in terms of the relative<br />
demand δ 0 = E(Γ)/(λT ), which stands for the percentage of time steps at which<br />
the fuel switch at full intensity is needed in order <strong>to</strong> meet the initially expected<br />
allowance demand. One concludes that up <strong>to</strong> the relative demand of 50% the<br />
penalty can be increased without a notable increase of the allowance <strong>price</strong>, giving,<br />
however a strong increase of the compliance probability. If the relative demand is<br />
far above 50%, then the situation changes. The moderate increase of compliance<br />
probability is reached only at the expenses of high allowance <strong>price</strong>. Note that the<br />
initial allowance <strong>price</strong> is directly related <strong>to</strong> the consumers costs since EUA’s are<br />
added <strong>to</strong> electricity <strong>price</strong>s as an extra consumed commodity.<br />
Derivatives payoff In this <strong>approach</strong>, we do not discuss <strong>risk</strong> neutral valuation<br />
of <strong>carbon</strong> derivatives, since the corresponding <strong>risk</strong> neutral dynamics has not been<br />
15