Annual Report 2006 - Boehringer Ingelheim
Annual Report 2006 - Boehringer Ingelheim
Annual Report 2006 - Boehringer Ingelheim

Create successful ePaper yourself
Turn your PDF publications into a flip-book with our unique Google optimized e-Paper software.
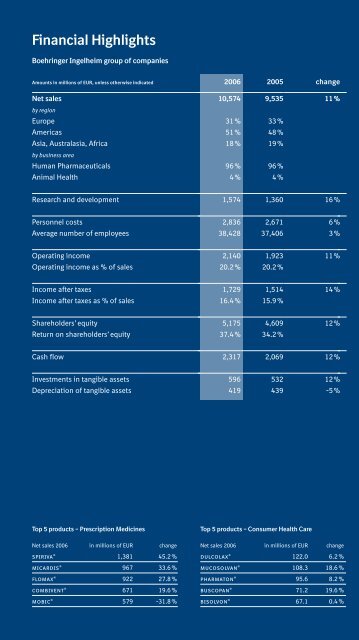
Financial Highlights<br />
<strong>Boehringer</strong> <strong>Ingelheim</strong> group of companies<br />
Amounts in millions of EUR, unless otherwise indicated <strong>2006</strong> 2005 change<br />
Net sales 10,574 9,535 11 %<br />
by region<br />
Europe 31 % 33 %<br />
Americas 51 % 48 %<br />
Asia, Australasia, Africa 18 % 19 %<br />
by business area<br />
Human Pharmaceuticals 96 % 96 %<br />
Animal Health 4 % 4 %<br />
Research and development 1,574 1,360 16 %<br />
Personnel costs 2,836 2,671 6 %<br />
Average number of employees 38,428 37,406 3 %<br />
Operating income 2,140 1,923 11 %<br />
Operating income as % of sales 20.2 % 20.2 %<br />
Income after taxes 1,729 1,514 14 %<br />
Income after taxes as % of sales 16.4 % 15.9 %<br />
Shareholders’ equity 5,175 4,609 12 %<br />
Return on shareholders’ equity 37.4 % 34.2 %<br />
Cash flow 2,317 2,069 12 %<br />
Investments in tangible assets 596 532 12 %<br />
Depreciation of tangible assets 419 439 -5 %<br />
Top 5 products — Prescription Medicines<br />
Net sales <strong>2006</strong> in millions of EUR change<br />
spiriva® 1,381 45.2 %<br />
micardis® 967 33.6 %<br />
flomax® 922 27.8 %<br />
combivent® 671 19.6 %<br />
mobic® 579 -31.8 %<br />
Top 5 products — Consumer Health Care<br />
Net sales <strong>2006</strong> in millions of EUR change<br />
dulcolax® 122.0 6.2 %<br />
mucosolvan® 108.3 18.6 %<br />
pharmaton® 95.6 8.2 %<br />
buscopan® 71.2 19.6 %<br />
bisolvon® 67.1 0.4 %