Annual Report 2006 - Boehringer Ingelheim
Annual Report 2006 - Boehringer Ingelheim
Annual Report 2006 - Boehringer Ingelheim

Create successful ePaper yourself
Turn your PDF publications into a flip-book with our unique Google optimized e-Paper software.
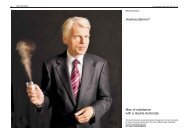
The pharmaceutical site in Shanghai, China,<br />
was presented with an award for its exemplary<br />
energy-saving efforts.<br />
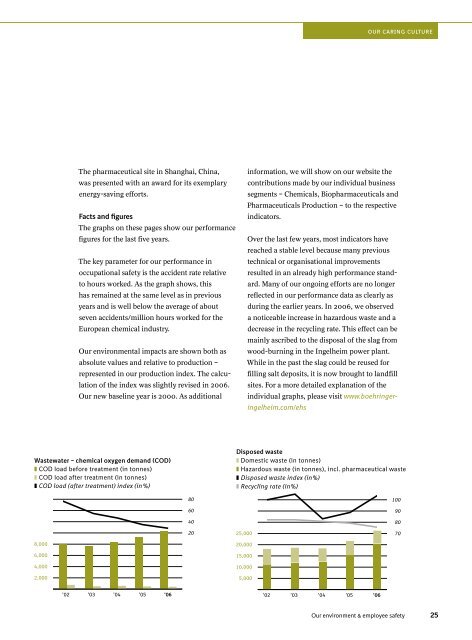
Facts and figures<br />
The graphs on these pages show our performance<br />
figures for the last five years.<br />
The key parameter for our performance in<br />
occupational safety is the accident rate relative<br />
to hours worked. As the graph shows, this<br />
has remained at the same level as in previous<br />
years and is well below the average of about<br />
seven accidents/million hours worked for the<br />
European chemical industry.<br />
Our environmental impacts are shown both as<br />
absolute values and relative to production –<br />
represented in our production index. The calcu-<br />
lation of the index was slightly revised in <strong>2006</strong>.<br />
Our new baseline year is 2000. As additional<br />
Wastewater — chemical oxygen demand (COD)<br />
■ COD load before treatment (in tonnes)<br />
■ COD load after treatment (in tonnes)<br />
■ COD load (after treatment) index (in %)<br />
8,000<br />
6,000<br />
4,000<br />
2,000<br />
’02 ’03 ’04 ’05 ’0<br />
80<br />
60<br />
40<br />
20<br />
25,000<br />
20,000<br />
15,000<br />
10,000<br />
5,000<br />
information, we will show on our website the<br />
contributions made by our individual business<br />
segments – Chemicals, Biopharmaceuticals and<br />
Pharmaceuticals Production – to the respective<br />
indicators.<br />
Over the last few years, most indicators have<br />
reached a stable level because many previous<br />
technical or organisational improvements<br />
resulted in an already high performance stand-<br />
ard. Many of our ongoing efforts are no longer<br />
reflected in our performance data as clearly as<br />
during the earlier years. In <strong>2006</strong>, we observed<br />
a noticeable increase in hazardous waste and a<br />
decrease in the recycling rate. This effect can be<br />
mainly ascribed to the disposal of the slag from<br />
wood-burning in the <strong>Ingelheim</strong> power plant.<br />
While in the past the slag could be reused for<br />
filling salt deposits, it is now brought to landfill<br />
sites. For a more detailed explanation of the<br />
individual graphs, please visit www.boehringer-<br />
ingelheim.com/ehs<br />
Disposed waste<br />
■ Domestic waste (in tonnes)<br />
■ Hazardous waste (in tonnes), incl. pharmaceutical waste<br />
■ Disposed waste index (in %)<br />
■ Recycling rate (in %)<br />
’02 ’03 ’04 ’05 ’06<br />
our caring culture<br />
100<br />
90<br />
80<br />
70<br />
Our environment & employee safety