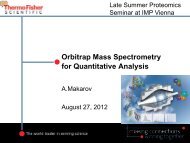
From Accurate Discovery to Targeted Quantitation - Peptide - IMP
From Accurate Discovery to Targeted Quantitation - Peptide - IMP
From Accurate Discovery to Targeted Quantitation - Peptide - IMP

Create successful ePaper yourself
Turn your PDF publications into a flip-book with our unique Google optimized e-Paper software.
<strong>From</strong> <strong>Accurate</strong> <strong>Discovery</strong> <strong>to</strong><br />
<strong>Targeted</strong> <strong>Quantitation</strong> - <strong>Peptide</strong><br />
Identification and <strong>Quantitation</strong><br />
Based on HR/AM Data<br />
27-Aug-2012, <strong>IMP</strong>/IMBA Workshop, Vienna<br />
Dr. Yue Xuan, Dr. Michaela Scigelova<br />
Thermo Fisher Scientific, Bremen, Germany<br />
1<br />
The world leader in serving science
2<br />
Bremen Fac<strong>to</strong>ry
Outline<br />
• <strong>From</strong> <strong>Discovery</strong> <strong>to</strong> <strong>Targeted</strong> Quan: A Complete Solution<br />
• Introduction of Q Exactive<br />
• Introduction of Proteome Discoverer 1.3<br />
• Introduction of Pinpoint 1.3<br />
• Walking through <strong>Discovery</strong>-<strong>to</strong>-<strong>Quantitation</strong> with an example study<br />
• Q Exactive recommended TopN experiment for Proteome <strong>Discovery</strong> Study<br />
• Guide through P.D. database search<br />
• Guide through Pinpoint for generating inclusion mass list<br />
• Q Exactive recommended targeted SIM (tSIM) experiment for <strong>Quantitation</strong> Study<br />
• Guide through Pinpoint for au<strong>to</strong>matic data process<br />
• Other <strong>Quantitation</strong> Experiments on Q Exactive<br />
• Full scan only<br />
• (multiplexed) <strong>Targeted</strong> HCD MS2 experiment<br />
• Data Independent Acquisition (DIA) experiment<br />
3
<strong>From</strong> <strong>Discovery</strong> <strong>to</strong> <strong>Targeted</strong> Quan: A Complete Solution<br />
Biomarker <strong>Discovery</strong><br />
High-resolution, informationrich<br />
data, Lower-throughput<br />
Database<br />
search<br />
LC-MS/MS<br />
Differential<br />
Expression<br />
Analysis<br />
Patient Samples<br />
LC-MS/MS<br />
Intelligent SRM<br />
Q Exactive<br />
List of candidate<br />
biomarkers<br />
<strong>Targeted</strong> Assay<br />
Development For<br />
Clinical Research<br />
Fast, high-throughput<br />
Sensitive, specific,<br />
targeted<br />
Robust, reproducible<br />
Cost-effective<br />
Final list of<br />
target<br />
proteins<br />
Refine<br />
Target<br />
List<br />
Pinpoint Software<br />
Refined list<br />
of target<br />
proteins<br />
4
Q Exactive - <strong>Discovery</strong>-<strong>to</strong>-<strong>Quantitation</strong> Flowchart<br />
• Target peptide ID<br />
• High speed<br />
• dd acquisition<br />
• Quan info<br />
• Proteome Discoverer<br />
• SIEVE<br />
• Target list<br />
• Low-level targets tSIM, tHCD<br />
• Other targets full MS<br />
• Au<strong>to</strong>mated quantification<br />
• Pinpoint<br />
5
Q Exactive<br />
6<br />
The world leader in serving science
Q Exactive TM - Innovations and Features<br />
First Bench<strong>to</strong>p Quadrupole-Orbitrap Mass Spectrometer<br />
HCD/C-Trap Combo Cell<br />
QUADRUPOLE MASS FILTER<br />
Mass Range: 50 – 6000 amu<br />
Precursor Isolation: 0.4 – 10 amu<br />
ORBITRAP<br />
Resolution: 140,000<br />
Mass Accuracy: < 3 ppm<br />
ION SOURCE<br />
S-Lens<br />
7
Q Exactive: S-Lens Assembly<br />
• Stepped RF-level for different<br />
mass ranges<br />
• Number of S-lens levels set<br />
according <strong>to</strong> mass range set.<br />
• 2-3x lower inject times overall<br />
Improved ion transmission<br />
8
High Sensitivity with Quadrupole-based SIM Scan<br />
Relative Abundance<br />
100<br />
80<br />
60<br />
40<br />
20<br />
0<br />
100<br />
80<br />
60<br />
40<br />
20<br />
195.0876<br />
N=248402.81<br />
195.0877<br />
N=20741.58<br />
Full MS<br />
S/N = 745<br />
SIM (10amu)<br />
S/N = 5400<br />
S/N (spectrum)<br />
6000<br />
5000<br />
4000<br />
3000<br />
2000<br />
1000<br />
0<br />
Gain in sensitivity (7x)<br />
Caffeine<br />
195.082195.084195.086195.088 195.09 195.092195.094<br />
0<br />
S/N (FMS)<br />
S/N (SIM10)<br />
Sensitivity Gain: 5 – 10 folds<br />
9
Improved Resolution – Advanced Signal Processing<br />
• Increases resolution by 2X at the same transient length<br />
160000<br />
Resolution<br />
140000<br />
120000<br />
100000<br />
80000<br />
60000<br />
40000<br />
20000<br />
0<br />
Exactive<br />
Q-Exactive<br />
0 5 10 15<br />
Scan Speed [Hz]<br />
Resolution<br />
at m/z 200<br />
Resolution<br />
at m/z 400<br />
Max. scan<br />
speed (Hz)<br />
17,500 12,500 12<br />
35,000 25,000 7<br />
70,000 50,000 3<br />
140,000 100,000 1.5<br />
10
Spectrum Multiplexing Principle<br />
Parallel Filling and Detection<br />
Spectrum Multiplexing<br />
Demonstration of 10-fold spectrum multiplexing<br />
20110503 JPH TargetSIM MSX10_110503181236 #40 RT: 0.34 AV: 1 NL: 1.35E8<br />
T: FTMS + ESI SIM msx ms [193.09-197.09, 260.64-264.64, 522.26-526.26, 1120.00-1124.00, 1219.99-1223.99, 1319.98-1323.98, 1419.98-1423.98, 1619.9 ...<br />
195.0876<br />
R=157606<br />
80<br />
60<br />
40<br />
20<br />
0<br />
Relative Abundance100<br />
262.6363<br />
R=133906<br />
524.2648<br />
R=93206<br />
1421.9758<br />
R=53006<br />
1621.9656<br />
R=47806<br />
1221.9862<br />
R=58406 1821.9543<br />
R=42104<br />
200 400 600 800 1000 1200 1400 1600 1800 2000<br />
m/z<br />
11<br />
See poster MP103 J.-P.Hauschild et al<br />
Multiple C-Trap Fills as a Tool for Massive Parallelization of Orbitrap Mass<br />
Spectrometry- a new Concept for <strong>Targeted</strong> Mass Analysis
Animation about Q Exactive<br />
12
http://plane<strong>to</strong>rbitrap.com/<br />
13
New EASY-Spray: Robust and Reproducible<br />
• Plug-and-spray simplicity<br />
• With state-of-the-art performance<br />
• Amazing peak capacity with coiled-up long<br />
columns<br />
• Outstanding reproducibility<br />
• Razor sharp peaks using nanoViper<br />
connections and zero dead-volume unions<br />
• Integrated Design<br />
• Complexity made simple<br />
• Robust performance <strong>to</strong> 1000 bar<br />
• Reliable spray with precision positioned glass<br />
emitters<br />
• Maximum reliability with integrated heating<br />
More details – Tuesday workshop<br />
6. Easy Nano Spray Source for Increased<br />
Performance nanoLC-MS with Plug-and-<br />
Spray Configuration<br />
14
<strong>From</strong> <strong>Discovery</strong> <strong>to</strong> targeted Quan<br />
15<br />
The world leader in serving science
Experimental Overview<br />
16
<strong>Discovery</strong><br />
• Strategies for discovery<br />
• Selecting a pathway<br />
• Finding differences<br />
• Spectral counting<br />
• Labeled quantitation<br />
− Precursor based: SILAC, di-methylation<br />
− Reporter based: TMT, iTRAQ<br />
• Label free<br />
17
Select a workflow<br />
18
Analyze data<br />
finding candidate proteins<br />
To <strong>Targeted</strong> Quantitiation<br />
19
20<br />
Proteome Discoverer 1.3
New features in Proteome Discoverer 1.3<br />
This release expands the workflow-based system for “deep sequencing”<br />
applications.<br />
1. Deep spectral data mining using Percola<strong>to</strong>r<br />
2. Confident site localization for phosphopeptides with phosphoRS<br />
3. Improved protein and peptide grouping<br />
4. Biological annotation<br />
5. 64 bit support (Windows XP and Windows 7)<br />
6. Graphics<br />
1. Proportionally scaling Venn Diagram<br />
2. Volcano plots<br />
3. Colorful pie charts<br />
New purchase includes 3 years maintenance, while upgrades from PD 1.2 and<br />
earlier get 1 year of maintenance for free<br />
• All core software upgrades free during maintenance period<br />
• Up-<strong>to</strong>-date biological annotation through ProteinCenter access<br />
21
Confidence: Deep data mining using Percola<strong>to</strong>r<br />
• Percola<strong>to</strong>r uses >30 features of a<br />
peptide spectral match (PSM) <strong>to</strong><br />
distinguish true positives from random<br />
matches<br />
• Result: more peptides and proteins<br />
identified with high confidence (1% FDR)<br />
• CID, HCD: >30% increase in PSM’s<br />
• ETD: Up <strong>to</strong> 80% increase in PSM’s<br />
ASMS 2011 Poster: MP25<br />
Breaking the 2000 proteins barrier in a<br />
standard LC run using a new bench<strong>to</strong>p<br />
Orbitrap instrument and multiple search<br />
engines. (download @ : http://portal.thermobrims.com)<br />
22<br />
Käll et al, Nature Methods 4:923-925 (2007)
PTM Localisation: Phospho-analysis Using PhosphoRS<br />
• Developed in collaboration with Karl Mechtler’s lab at <strong>IMP</strong> Vienna<br />
• Phosphorylation site confidence determination<br />
• is it phosphorylated?<br />
• site of phosphorylation?<br />
New protein identification details<br />
view compares identified PTM’s<br />
<strong>to</strong> those annotated by UniProt<br />
23
Annotation: Providing Biological Context Using ProteinCenter<br />
• 3 year support subscription includes ProteinCenter annotation node:<br />
• GO, protein family (Pfam), PTM, and ProteinCard annotation is au<strong>to</strong>matically<br />
retrieved and s<strong>to</strong>red in the PD result files<br />
• All can be filtered<br />
• Displayed in the PD Viewer<br />
• Previous results can be annotated or re-annotated<br />
Molecular Function Cellular Component Biological Process<br />
ASMS 2011 Poster: ThP22 401<br />
“Integration of a central protein reposi<strong>to</strong>ry in<strong>to</strong> a standard data processing application<br />
for mining proteomics data” (download @ : http://portal.thermo-brims.com )<br />
24
Example 1: Intelligent data analysis and reduction<br />
Complex data sets generated with hybrid instruments require optimized search<br />
strategies that are easily enabled in PD with cus<strong>to</strong>mized data analysis workflows<br />
CID, PQD,<br />
MSA & ETD<br />
HCD<br />
Workflow for Comprehensive Identification<br />
Using Multiple MS/MS Modes<br />
ETD<br />
HCD<br />
• All MS/MS modes<br />
supported<br />
• 3 search engines<br />
• Powerful workflow<br />
edi<strong>to</strong>r<br />
• Au<strong>to</strong>matic FDR<br />
calculation for<br />
measurement of peptide<br />
ID confidence<br />
25
Example 2: Robust quantification results<br />
Number of raw files 72<br />
Total file size (GB) 18.5<br />
Total number of MS2 spectra 893636<br />
• Excellent<br />
variability!<br />
• Summary of 3 replicates of 24 fractions of a<br />
HeLa experiment (raw files provided with<br />
the MaxQuant Software):<br />
• > 190,000 peptides at 1% FDR<br />
• 3560 protein groups; >12,000 proteins<br />
• 96.5% of peptides quantified<br />
26
Example 3: Graphical validation of results<br />
27
Example 4: Analysis of very large datasets<br />
Pre-filter large data sets for faster viewing of results<br />
Filter data before opening<br />
28
Example 5: Increased productivity through au<strong>to</strong>mation<br />
•Schedule Processing in<br />
Xcalibur<br />
Different workflows<br />
Exp 1, 5-8 Exp 2-4<br />
CID PQD ETD<br />
HCD<br />
LTQ Velos &<br />
LTQ Orbitrap<br />
Velos<br />
Daemon<br />
Au<strong>to</strong>mation<br />
•Transfer raw<br />
files and<br />
parameters <strong>to</strong><br />
data processing<br />
PC<br />
• Maximize workflow flexibility and labora<strong>to</strong>ry productivity.<br />
• Match scheduled data processing with high throughput data acquisition.<br />
• Acquire and process 24/7<br />
29
Example 6: Collaborate easily and share results quickly<br />
Viewer<br />
VIEWER is free!<br />
Viewer<br />
• Send files from any PC or instrument, process, and view results on any PC<br />
• Process batches of data from any computer<br />
• Analyze data as individual files or in single MudPIT file<br />
• Simplified data processing on centralized analysis computer<br />
• Handles larger, more data rich files resulting from faster scanning instruments<br />
30
Example 7: Publish results quickly and effortlessly<br />
• After extracting the content of the zip archive the index.html<br />
file can be opened in any web browser<br />
31
Thermo Scientific Proteomics Software Portal<br />
For more information about any of our Thermo Scientific Proteomics software<br />
products, please visit our new web portal, at: http://portal.thermo-brims.com/<br />
32
PinPoint<br />
33<br />
The world leader in serving science
Pinpoint – Main Features<br />
• Software package supporting targeted protein quantitation<br />
• Direct integration between discovery <strong>to</strong> quantitation through<br />
import of Sieve, Proteome Discoverer, and ProteinCenter<br />
output<br />
• Verification strategies <strong>to</strong> support all quan/qual applications<br />
• Robust retention time prediction approaches based on<br />
hydrophobicity fac<strong>to</strong>rs and peptide retention time calibration<br />
kit (PRTC)<br />
• Au<strong>to</strong>mated method refinement, also across various MS<br />
platforms<br />
• ROC analysis<br />
34
Pinpoint - Look and Feel<br />
Target Method Building<br />
Data Analysis/Verification<br />
35
http://portal.thermo-brims.com/<br />
36
Walking through <strong>Discovery</strong> – <strong>to</strong> -<br />
<strong>Quantitation</strong> based on HR/AM<br />
Data<br />
37<br />
The world leader in serving science
Protein Kinases and Inhibi<strong>to</strong>r Profiling<br />
Reasons <strong>to</strong> study protein kinase/drug interactions:<br />
•Protein kinases are commonly mutated or misregulated in<br />
cancer (e.g. Bcr-Abl in leukemia).<br />
•Numerous kinase inhibi<strong>to</strong>rs are approved drugs for the<br />
treatment of specific cancers with most binding <strong>to</strong> conserved<br />
ATP binding domain (e.g. Gleevec).<br />
•Need <strong>to</strong> evaluate kinase inhibi<strong>to</strong>r IC 50 and identify off-targets<br />
Difficulties <strong>to</strong> contend with:<br />
•Over 500 protein kinases are present in the human genome.<br />
•Large dynamic range for endogenous protein kinase levels in a<br />
complex matrix (whole cell lysate).<br />
•Enzymatic digestion results in peptides with varying<br />
sequences, sizes, and missed cleavages making it difficult for<br />
enrichment and targeted LC-MS strategies.<br />
38
Desthiobiotin-ATP and -ADP Active Site Probes<br />
Desthiobiotin-ATP<br />
NH 2<br />
O<br />
H<br />
N<br />
N<br />
H<br />
O<br />
O<br />
O<br />
P<br />
O -<br />
O<br />
O<br />
P<br />
O -<br />
O<br />
O<br />
P<br />
O -<br />
O<br />
N<br />
N<br />
O<br />
OH OH<br />
N<br />
N<br />
Desthiobiotin-ADP<br />
NH 2<br />
O<br />
H<br />
N<br />
N<br />
H<br />
O<br />
O<br />
O<br />
P<br />
O -<br />
O<br />
O<br />
P<br />
O -<br />
O<br />
OH<br />
O<br />
N<br />
N<br />
OH<br />
N<br />
N<br />
Tag<br />
Reactive<br />
Group<br />
Selectivity<br />
Group<br />
Patricelli, M. P., et al. Functional Interrogation of the Kinome using Nucleotide Acyl Phophates Biochem. 2007, 46(2), 350-8<br />
39
Study: <strong>Targeted</strong> Kinase Inhibi<strong>to</strong>r Profiling<br />
40
Q Exactive - <strong>Discovery</strong>-<strong>to</strong>-<strong>Quantitation</strong> Flowchart<br />
• ProteinID / <strong>Peptide</strong> ID<br />
• High speed<br />
• dd acquisition<br />
41
Methodolgy on Q Exactive for <strong>Discovery</strong> Proteomics<br />
- DDA + 10Hz HCD Scan<br />
• Parallel Filling and Detection<br />
• Fast Orbitrap Scanning<br />
• pAGC<br />
10 HR/AM HCD scans in 1s<br />
256ms<br />
64ms<br />
42
Typical Shotgun Proteomics on Q Exactive<br />
High Load<br />
>150ng on column<br />
Low Load<br />
< 150ng on column<br />
43
1 Full MS +10 HR/AM HCD Scans in One Second<br />
Ecoli_50min_newcolumn_Top10_15cm_reje...<br />
2/17/2011 3:39:42 PM<br />
RT: 15.8279 - 51.4773<br />
Relative Abundance<br />
100<br />
80<br />
60<br />
40<br />
20<br />
16.0095<br />
17.9024<br />
25.9001<br />
27.4920<br />
22.3863 25.7411<br />
27.1739<br />
30.4806<br />
33.0433<br />
30.9771<br />
35.5786<br />
39.1805<br />
38.7325<br />
20.3567<br />
23.9072 28.4175 49.3818<br />
18.7207 34.8784<br />
37.5942<br />
41.1998<br />
21.9561<br />
25.4406 43.4203<br />
34.7425 41.0942<br />
43.5925<br />
46.5441<br />
49.1418<br />
41.5779<br />
41.6221<br />
47.5177<br />
49.6742<br />
0<br />
16 18 20 22 24 26 28 30 32 34 36 38 40 42 44 46 48 50<br />
Time (min)<br />
RT: 32.2438 - 32.2701<br />
Relative Abundance<br />
0.3<br />
0.2<br />
0.1<br />
0.0<br />
0.3<br />
32.2447<br />
32.2464 32.2645<br />
∆ = 0.0181 min = 1.086 sec<br />
32.2512 32.2525 32.2538 32.2551 32.2564 32.2577 32.2590 32.2603 32.2616 32.2629 32.2694<br />
1 2 3 4 5 6 7 8 9 10<br />
0.2<br />
0.1<br />
0.0<br />
32.244 32.246 32.248 32.250 32.252 32.254 32.256 32.258 32.260 32.262 32.264 32.266 32.268 32.270<br />
Time (min)<br />
Ecoli_50min_newcolumn_Top10_15cm_reject_1 #12365 RT: 32.25 AV: 1 NL: 1.58E8<br />
T: FTMS + p NSI Full ms [300.00-2000.00]<br />
x2<br />
536.7949<br />
z=2<br />
100<br />
x5<br />
Relative Abundance<br />
80<br />
60<br />
40<br />
20<br />
0<br />
4<br />
329.2184<br />
z=2<br />
382.9046<br />
z=3<br />
392.7555<br />
z=2<br />
6<br />
419.2133<br />
z=3<br />
5<br />
445.7585<br />
z=2<br />
484.2459<br />
z=3<br />
505.2733<br />
z=2<br />
8<br />
575.8452<br />
z=2<br />
3<br />
551.8184<br />
z=2<br />
10<br />
581.9907<br />
z=3<br />
630.3730<br />
z=2<br />
664.3292<br />
z=2<br />
9<br />
700.3623<br />
z=2<br />
711.3712<br />
z=3<br />
7<br />
725.8647<br />
z=2<br />
1<br />
350 400 450 500 550 600 650 700 750 800 850 900 950 1000 1050 1100 1150<br />
m/z<br />
784.5037<br />
z=?<br />
835.3868<br />
z=2<br />
871.9796<br />
z=2<br />
902.8879<br />
z=2<br />
950.9638<br />
z=2<br />
2<br />
1008.5358<br />
z=1<br />
1072.5819<br />
z=1<br />
1096.3795<br />
z=?<br />
1150.6826<br />
z=1<br />
1182.6012<br />
z=?<br />
44
Guide through P.D. database search<br />
1, Set up a workflow<br />
45
Guide through P.D. database search<br />
2, Open a .raw data file<br />
46
Guide through P.D. database search<br />
3, Set the search parameters (example via Mascot)<br />
47
Guide through P.D. database search<br />
4, Submit the search<br />
48
Guide through P.D. database search<br />
5, P.D. result .msf file, select “Desthiobiotin” modification<br />
49
Q Exactive - <strong>Discovery</strong>-<strong>to</strong>-<strong>Quantitation</strong> Flowchart<br />
• Target list<br />
• tSIM, tHCD<br />
50
Guide through Pinpoint for generating inclusion mass list<br />
1, Add Protein (<strong>From</strong> Spectral Library)<br />
51
Guide through Pinpoint for generating inclusion mass list<br />
2, Add/Edit Modifications<br />
SIM Quan on Precursor<br />
52
Guide through Pinpoint for generating inclusion mass list<br />
3, export inclusion mass list<br />
53
Q Exactive - <strong>Discovery</strong>-<strong>to</strong>-<strong>Quantitation</strong> Flowchart<br />
• <strong>Targeted</strong> experiments on Q Exactive<br />
• tSIM, tHCD<br />
• Au<strong>to</strong>mated quantification<br />
• Pinpoint<br />
54
Profiling Staurosporine Kinase Inhibition in A549 Cells<br />
Multiplex SIM (msxSIM) <strong>Targeted</strong> Quantification Workflow<br />
0.00 µM<br />
XICs<br />
IC50 Curves<br />
0.01 µM<br />
0.10 µM<br />
0.30 µM<br />
1.00µM<br />
3.00 µM<br />
10.00 µM<br />
The cell lysate was incubated<br />
with different levels of kinase<br />
inhibi<strong>to</strong>r, Kinase- enriched,<br />
tryptic digested and analyzed<br />
using targeted msxSIM.<br />
Data was processed and<br />
statistics calculated by<br />
Pinpoint 1.2.<br />
IC50 curve for each<br />
kinase was generated<br />
based on the relative<br />
quantification results.<br />
*Thermo Scientific Pierce ActivX Probes and Enzyme Enrichment Kits<br />
55
<strong>Quantitation</strong> on Precursor ion – targeted multiplex SIM<br />
1. Selection of targeted precursor ion in the quadrupole<br />
2. Accumulation in C-trap<br />
• In multiplexing mode, step 1 and 2 are repeated <strong>to</strong> accumulate multiple precursors<br />
before orbitrap measurement.<br />
3. Transfer of ions <strong>to</strong> orbitrap for detection. In multiplexing mode, multiple<br />
precursors isolated separately are measured <strong>to</strong>gether.<br />
SIM → High S/N ratio<br />
Multiplexing SIM → High Speed<br />
56
<strong>Quantitation</strong> on Precursor ion – targeted multiplex SIM<br />
R: 35K R: 70K<br />
R: 140K<br />
492.2634<br />
492.2665<br />
492.2495<br />
492.2511<br />
492.2661<br />
30ppm<br />
m/z<br />
High Resolution → Selectivity<br />
<strong>Accurate</strong> Mass → Accuracy<br />
57
<strong>Targeted</strong> SIM (tSIM) Experiments on Q Exactive<br />
inclusion list from Pinpoint can be directly imported in<strong>to</strong> Method edi<strong>to</strong>r!<br />
58
<strong>Targeted</strong> SIM (tSIM) Experiments on Q Exactive<br />
Example is multiplexed tSIM<br />
59
Examples of <strong>Targeted</strong> Kinase <strong>Peptide</strong>s<br />
Peak definition and selectivity<br />
RT: 43.39 - 45.66<br />
Relative Abundance<br />
100<br />
80<br />
60<br />
40<br />
20<br />
0<br />
100<br />
80<br />
60<br />
40<br />
20<br />
0<br />
100<br />
80<br />
60<br />
40<br />
20<br />
0<br />
43.41<br />
709.1611<br />
43.66<br />
835.4882<br />
43.66<br />
843.4794<br />
44.22<br />
835.4895<br />
44.20<br />
44.27<br />
835.4896<br />
44.32<br />
835.4898<br />
835.4894 44.36<br />
835.4896<br />
44.15<br />
835.4898 44.41<br />
44.10<br />
835.4895<br />
44.62<br />
835.4901<br />
835.4901<br />
44.10<br />
843.4764<br />
44.34<br />
709.1624<br />
44.29<br />
709.1623<br />
44.39<br />
709.1622<br />
44.46<br />
709.1624<br />
DTVTSELAAVkIVK ( Q12851 GCK)<br />
45.03<br />
835.4913<br />
NISHLDLkPQNILLSSLEKPHLK (Q6PHR2 ULK3)<br />
44.48<br />
709.1622<br />
44.53<br />
709.1624<br />
44.25<br />
709.1622 44.60<br />
709.1623 44.81<br />
709.1618<br />
44.20<br />
843.4753<br />
44.79<br />
843.4759<br />
44.72<br />
843.4758<br />
44.86<br />
843.4756<br />
44.69<br />
843.4758 44.88<br />
843.4756<br />
44.65<br />
843.4756<br />
45.16<br />
709.1624<br />
44.93<br />
843.4756 45.16<br />
843.4761<br />
43.5 44.0 44.5 45.0 45.5<br />
Time (min)<br />
DLkPSNIFLVDTK (P19525 PKR)<br />
45.64<br />
843.4785<br />
Resolution> 70K is required<br />
60
Guide through Pinpoint for au<strong>to</strong>matic data process<br />
1, import the .raw data files and group them<br />
61
Guide through Pinpoint for au<strong>to</strong>matic data process<br />
2, au<strong>to</strong>matic data processing<br />
62
Inhibi<strong>to</strong>r Titration for IC50 Value Determination<br />
GCK (Q12851)<br />
DTVTSELAAVkIVK<br />
835.4927 GCK(K1)<br />
709.1641 ULK3(K2)<br />
843.4797 PKR(K2)<br />
44 min 45 min<br />
GCK<br />
ULK3<br />
PKR<br />
100<br />
ULK3 (Q6PHR2)<br />
NISHLDLkPQNILLSSLEKPHLK<br />
% Kinase Inhibition<br />
80<br />
60<br />
40<br />
20<br />
0<br />
0.01 0.1 1 10<br />
Staurosporine, uM<br />
PKR (P19525)<br />
DLkPSNIFLVDTK<br />
Kinase<br />
IC 50 (µM)<br />
GCK(K1) 0.0062<br />
0 0.1 0.3 1 3 10<br />
µMStaurosporine<br />
ULK3(K2) 0.035<br />
63<br />
PKR(K2) 4.21
<strong>Targeted</strong> msxSIM and Western Blot Results Agree<br />
100<br />
% Kinase Inhibition<br />
80<br />
60<br />
40<br />
20<br />
0<br />
-20<br />
0.01 0.1 1 10<br />
Staurosporine, uM<br />
CDK5<br />
AurA<br />
RSK2(1)<br />
Erk1/2<br />
• Available result from Western blot<br />
for two of the kinases, Erk1/2 and<br />
Rsk2, agrees very well with the<br />
targeted msxSIM result.<br />
• Staurosporine has nearly no<br />
inhibition <strong>to</strong> Erk1/2.<br />
• At 0.1 µM, the inhibition <strong>to</strong> Rsk2<br />
was at least 70% inhibited.<br />
Rsk2<br />
Erk1/2<br />
0 0.01 0.03 0.1 0.3 1 3 10 µM Staurosporine<br />
64
Other <strong>Quantitation</strong><br />
Experiments on Q Exactive<br />
Yue Xuan<br />
65<br />
The world leader in serving science
Other <strong>Quantitation</strong> Experiments on Q Exactive<br />
• Full scan only<br />
• (multiplexed) <strong>Targeted</strong> HCD MS2 experiment<br />
• Data Independent Acquisition (DIA) experiment<br />
66
1, Full scan only (HR/AM, <strong>Quantitation</strong> on Precursor<br />
ion)<br />
• Pros<br />
• For middle <strong>to</strong> high<br />
concentrate<br />
analytes<br />
• Very easy <strong>to</strong> set up<br />
• Can moni<strong>to</strong>ring the<br />
entire<br />
chroma<strong>to</strong>graphic<br />
eluting peaks<br />
• Cons<br />
• For low abundant<br />
peptides with high<br />
complex matrix is<br />
not easy<br />
67
2, <strong>Quantitation</strong> on Product ion - targeted HCD (SRM-<br />
Like)<br />
1. Selection of targeted precursor ion in the quadrupole.<br />
2. Fragmentation in collision cell.<br />
3. Accumulation of fragment ions.<br />
4. Transfer of fragment ions <strong>to</strong> Orbitrap mass analyzer for detection.<br />
Multiplexed<br />
HCD MS2<br />
tHCD<br />
→ Sensitivity<br />
is experimental<br />
and Confirmation<br />
available!<br />
Pinpoint 1.3 is able <strong>to</strong> process the data!<br />
High Resolution → Selectivity<br />
<strong>Accurate</strong> Mass → Accuracy<br />
68
Example of setting up msx tHCD on Q Exactive<br />
69
Highly Selective, Fast and Sensitive<br />
10 amole of heavy peptides in 250 ng human CSF digest<br />
RT: 14.97 - 21.09<br />
Relative Abundance<br />
100<br />
80<br />
60<br />
40<br />
20<br />
15.72<br />
15.67<br />
15.74<br />
15.82<br />
15.85<br />
15.88<br />
15.96<br />
GPGEDFR<br />
394.193-633.3051<br />
Relative Abundance<br />
0<br />
100<br />
80<br />
60<br />
40<br />
20<br />
VAHTVAYLGK<br />
355.877-324.2350<br />
18.62<br />
18.67<br />
18.60<br />
18.57<br />
18.69<br />
18.55<br />
Relative Abundance<br />
0<br />
100<br />
80<br />
60<br />
40<br />
20<br />
YFQGYAR<br />
457.732-594.2989<br />
20.61<br />
20.58<br />
20.57<br />
20.54<br />
20.64<br />
20.65<br />
20.67<br />
0<br />
15.0 15.5 16.0 16.5 17.0 17.5 18.0 18.5 19.0 19.5 20.0 20.5 21.0<br />
Time (min)<br />
70
Low At<strong>to</strong>mole LOD, 4 Orders of Linear Dynamic<br />
Range<br />
Heavy-labeled peptides of<br />
eicosanoid pathway enzymes in 250 ng CSF digest.<br />
1E+09<br />
100000000<br />
160000000<br />
10000000<br />
140000000 1000000<br />
450000000<br />
400000000<br />
1E+09<br />
100000000<br />
10000000<br />
1000000<br />
Peak Area<br />
120000000<br />
100000000<br />
80000000<br />
60000000<br />
40000000<br />
100000<br />
10000<br />
1000<br />
1 10 100 1000 10000 100000<br />
y = 1372.1x + 278774<br />
R² = 0.9998<br />
VAHTVAYLGK<br />
Peak area<br />
350000000<br />
300000000<br />
250000000<br />
200000000<br />
150000000<br />
100000000<br />
100000<br />
10000<br />
1000<br />
1 10 100 1000 10000 100000<br />
y = 3820.1x + 578349<br />
R² = 0.9999<br />
YFQGYAR<br />
20000000<br />
50000000<br />
0<br />
0 20000 40000 60000 80000 100000 120000<br />
Sample amount (amole)<br />
0<br />
0 20000 40000 60000 80000 100000 120000<br />
Sample amount (amole)<br />
Protein <strong>Peptide</strong> LOQ (amole) LOD (amole)<br />
PTGDS GPGEDFR 25 8<br />
PTGS2 QFQYQNR 25 8<br />
PTGS1 LVLTVR 10 3<br />
HPGDS STLPFGK 25 8<br />
PTGES VAHTVAYLGK 30 10<br />
PTGIS FLNPDGSEK 50 17<br />
71<br />
TBXA1 SVADSVLFLR 100 33<br />
ALOX15 YTLEINVR 250 83<br />
ALOX12 LWEIIAR 500 167<br />
LTCS4 YFQGYAR 10 3
3, Data Independent Acquisition (DIA) experiment<br />
Multiplexed Data Independent<br />
Acquisition (DIA) for Comparative<br />
Proteomics<br />
• Jarrett D. Egertson1; Andreas Kuehn2; Gennifer Merrihew1; Nicholas Bateman3; Brendan MacLean1;<br />
Ying S. Ting1; Jesse D. Canterbury4; Markus Kellmann2; Vlad Zabrouskov4; Christine Wu3; Michael J.<br />
MacCoss1<br />
• 1University of Washing<strong>to</strong>n, Seattle, WA; 2Thermo Fisher Scientific, Bremen, Germany; 3University of<br />
Pittsburgh, Pittsburgh PA; 4Thermo Fisher Scientific, San Jose, CA<br />
72<br />
Poster: ThP26
Classical Data independent approach<br />
DIA lacks the specificity of DDA<br />
73
Multiplexed DIA<br />
100 4 m/z-wide windows = 400 m/z<br />
500 m/z<br />
900<br />
Scan 1<br />
74
Multiplexed DIA<br />
100 4 m/z-wide windows = 400 m/z<br />
500 m/z<br />
900<br />
Scan 1<br />
75
Multiplexed DIA<br />
100 4 m/z-wide windows = 400 m/z<br />
500 m/z<br />
900<br />
Scan 1<br />
Scan 2<br />
76
Multiplexed DIA<br />
100 4 m/z-wide windows = 400 m/z<br />
500 m/z<br />
900<br />
Scan 1<br />
Scan 2<br />
77
Multiplexed DIA<br />
100 4 m/z-wide windows = 400 m/z<br />
500 m/z<br />
900<br />
Scan 1<br />
Scan 2<br />
Scan 3<br />
78
Multiplexed DIA<br />
100 4 m/z-wide windows = 400 m/z<br />
500 m/z<br />
900<br />
Scan 1<br />
Scan 2<br />
Scan 3<br />
. . .<br />
Scan 20<br />
79
Multiplexed DIA<br />
100 4 m/z-wide windows = 400 m/z<br />
500 m/z<br />
900<br />
Scan 1<br />
Scan 2<br />
Scan 3<br />
. . .<br />
Scan 20<br />
80
Multiplexed DIA<br />
100 4 m/z-wide windows = 400 m/z<br />
500 m/z<br />
900<br />
Scan 1<br />
Scan 2<br />
Scan 3<br />
. . .<br />
Scan 20<br />
81
Multiplexed DIA<br />
100 4 m/z-wide windows = 400 m/z<br />
500 m/z<br />
900<br />
Scan 1<br />
Scan 2<br />
Scan 3<br />
. . .<br />
Scan 20<br />
Scan 21<br />
82
Multiplexed DIA<br />
100 4 m/z-wide windows = 400 m/z<br />
500 m/z<br />
900<br />
Scan 1<br />
Scan 2<br />
Scan 3<br />
. . .<br />
Scan 20<br />
Scan 21<br />
83
Multiplexed DIA<br />
100 4 m/z-wide windows = 400 m/z<br />
500 m/z<br />
900<br />
Scan 1<br />
Scan 2<br />
Scan 3<br />
. . .<br />
Scan 20<br />
Scan 21<br />
84
Multiplexed DIA<br />
100 4 m/z-wide windows = 400 m/z<br />
500 m/z<br />
900<br />
Scan 1<br />
Scan 2<br />
Scan 3<br />
. . .<br />
Scan 20<br />
Scan 21<br />
85
Demultiplexing<br />
Intensity<br />
m/z<br />
86
Demultiplexing<br />
Intensity<br />
87<br />
m/z
88<br />
Demultiplexing
Sensitivity Similar <strong>to</strong> MS1 Quantification<br />
Bovine proteins spiked in<strong>to</strong> S. cerevisiae lysate<br />
(soluble fraction)<br />
89
DIA experiment updates<br />
• DIA data can be multiplexed by mixing precursors prior <strong>to</strong><br />
fragment ion analysis<br />
• MSX de-multiplexing and isolation list export will be included<br />
in Skyline v1.3 (http://skyline.maccosslab.org)<br />
• Plan <strong>to</strong> implement DIA in<strong>to</strong> next instrument SW<br />
90
Summery<br />
• Thermo Fisher Complete Solution from ProteinID <strong>to</strong> <strong>Peptide</strong> Quan<br />
• Q Exactive<br />
• Proteome Discoverer 1.3<br />
• Pinpoint 1.3<br />
• Walking through <strong>Discovery</strong>-<strong>to</strong>-<strong>Quantitation</strong> with an example study<br />
• Q Exactive recommended TopN experiment for Proteome <strong>Discovery</strong> Study<br />
• Guide through P.D. database search<br />
• Guide through Pinpoint for generating inclusion mass list<br />
• Q Exactive recommended targeted SIM experiment for targeted <strong>Quantitation</strong> Study<br />
• Guide through Pinpoint for au<strong>to</strong>matic data process<br />
• Other <strong>Quantitation</strong> Experiments on Q Exactive<br />
• Full scan only<br />
• (mulitplexed) <strong>Targeted</strong> HCD MS2 experiment<br />
• Data Independent Acquisition (DIA) experiment<br />
91
Acknowledgements<br />
• Scott Peterman (Kinase experiments and Pinpoint part)<br />
• Rosa Viner (Kinase experiments)<br />
• Ryan Bomgarden (ActivX samples and data acquisition)<br />
• Bernard Delarghe (Proteome Discoverer slides)<br />
• Markus Kellmann (Q Exactive and DIA slides)<br />
• Claire Dauly (Example files)<br />
• Zhiqi Hao (tSIM and tHCD slides)<br />
92