Alfredo Dubra's PhD thesis - Imperial College London
Alfredo Dubra's PhD thesis - Imperial College London
Alfredo Dubra's PhD thesis - Imperial College London

Create successful ePaper yourself
Turn your PDF publications into a flip-book with our unique Google optimized e-Paper software.
6. Tear topography dynamics experiment<br />
0.25<br />
0.25<br />
0.2<br />
0.2<br />
RMS residual<br />
(mm)<br />
0.15<br />
0.1<br />
RMS (mm)<br />
0.15<br />
0.1<br />
0.05<br />
0.05<br />
0<br />
0 5 10 15 20 25<br />
time (s)<br />
0<br />
0 5 10 15 20 25<br />
time (s)<br />
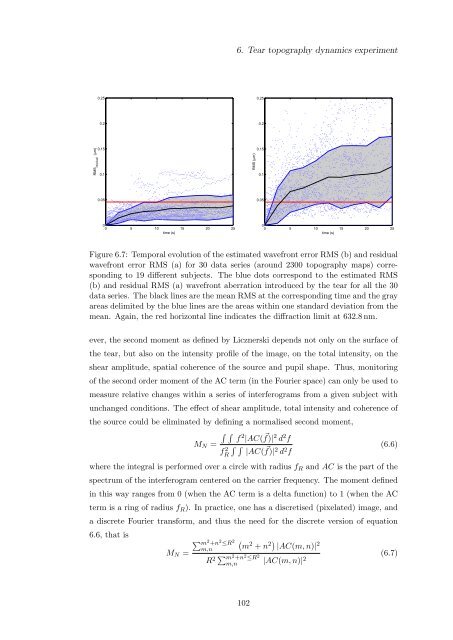
Figure 6.7: Temporal evolution of the estimated wavefront error RMS (b) and residual<br />
wavefront error RMS (a) for 30 data series (around 2300 topography maps) corresponding<br />
to 19 different subjects. The blue dots correspond to the estimated RMS<br />
(b) and residual RMS (a) wavefront aberration introduced by the tear for all the 30<br />
data series. The black lines are the mean RMS at the corresponding time and the gray<br />
areas delimited by the blue lines are the areas within one standard deviation from the<br />
mean. Again, the red horizontal line indicates the diffraction limit at 632.8 nm.<br />
ever, the second moment as defined by Licznerski depends not only on the surface of<br />
the tear, but also on the intensity profile of the image, on the total intensity, on the<br />
shear amplitude, spatial coherence of the source and pupil shape. Thus, monitoring<br />
of the second order moment of the AC term (in the Fourier space) can only be used to<br />
measure relative changes within a series of interferograms from a given subject with<br />
unchanged conditions. The effect of shear amplitude, total intensity and coherence of<br />
the source could be eliminated by defining a normalised second moment,<br />
∫ ∫<br />
f 2 |AC( f)|<br />
M N =<br />
⃗ 2 d 2 f<br />
fR 2 ∫ ∫<br />
|AC( f)| ⃗ 2 d 2 f<br />
(6.6)<br />
where the integral is performed over a circle with radius f R and AC is the part of the<br />
spectrum of the interferogram centered on the carrier frequency. The moment defined<br />
in this way ranges from 0 (when the AC term is a delta function) to 1 (when the AC<br />
term is a ring of radius f R ). In practice, one has a discretised (pixelated) image, and<br />
a discrete Fourier transform, and thus the need for the discrete version of equation<br />
6.6, that is<br />
M N =<br />
∑ m 2 +n 2 ≤R 2<br />
m,n<br />
(<br />
m 2 + n 2) |AC(m, n)| 2<br />
R 2 ∑ m 2 +n 2 ≤R 2<br />
m,n<br />
|AC(m, n)| 2 (6.7)<br />
102