Alfredo Dubra's PhD thesis - Imperial College London
Alfredo Dubra's PhD thesis - Imperial College London
Alfredo Dubra's PhD thesis - Imperial College London

Create successful ePaper yourself
Turn your PDF publications into a flip-book with our unique Google optimized e-Paper software.
2. Lateral shearing interferometer design<br />
f AC<br />
max<br />
f DC<br />
max<br />
f c<br />
f sampling<br />
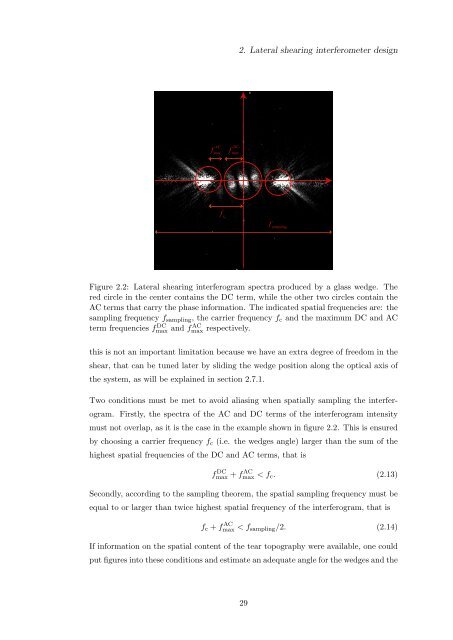
Figure 2.2: Lateral shearing interferogram spectra produced by a glass wedge. The<br />
red circle in the center contains the DC term, while the other two circles contain the<br />
AC terms that carry the phase information. The indicated spatial frequencies are: the<br />
sampling frequency f sampling , the carrier frequency f c and the maximum DC and AC<br />
term frequencies fmax DC and fmax AC respectively.<br />
this is not an important limitation because we have an extra degree of freedom in the<br />
shear, that can be tuned later by sliding the wedge position along the optical axis of<br />
the system, as will be explained in section 2.7.1.<br />
Two conditions must be met to avoid aliasing when spatially sampling the interferogram.<br />
Firstly, the spectra of the AC and DC terms of the interferogram intensity<br />
must not overlap, as it is the case in the example shown in figure 2.2. This is ensured<br />
by choosing a carrier frequency f c (i.e. the wedges angle) larger than the sum of the<br />
highest spatial frequencies of the DC and AC terms, that is<br />
f DC<br />
max + f AC<br />
max < f c . (2.13)<br />
Secondly, according to the sampling theorem, the spatial sampling frequency must be<br />
equal to or larger than twice highest spatial frequency of the interferogram, that is<br />
f c + f AC<br />
max < f sampling /2. (2.14)<br />
If information on the spatial content of the tear topography were available, one could<br />
put figures into these conditions and estimate an adequate angle for the wedges and the<br />
29