Alfredo Dubra's PhD thesis - Imperial College London
Alfredo Dubra's PhD thesis - Imperial College London
Alfredo Dubra's PhD thesis - Imperial College London

Create successful ePaper yourself
Turn your PDF publications into a flip-book with our unique Google optimized e-Paper software.
5. Preliminary experiments<br />
1<br />
10<br />
1<br />
20<br />
15<br />
0<br />
5<br />
0<br />
10<br />
5<br />
-1<br />
0<br />
-1<br />
0<br />
-1 0 1<br />
-1 0 1<br />
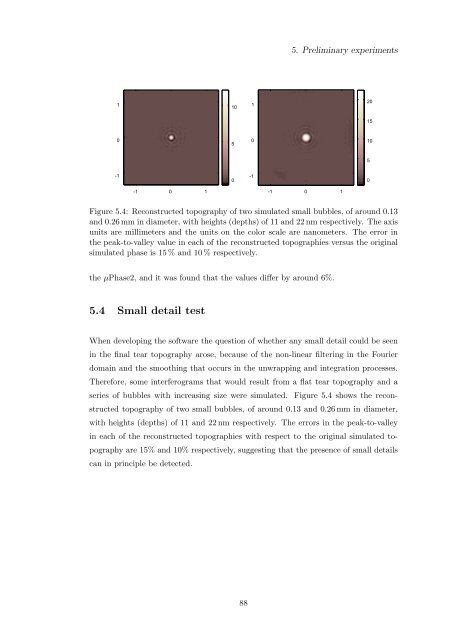
Figure 5.4: Reconstructed topography of two simulated small bubbles, of around 0.13<br />
and 0.26 mm in diameter, with heights (depths) of 11 and 22 nm respectively. The axis<br />
units are millimeters and the units on the color scale are nanometers. The error in<br />
the peak-to-valley value in each of the reconstructed topographies versus the original<br />
simulated phase is 15 % and 10 % respectively.<br />
the µPhase2, and it was found that the values differ by around 6%.<br />
5.4 Small detail test<br />
When developing the software the question of whether any small detail could be seen<br />
in the final tear topography arose, because of the non-linear filtering in the Fourier<br />
domain and the smoothing that occurs in the unwrapping and integration processes.<br />
Therefore, some interferograms that would result from a flat tear topography and a<br />
series of bubbles with increasing size were simulated. Figure 5.4 shows the reconstructed<br />
topography of two small bubbles, of around 0.13 and 0.26 mm in diameter,<br />
with heights (depths) of 11 and 22 nm respectively. The errors in the peak-to-valley<br />
in each of the reconstructed topographies with respect to the original simulated topography<br />
are 15% and 10% respectively, suggesting that the presence of small details<br />
can in principle be detected.<br />
88