NON-ISOTHERMAL STRESS CYCLE PARAMETERS INFLUENCE
NON-ISOTHERMAL STRESS CYCLE PARAMETERS INFLUENCE
NON-ISOTHERMAL STRESS CYCLE PARAMETERS INFLUENCE

You also want an ePaper? Increase the reach of your titles
YUMPU automatically turns print PDFs into web optimized ePapers that Google loves.
261<br />
Non-isothermal Stress Cycle Parameters Influence on the Middle Alloy Steels Durability<br />
The durability,<br />
2N [inversions]<br />
1800<br />
1600<br />
1400<br />
1200<br />
1000<br />
800<br />
2N= -4735.3De + 2049.4<br />
R 2 = 0.9403<br />
t=600 o C<br />
600<br />
0 0.1 0.2 0.3<br />
The relative total strain variation, De [%]<br />
12 MN/m<br />
28 MN/m<br />
55 MN/m<br />
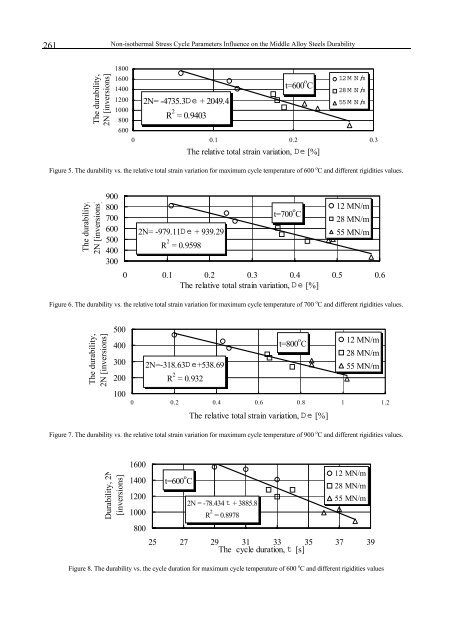
Figure 5. The durability vs. the relative total strain variation for maximum cycle temperature of 600 o C and different rigidities values.<br />
The durability,<br />
2N [inversions]<br />
900<br />
800<br />
700<br />
600<br />
500<br />
400<br />
300<br />
2N= -979.11De + 939.29<br />
R 2 = 0.9598<br />
t=700 o C<br />
12 MN/m<br />
28 MN/m<br />
55 MN/m<br />
0 0.1 0.2 0.3 0.4 0.5 0.6<br />
The relative total strain variation, De [%]<br />
Figure 6. The durability vs. the relative total strain variation for maximum cycle temperature of 700 o C and different rigidities values.<br />
The durability,<br />
2N [inversions]<br />
500<br />
400<br />
300<br />
200<br />
100<br />
t=800 o C<br />
12 MN/m<br />
28 MN/m<br />
2N=-318.63De+538.69<br />
55 MN/m<br />
R 2 = 0.932<br />
0 0.2 0.4 0.6 0.8 1 1.2<br />
The relative total strain variation, De [%]<br />
Figure 7. The durability vs. the relative total strain variation for maximum cycle temperature of 900 o C and different rigidities values.<br />
Durability, 2N<br />
[inversions]<br />
1600<br />
1400<br />
1200<br />
1000<br />
800<br />
t=600 o C<br />
2N = -78.434 t + 3885.8<br />
R 2 = 0.8978<br />
12 MN/m<br />
28 MN/m<br />
55 MN/m<br />
25 27 29 31 33 35 37 39<br />
The cycle duration, t [s]<br />
Figure 8. The durability vs. the cycle duration for maximum cycle temperature of 600 o C and different rigidities values