NON-ISOTHERMAL STRESS CYCLE PARAMETERS INFLUENCE
NON-ISOTHERMAL STRESS CYCLE PARAMETERS INFLUENCE
NON-ISOTHERMAL STRESS CYCLE PARAMETERS INFLUENCE

You also want an ePaper? Increase the reach of your titles
YUMPU automatically turns print PDFs into web optimized ePapers that Google loves.
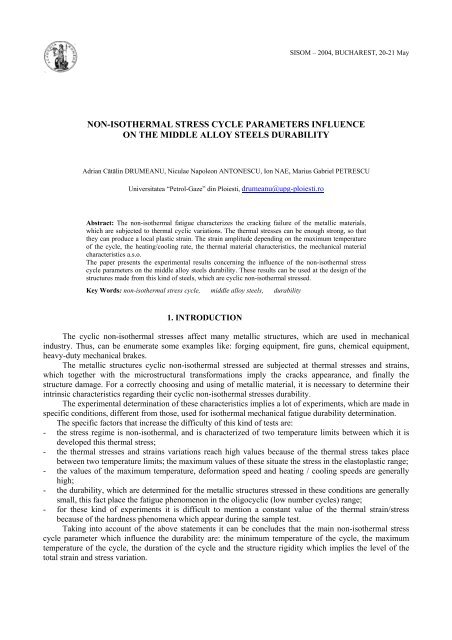
SISOM – 2004, BUCHAREST, 20-21 May<br />
<strong>NON</strong>-<strong>ISOTHERMAL</strong> <strong>STRESS</strong> <strong>CYCLE</strong> <strong>PARAMETERS</strong> <strong>INFLUENCE</strong><br />
ON THE MIDDLE ALLOY STEELS DURABILITY<br />
Adrian Cătălin DRUMEANU, Niculae Napoleon ANTONESCU, Ion NAE, Marius Gabriel PETRESCU<br />
Universitatea “Petrol-Gaze” din Ploiesti, drumeanu@upg-ploiesti.ro<br />
Abstract: The non-isothermal fatigue characterizes the cracking failure of the metallic materials,<br />
which are subjected to thermal cyclic variations. The thermal stresses can be enough strong, so that<br />
they can produce a local plastic strain. The strain amplitude depending on the maximum temperature<br />
of the cycle, the heating/cooling rate, the thermal material characteristics, the mechanical material<br />
characteristics a.s.o.<br />
The paper presents the experimental results concerning the influence of the non-isothermal stress<br />
cycle parameters on the middle alloy steels durability. These results can be used at the design of the<br />
structures made from this kind of steels, which are cyclic non-isothermal stressed.<br />
Key Words: non-isothermal stress cycle, middle alloy steels, durability<br />
1. INTRODUCTION<br />
The cyclic non-isothermal stresses affect many metallic structures, which are used in mechanical<br />
industry. Thus, can be enumerate some examples like: forging equipment, fire guns, chemical equipment,<br />
heavy-duty mechanical brakes.<br />
The metallic structures cyclic non-isothermal stressed are subjected at thermal stresses and strains,<br />
which together with the microstructural transformations imply the cracks appearance, and finally the<br />
structure damage. For a correctly choosing and using of metallic material, it is necessary to determine their<br />
intrinsic characteristics regarding their cyclic non-isothermal stresses durability.<br />
The experimental determination of these characteristics implies a lot of experiments, which are made in<br />
specific conditions, different from those, used for isothermal mechanical fatigue durability determination.<br />
The specific factors that increase the difficulty of this kind of tests are:<br />
- the stress regime is non-isothermal, and is characterized of two temperature limits between which it is<br />
developed this thermal stress;<br />
- the thermal stresses and strains variations reach high values because of the thermal stress takes place<br />
between two temperature limits; the maximum values of these situate the stress in the elastoplastic range;<br />
- the values of the maximum temperature, deformation speed and heating / cooling speeds are generally<br />
high;<br />
- the durability, which are determined for the metallic structures stressed in these conditions are generally<br />
small, this fact place the fatigue phenomenon in the oligocyclic (low number cycles) range;<br />
- for these kind of experiments it is difficult to mention a constant value of the thermal strain/stress<br />
because of the hardness phenomena which appear during the sample test.<br />
Taking into account of the above statements it can be concludes that the main non-isothermal stress<br />
cycle parameter which influence the durability are: the minimum temperature of the cycle, the maximum<br />
temperature of the cycle, the duration of the cycle and the structure rigidity which implies the level of the<br />
total strain and stress variation.
257<br />
Non-isothermal Stress Cycle Parameters Influence on the Middle Alloy Steels Durability<br />
The aim of the paper is to evidence the influence of these parameters on the middle alloy steels<br />
durability, which are used at the construction of the structures that are subjected at non-isothermal cyclic<br />
stresses.<br />
2. THEORETICAL CONSIDERATIONS CONCERNING<br />
THE MATERIALS THERMAL FATIGUE<br />
Thermal fatigue phenomenon explanation will be done considering the degradation (failure, cracking)<br />
which appears after a low number of cycles in non-isothermal stress conditions without maximum<br />
temperature cycle keeping, in fact one of the severe cases of a structure loading. In this situation, the gradual<br />
accumulation process of the degradation is done in the presence of the preponderant plastic deformations, the<br />
material destruction taking place because of the cyclic stresses/deformation effects, which are accumulated<br />
in time.<br />
The basic principle of the material behavior model at thermal fatigue, assumes that the both ends test<br />
piece are fastened by enclosure, during the heating process (Figure 1) [1, 2, 3].<br />
Figure 1. The thermal and mechanical model of the thermal fatigue material behavior:<br />
a) element with elastic link; b) the thermal cycle; c) hysteresis cycle of the elastic and plastic deformation.<br />
This model assumes the existence of tree serial parts: the test piece 1, the infinite rigidity element 2<br />
(J 2 =∞), the unloading element 3 (J 3
Adrian Catalin DRUMEANU, Niculae Napoleon ANTONESCU, Ion NAE, Marius Gabriel PETRESCU 258<br />
m t δ<br />
l<br />
c<br />
c<br />
ε = α ∆ −<br />
(2)<br />
where: ε c is the strain which corresponds to the maximum compression stress; ∆t – the temperature<br />
difference, ∆t= t max - t min ; δ c – the body 1 stretching corresponding to t max .<br />
When the body 1 is cooled from t max to t min , in point 2 it takes place the unloading, with the appearance<br />
of the tensile stress, the face A reaches in the position 3 (Figure 1, a) corresponding to the maximum<br />
stretching δ i . On the cyclic strain diagram (Figure 1, c) the point 3 corresponds to maximum tensile stress<br />
values σ i , with the strain:<br />
m t δ<br />
l<br />
1<br />
1<br />
t<br />
t<br />
ε = α ∆ −<br />
(3)<br />
where: ε i is the strain corresponding to the maximum tensile stress; δ i – the body 1 stretching, corresponding<br />
to t min . At the ulterior heating, the element 1 is unloaded and there are appear compression stresses (Figure 1,<br />
c point 5) with the elastoplastic strain smaller than the compression strain of the first cycle. Thus, the<br />
hysteresis cycle (1-2-3-4-5) is characterized by:<br />
- the elastoplastic deformation:<br />
m t δ −δ<br />
l<br />
- the hysteresis cycle width (the plastic deformation):<br />
t c<br />
∆ε = α ∆ − (4)<br />
min<br />
1<br />
t c<br />
σ δ<br />
∆ε p = ∆ε − − (5)<br />
E E<br />
where E min , E max represent the modulus of elasticity at the minimum, respectively maximum<br />
temperature of the stress cycle. The hysteresis cycle size and form depend on a lot of factors like: the form<br />
and the geometry of the heated element, the environment temperature, the coefficient of thermal<br />
conductivity, the thermal coefficient of expansion and the yield limit of the material etc. For the quantitative<br />
calculus, the influence of these factors is gathered in the thermal strain concentration factor K:<br />
K<br />
∆ε<br />
max<br />
m<br />
= (6)<br />
∆ε<br />
t<br />
where: ∆ε m is mechanical elastoplastic strain; ∆ε t – thermal strain.<br />
Considering that element 2 is cyclic heated with a small variation of the temperature, the element 1<br />
mechanical stretching becomes:<br />
l l l<br />
∆ m1 =∆ t1+∆ t2<br />
−δ 3<br />
where: δ 3 is the face A displacement of the element 1 in the sense of the element 3 shortening (negative<br />
stretching):<br />
∆σ ⋅ S<br />
δ 3 = (8)<br />
J<br />
where: ∆σ is the stress variation (Figure 1, c); S – the element 1 area of section; J – the system rigidity; ∆l t1 ,<br />
∆l t2 – the dilatation of the elements 1 and 2. Considering l 1 = l 2 and:<br />
∆ l t2<br />
=η∆l t1<br />
(7)<br />
(9)<br />
where η is a coefficient, it obtains:<br />
K<br />
δ<br />
l<br />
3<br />
= 1+η− 0≤ η ≤ 1 (10)<br />
∆<br />
t1
259<br />
Non-isothermal Stress Cycle Parameters Influence on the Middle Alloy Steels Durability<br />
The variant J 3 → ∞ implies K = 1 + η > 1 , respectively the mechanical strain amplification because of<br />
the thermal dilatation of the element 2. The variant J 3 → ∞ and η = 0 defines the particularly case K = 1,<br />
examined by Coffin, and it is done in real conditions only on the test pieces with both ends fastened by<br />
enclosure. In consequence, the elastoplastic strain variation can be determined using the system rigidity J,<br />
changing either the rigidity of the elastic element J 3 , or the rigidity J 2 , respectively calculating the<br />
supplementary strains of the element 2.<br />
3. CONSIDERATIONS CONCERNING THE TESTING METHODOLOGY<br />
The non-isothermal fatigue of the metallic materials characterizes their durability in oligocyclic range<br />
(low durability). These kinds of tests presume the cyclic axial stress in an elastoplastic regime when the<br />
maximum and minimum temperature values are maintained constants. Unlike to isothermal fatigue<br />
experiments, which are developed under constant amplitude, the non-isothermal fatigue tests present the<br />
strain amplitude variation in time. In the first part of the test, the total elastoplastic strain varies until of the<br />
hysteresis cycle stabilization, and finally it decreases because of the material hardening state appearance [4].<br />
In these conditions, for the calculus of the durability it is used the strain amplitude value corresponding to<br />
hysteresis cycle stabilization. The cylindrical test pieces are recommended for tests with the strain amplitude<br />
up to 2 %. Over this value there are recommended the toroidal test pieces.<br />
The concrete conditions of the tests are: the test pieces were tested in non-isothermal regime; the test<br />
pieces were fastened by enclosure and they were stressed to compression at the maximum temperature of the<br />
cycle; the elastoplastic strain variation was limited using three rigidity steps of the test piece fastened system<br />
(12, 28, 55 MN/m); the average heating speeds of the test piece were in the range of 55…80 °C/s; the<br />
average cooling speeds of the test piece were in the range of 5.5…7.0 °C/s; the absence of the maintaining<br />
time at the maximum temperature of the cycle; the using of the full test pieces with 4 mm diameter and 30<br />
mm length of the calibrated part; the criterion of the testing break was the first crack appearance [5].<br />
4. THE EXPERIMENTAL TESTED STEELS<br />
The experimental determinations were done using four sort of middle alloy steel. Their chemical<br />
composition and their mechanical characteristics are shown in Table 1, and Table 2.<br />
Table 1. Chemical composition of the tested steels<br />
Table 2. Mechanical characteristics of the studied steels<br />
Alloying Elements Composition, % wt Mechanical characteristic Values<br />
C 0.32 … 0.42 Tensile strength 540 … 930 MPa<br />
Mn 0.43 … 1.46 Yield limit 295 … 735 MPa<br />
Cr 0.24 … 1.01 Elongation 12 … 16 %<br />
Ni 0.09 … 0.63 Reduction of area 25 … 50 %<br />
Mo 0.04 … 0.21<br />
Si 0.25 … 0.52<br />
6. RESULTS AND DISCUSSIONS<br />
The aim of the experimental determinations was to emphasize the influence of the main non-isothermal<br />
stress cycle parameters on the tested steels durability. The durability was expressed like the inversions<br />
number until the first crack appearance on the test piece external surface. The main stress cycle parameters,<br />
which were considered, were the maximum temperature of the non-isothermal cycle, the system rigidity, the<br />
total relative strain variation and the cycle duration. For all the tests, the minimum temperature value of the<br />
non-isothermal cycle was 100 o C.<br />
In Figures 2, 3 and 4 it is represented the dependence between the durability and the maximum<br />
temperature of the cycle for different values of the system rigidity. For every rigidity value it was determined
Adrian Catalin DRUMEANU, Niculae Napoleon ANTONESCU, Ion NAE, Marius Gabriel PETRESCU 260<br />
the regression equation and the determination coefficient which were shown on each figure. In all the cases it<br />
can be remarked the good correlation between the variables taken into account.<br />
In Figures 5, 6, and 7 it is represented the dependence between the durability and the total relative<br />
strain variation for different maximum temperature values of the cycle and different rigidities of the system.<br />
In addition, on each figure it was shown the regression analysis equation and its determination coefficient,<br />
which has a high value. Similarly, in Figures 8, 9 and 10 it was plotted the dependence between the<br />
durability and the total duration of the cycle for different maximum temperature values. For these cases, the<br />
determination coefficients have lower values than the situations considered in the figures above enumerated.<br />
The durability, 2N<br />
[inversions]<br />
1500<br />
1100<br />
2N = 78683e -0.0066t<br />
R 2 = 0.9636<br />
700 12 MN/m<br />
300<br />
500 600 700 800 900<br />
The maximum temperature of the cycle, t [ o C]<br />
Figure 2. The durability (2N) vs. the maximum temperature of the cycle (t) for 12 MN/m rigidity value<br />
The durability, 2N<br />
[inversions]<br />
1400<br />
1200<br />
1000<br />
800<br />
600<br />
400<br />
200<br />
28 MN/m<br />
2N = 60631e -0.0066t<br />
R 2 = 0.9786<br />
500 600 700 800 900<br />
The maximum temperature of the cycle, t [ o C]<br />
Figure 3. The durability (2N) vs. the maximum temperature of the cycle (t) for 28 MN/m rigidity value<br />
The durability, 2N<br />
[inversions]<br />
1000<br />
800<br />
600<br />
400<br />
200<br />
55 MN/m<br />
2N = 37147e -0.0064t<br />
R 2 = 0.9416<br />
500 600 700 800 900<br />
The maximum temperature of the cycle, t [ o C]<br />
Figure 4. The durability (2N) vs. the maximum temperature of the cycle (t) for 55 MN/m rigidity value
261<br />
Non-isothermal Stress Cycle Parameters Influence on the Middle Alloy Steels Durability<br />
The durability,<br />
2N [inversions]<br />
1800<br />
1600<br />
1400<br />
1200<br />
1000<br />
800<br />
2N= -4735.3De + 2049.4<br />
R 2 = 0.9403<br />
t=600 o C<br />
600<br />
0 0.1 0.2 0.3<br />
The relative total strain variation, De [%]<br />
12 MN/m<br />
28 MN/m<br />
55 MN/m<br />
Figure 5. The durability vs. the relative total strain variation for maximum cycle temperature of 600 o C and different rigidities values.<br />
The durability,<br />
2N [inversions]<br />
900<br />
800<br />
700<br />
600<br />
500<br />
400<br />
300<br />
2N= -979.11De + 939.29<br />
R 2 = 0.9598<br />
t=700 o C<br />
12 MN/m<br />
28 MN/m<br />
55 MN/m<br />
0 0.1 0.2 0.3 0.4 0.5 0.6<br />
The relative total strain variation, De [%]<br />
Figure 6. The durability vs. the relative total strain variation for maximum cycle temperature of 700 o C and different rigidities values.<br />
The durability,<br />
2N [inversions]<br />
500<br />
400<br />
300<br />
200<br />
100<br />
t=800 o C<br />
12 MN/m<br />
28 MN/m<br />
2N=-318.63De+538.69<br />
55 MN/m<br />
R 2 = 0.932<br />
0 0.2 0.4 0.6 0.8 1 1.2<br />
The relative total strain variation, De [%]<br />
Figure 7. The durability vs. the relative total strain variation for maximum cycle temperature of 900 o C and different rigidities values.<br />
Durability, 2N<br />
[inversions]<br />
1600<br />
1400<br />
1200<br />
1000<br />
800<br />
t=600 o C<br />
2N = -78.434 t + 3885.8<br />
R 2 = 0.8978<br />
12 MN/m<br />
28 MN/m<br />
55 MN/m<br />
25 27 29 31 33 35 37 39<br />
The cycle duration, t [s]<br />
Figure 8. The durability vs. the cycle duration for maximum cycle temperature of 600 o C and different rigidities values
Adrian Catalin DRUMEANU, Niculae Napoleon ANTONESCU, Ion NAE, Marius Gabriel PETRESCU 262<br />
Durability, 2N<br />
[inversions]<br />
800<br />
700<br />
600<br />
500<br />
400<br />
300<br />
2N = -17.586 t + 1837.6<br />
R2 = 0.865<br />
t=700 o C<br />
12 MN/m<br />
28 MN/m<br />
55 MN/m<br />
60 70 80 90<br />
The cycle duration, t [s]<br />
Figure 9. The durability vs. the cycle duration for maximum cycle temperature of 700 o C and different rigidities values<br />
Durability, 2N<br />
[inversions]<br />
500<br />
400<br />
300<br />
2N = -5.7139t + 1045.6<br />
R 2 = 0.8853<br />
t=800 o C<br />
12 MN/m<br />
28 MN/m<br />
55 MN/m<br />
200<br />
100 110 120 130 140 150<br />
The cycle duration, t [s]<br />
Figure 10. The durability vs. the cycle duration for maximum cycle temperature of 800 o C and different rigidities values<br />
It can be observed that between the parameters taking into account and the durability it exists a good<br />
correlation which is proved by the high values of the determination coefficient.<br />
This fact imposes to do a global evaluation of the interdependence between the durability and the main nonisothermal<br />
cycle parameters (the maximum temperature of the cycle, the system rigidity and the cycle<br />
duration), using multiple correlation regression. For this case, it is proposed the next equation:<br />
A<br />
2N<br />
= tW τ<br />
a b c<br />
where: 2N is the durability, inversions; t is the maximum temperature of the non-isothermal cycle, o C; W is the<br />
system rigidity, MN/m; τ is the cycle duration, s; A, a, b, c are the equation constants which have the values<br />
A = 323594, a = 0.26, b = 0.182, c = 0.948.<br />
The characteristics of the regression equation (11) are: the maximum temperature value of the nonisothermal<br />
stress cycle t, in the range of 600…800 o C; the system rigidity W, in the range of 12…55 MN/m; the<br />
duration of the cycle τ, in the range of 25…150 s; the durability 2N, in the range of 200…1600 inversions; the<br />
determination coefficient value R 2 = 0.992.<br />
Regarding the equation regression (11), it can be remarked the good correlation between the independent<br />
variables which are considered and the dependent variable. This good correlation signifies the fact that the<br />
parameters of the non-isothermal stress cycle, which were considered, have the major influence on the tested<br />
steels durability.<br />
(11)<br />
7. CONCLUSIONS<br />
The main conclusions, which can be detached from the experimental results above presented, are:
263<br />
Non-isothermal Stress Cycle Parameters Influence on the Middle Alloy Steels Durability<br />
• the high degree verisimilar determinations of the non-isothermal fatigue durability are those who are<br />
done when the test piece is fastened by enclosure at both ends and it is compressed at the maximum<br />
temperature of the cycle;<br />
• the choosing of an adequately rigidity for the test piece enclosure system is very important for the<br />
elastoplastic strain determinations and for the diminution of the stress relaxation phenomenon;<br />
• the size of the temperature variation and the system rigidity have the major weight in durability<br />
determination;<br />
• lower values of the determination coefficients were obtained for the cycle duration influence;<br />
• the regression equation (11) can be used for the middle alloy steels sort which is subjected to nonisothermal<br />
cyclic fatigue:<br />
• the above determined experimental results can be used both in designing and exploitation activities.<br />
REFERENCES<br />
1. DULNEV, R.A., KOTOV, P.I., Termiceskaia ustalost metallov, Masinostroenie, Moskva, 1980<br />
2. SERENSEN, S.V., KOTOV, P.I., Ob otenke soprotivlenyia termiceskoi ustalosti po metodu varirucmoi jestkosty nagrujenyia,<br />
Zavodskaia laboratoryia, 1962, v.28, nr. 10: 1233-1238<br />
3. TULEAKOV, G.A., Termiceskaia ustalost v teploenerghetike, Masinostroenie, Moskva, 1978<br />
4. ALEKSIUK, M.M., BORISENKO, V.A., KRASCENKO, V.P., Mehaniceskie ispitanyia materialov pri visokih temperaturah,<br />
Naukova Dumka, Kiev, 1980<br />
5. RUSU, O., TEODORESCU, M., LASCU-SIMION, N., Oboseala Materialelor, Editura Tehnica, Bucuresti, 1992