ETFR's - IndexUniverse.com
ETFR's - IndexUniverse.com
ETFR's - IndexUniverse.com
Create successful ePaper yourself
Turn your PDF publications into a flip-book with our unique Google optimized e-Paper software.
ETFR<br />
4 Natural gas ETF<br />
in the works<br />
Victoria Bay Asset Management, the<br />
folks that brought the $900 million US<br />
Oil Fund (AMEX: USO) to market, has<br />
filed papers with the SEC for an ETF tied<br />
to the price of natural gas. The US<br />
Natural Gas will, like other <strong>com</strong>modity<br />
ETFs, buy natural gas futures contracts<br />
on the New York Mercantile Exchange<br />
and roll them one month to the next,<br />
while investing collateral cash in<br />
Treasuries. Victoria Bay’s isn’t the first<br />
natural gas ETF in development.<br />
Barclays Global Investors is also planning<br />
such a fund.<br />
Claymore adds three<br />
quirky and four style ETFs<br />
In early April, Claymore Securities<br />
added seven ETFs to its ever-expanding<br />
lineup. As usual with this ETF provider,<br />
three of the products are quirky, four<br />
are domestic style boxes.<br />
The style ETFs include: BIR Leaders<br />
Mid-Cap Value (AMEX: BMV); BIR<br />
Leaders Small-Cap Core (AMEX: BES),<br />
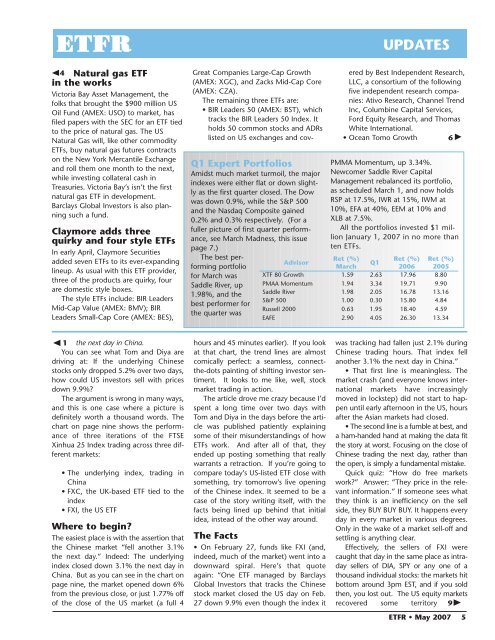
Q1 Expert Portfolios<br />
Amidst much market turmoil, the major<br />
indexes were either flat or down slightly<br />
as the first quarter closed. The Dow<br />
was down 0.9%, while the S&P 500<br />
and the Nasdaq Composite gained<br />
0.2% and 0.3% respectively. (For a<br />
fuller picture of first quarter performance,<br />
see March Madness, this issue<br />
page 7.)<br />
The best performing<br />
portfolio<br />
for March was<br />
Saddle River, up<br />
1.98%, and the<br />
best performer for<br />
the quarter was<br />
UPDATES<br />
Great Companies Large-Cap Growth<br />
(AMEX: XGC), and Zacks Mid-Cap Core<br />
(AMEX: CZA).<br />
The remaining three ETFs are:<br />
• BIR Leaders 50 (AMEX: BST), which<br />
tracks the BIR Leaders 50 Index. It<br />
holds 50 <strong>com</strong>mon stocks and ADRs<br />
listed on US exchanges and covered<br />
by Best Independent Research,<br />
LLC, a consortium of the following<br />
five independent research <strong>com</strong>panies:<br />
Ativo Research, Channel Trend<br />
Inc, Columbine Capital Services,<br />
Ford Equity Research, and Thomas<br />
White International.<br />
• Ocean Tomo Growth 6<br />
PMMA Momentum, up 3.34%.<br />
New<strong>com</strong>er Saddle River Capital<br />
Management rebalanced its portfolio,<br />
as scheduled March 1, and now holds<br />
RSP at 17.5%, IWR at 15%, IWM at<br />
10%, EFA at 40%, EEM at 10% and<br />
XLB at 7.5%.<br />
All the portfolios invested $1 million<br />
January 1, 2007 in no more than<br />
ten ETFs.<br />
Advisor<br />
Ret (%)<br />
Ret (%) Ret (%)<br />
Q1<br />
March<br />
2006 2005<br />
XTF 80 Growth 1.59 2.63 17.96 8.80<br />
PMAA Momentum 1.94 3.34 19.71 9.90<br />
Saddle River 1.98 2.05 16.78 13.16<br />
S&P 500 1.00 0.30 15.80 4.84<br />
Russell 2000 0.63 1.95 18.40 4.59<br />
EAFE 2.90 4.05 26.30 13.34<br />
1 the next day in China.<br />
You can see what Tom and Diya are<br />
driving at: If the underlying Chinese<br />
stocks only dropped 5.2% over two days,<br />
how could US investors sell with prices<br />
down 9.9%?<br />
The argument is wrong in many ways,<br />
and this is one case where a picture is<br />
definitely worth a thousand words. The<br />
chart on page nine shows the performance<br />
of three iterations of the FTSE<br />
Xinhua 25 Index trading across three different<br />
markets:<br />
• The underlying index, trading in<br />
China<br />
• FXC, the UK-based ETF tied to the<br />
index<br />
• FXI, the US ETF<br />
Where to begin?<br />
The easiest place is with the assertion that<br />
the Chinese market “fell another 3.1%<br />
the next day.” Indeed: The underlying<br />
index closed down 3.1% the next day in<br />
China. But as you can see in the chart on<br />
page nine, the market opened down 6%<br />
from the previous close, or just 1.77% off<br />
of the close of the US market (a full 4<br />
hours and 45 minutes earlier). If you look<br />
at that chart, the trend lines are almost<br />
<strong>com</strong>ically perfect: a seamless, connectthe-dots<br />
painting of shifting investor sentiment.<br />
It looks to me like, well, stock<br />
market trading in action.<br />
The article drove me crazy because I’d<br />
spent a long time over two days with<br />
Tom and Diya in the days before the article<br />
was published patiently explaining<br />
some of their misunderstandings of how<br />
ETFs work. And after all of that, they<br />
ended up posting something that really<br />
warrants a retraction. If you’re going to<br />
<strong>com</strong>pare today’s US-listed ETF close with<br />
something, try tomorrow’s live opening<br />
of the Chinese index. It seemed to be a<br />
case of the story writing itself, with the<br />
facts being lined up behind that initial<br />
idea, instead of the other way around.<br />
The Facts<br />
• On February 27, funds like FXI (and,<br />
indeed, much of the market) went into a<br />
downward spiral. Here’s that quote<br />
again: “One ETF managed by Barclays<br />
Global Investors that tracks the Chinese<br />
stock market closed the US day on Feb.<br />
27 down 9.9% even though the index it<br />
was tracking had fallen just 2.1% during<br />
Chinese trading hours. That index fell<br />
another 3.1% the next day in China.”<br />
• That first line is meaningless. The<br />
market crash (and everyone knows international<br />
markets have increasingly<br />
moved in lockstep) did not start to happen<br />
until early afternoon in the US, hours<br />
after the Asian markets had closed.<br />
• The second line is a fumble at best, and<br />
a ham-handed hand at making the data fit<br />
the story at worst. Focusing on the close of<br />
Chinese trading the next day, rather than<br />
the open, is simply a fundamental mistake.<br />
Quick quiz: “How do free markets<br />
work?” Answer: “They price in the relevant<br />
information.” If someone sees what<br />
they think is an inefficiency on the sell<br />
side, they BUY BUY BUY. It happens every<br />
day in every market in various degrees.<br />
Only in the wake of a market sell-off and<br />
settling is anything clear.<br />
Effectively, the sellers of FXI were<br />
caught that day in the same place as intraday<br />
sellers of DIA, SPY or any one of a<br />
thousand individual stocks: the markets hit<br />
bottom around 3pm EST, and if you sold<br />
then, you lost out. The US equity markets<br />
recovered some territory 9<br />
ETFR • May 2007 5


