

ETFR's - IndexUniverse.com
ETFR's - IndexUniverse.com
ETFR's - IndexUniverse.com

You also want an ePaper? Increase the reach of your titles
YUMPU automatically turns print PDFs into web optimized ePapers that Google loves.
ETFR<br />
exchange-traded funds report<br />
www.indexuniverse.<strong>com</strong>/ETFR<br />
Issue No. 78<br />
May 2007<br />
And That’s<br />
The Way it Is<br />
By Jim Wiandt<br />
Let me say first that I am a big fan of<br />
Tom Lauricella and Diya Gullapalli of The<br />
Wall Street Journal. I think there are few<br />
financial journalists out there really working<br />
for investors’ interests. The financial<br />
media is a sordid, incestuous landscape,<br />
where big reporters are regularly<br />
snatched up by fund <strong>com</strong>panies to<br />
be<strong>com</strong>e well-paid PR agents, and gritty<br />
reporting is softened by fancy dinners<br />
and golf outings. A reporter pointing out<br />
scandalous behavior and really lobbying<br />
for the interests of average investors is a<br />
breath of fresh air. Often, that’s just what<br />
Tom and Diya do.<br />
But (and you knew there was a “but”<br />
<strong>com</strong>ing), these two have just plain gotten<br />
it wrong this time. In a March 17<br />
post mortem of the February 26-27 market<br />
collapse, Tom and Diya came out<br />
with a coauthored article, Fast-Money<br />
Crowd Embraces ETFs.<br />
UPDATES<br />
Adding Risk for<br />
Individual Investors<br />
The article examined the performance of<br />
emerging markets ETFs in the wake of<br />
the collapse of the Chinese market. In<br />
particular, it focused on the iShares FTSE<br />
Xinhua 25 ETF (NYSE: FXI), a popular<br />
fund tracking 25 large-cap Chinese <strong>com</strong>panies<br />
listed on the Hong Kong Stock<br />
Exchange. The gist was that the very<br />
structure of ETFs failed: US investors sold<br />
ETFs like FXI at prices lower than the<br />
underlying stocks ever traded. In short,<br />
the article claimed, “fast money” took<br />
advantage of individual investors.<br />
Here’s the central fact of the article,<br />
directly quoted:<br />
One ETF managed by Barclays Global<br />
Investors that tracks the Chinese stock<br />
market closed the US day on Feb. 27 down<br />
9.9% even though the index it was tracking<br />
had fallen just 2.1% during Chinese trading<br />
hours. That index fell another 3.1%<br />
5<br />
IN THIS ISSUE<br />
<strong>ETFR's</strong> publisher, Jim Wiandt, discusses<br />
the affect of recent market turmoil on FXI.<br />
Cover<br />
HealthShares, the slim health centric ETFs<br />
that began trading on the NYSE earlier<br />
this year, have be<strong>com</strong>e some of the most<br />
active ETFs in the market recently,<br />
attracting volume and assets.<br />
Cover<br />
The fundamental twist continues as FTSE<br />
RAFI indexes be<strong>com</strong>e the basis for a line<br />
of mutual funds by Charles Schwab; ETFs<br />
tracking the same indexes were licensed<br />
to PowerShares last year.<br />
Page 3<br />
Looking for a dash of pure technical<br />
analysis to <strong>com</strong>plete your portfolio?<br />
PowerShares teamed up with Dorsey<br />
Wright to design an ETF using a form of<br />
technical analysis called relative strength.<br />
Page 6<br />
ETFR’s Q1 performance derby includes<br />
the top 20 winning and losing ETFs.<br />
Pages 8<br />
ETFR’s monthly database includes all USlisted<br />
ETFs. For European and international<br />
ETFs, please see the electronic version<br />
of ETFR or go to www.indexuniverse.<strong>com</strong>.<br />
Page 12<br />
HealthShares gain market appeal<br />
After being excoriated in some corners<br />
of the media for their reed thin, healthcentric<br />
ETFs, seven HealthShares topped<br />
the 10 best performing ETF list at close<br />
of business on April 5, according to the<br />
Wall Street Journal. (The three other<br />
ETFs were also in the healthcare sector.)<br />
While one day of stellar performance<br />
does not a successful track<br />
record make, it does suggest that this<br />
ETF family can add alpha to a portfolio.<br />
In the days following this headturning<br />
performance, one or two<br />
HealthShares remained among the<br />
WSJ’s top ten ETFs.<br />
The biotech space is heating up<br />
and be<strong>com</strong>ing more active since the<br />
recent FDA’s Dandreon decision.<br />
“There were more than 11 IPOs last<br />
year in the biotech space, and liquidity<br />
is trying to find a sector home,”<br />
says Nat Wasserstein, president of<br />
XShares Advisors. “Emerging markets<br />
have been disappointing, blue chips<br />
are flat at best, and real estate is dropping<br />
like a stone.”<br />
Wasserstein goes on to argue that<br />
the hardest part of investing in<br />
biotech is choosing individual stocks—<br />
which is exactly why ETFs are so<br />
appealing. While all health sector ETFs<br />
diversify single stock risk,<br />
HealthShares’ ETFs are slim tools that<br />
allow investors to isolate a specific<br />
healthcare subsector and can<br />
serve strategies long or short.<br />
3
ETFR<br />
4 Natural gas ETF<br />
in the works<br />
Victoria Bay Asset Management, the<br />
folks that brought the $900 million US<br />
Oil Fund (AMEX: USO) to market, has<br />
filed papers with the SEC for an ETF tied<br />
to the price of natural gas. The US<br />
Natural Gas will, like other <strong>com</strong>modity<br />
ETFs, buy natural gas futures contracts<br />
on the New York Mercantile Exchange<br />
and roll them one month to the next,<br />
while investing collateral cash in<br />
Treasuries. Victoria Bay’s isn’t the first<br />
natural gas ETF in development.<br />
Barclays Global Investors is also planning<br />
such a fund.<br />
Claymore adds three<br />
quirky and four style ETFs<br />
In early April, Claymore Securities<br />
added seven ETFs to its ever-expanding<br />
lineup. As usual with this ETF provider,<br />
three of the products are quirky, four<br />
are domestic style boxes.<br />
The style ETFs include: BIR Leaders<br />
Mid-Cap Value (AMEX: BMV); BIR<br />
Leaders Small-Cap Core (AMEX: BES),<br />
Q1 Expert Portfolios<br />
Amidst much market turmoil, the major<br />
indexes were either flat or down slightly<br />
as the first quarter closed. The Dow<br />
was down 0.9%, while the S&P 500<br />
and the Nasdaq Composite gained<br />
0.2% and 0.3% respectively. (For a<br />
fuller picture of first quarter performance,<br />
see March Madness, this issue<br />
page 7.)<br />
The best performing<br />
portfolio<br />
for March was<br />
Saddle River, up<br />
1.98%, and the<br />
best performer for<br />
the quarter was<br />
UPDATES<br />
Great Companies Large-Cap Growth<br />
(AMEX: XGC), and Zacks Mid-Cap Core<br />
(AMEX: CZA).<br />
The remaining three ETFs are:<br />
• BIR Leaders 50 (AMEX: BST), which<br />
tracks the BIR Leaders 50 Index. It<br />
holds 50 <strong>com</strong>mon stocks and ADRs<br />
listed on US exchanges and covered<br />
by Best Independent Research,<br />
LLC, a consortium of the following<br />
five independent research <strong>com</strong>panies:<br />
Ativo Research, Channel Trend<br />
Inc, Columbine Capital Services,<br />
Ford Equity Research, and Thomas<br />
White International.<br />
• Ocean Tomo Growth 6<br />
PMMA Momentum, up 3.34%.<br />
New<strong>com</strong>er Saddle River Capital<br />
Management rebalanced its portfolio,<br />
as scheduled March 1, and now holds<br />
RSP at 17.5%, IWR at 15%, IWM at<br />
10%, EFA at 40%, EEM at 10% and<br />
XLB at 7.5%.<br />
All the portfolios invested $1 million<br />
January 1, 2007 in no more than<br />
ten ETFs.<br />
Advisor<br />
Ret (%)<br />
Ret (%) Ret (%)<br />
Q1<br />
March<br />
2006 2005<br />
XTF 80 Growth 1.59 2.63 17.96 8.80<br />
PMAA Momentum 1.94 3.34 19.71 9.90<br />
Saddle River 1.98 2.05 16.78 13.16<br />
S&P 500 1.00 0.30 15.80 4.84<br />
Russell 2000 0.63 1.95 18.40 4.59<br />
EAFE 2.90 4.05 26.30 13.34<br />
1 the next day in China.<br />
You can see what Tom and Diya are<br />
driving at: If the underlying Chinese<br />
stocks only dropped 5.2% over two days,<br />
how could US investors sell with prices<br />
down 9.9%?<br />
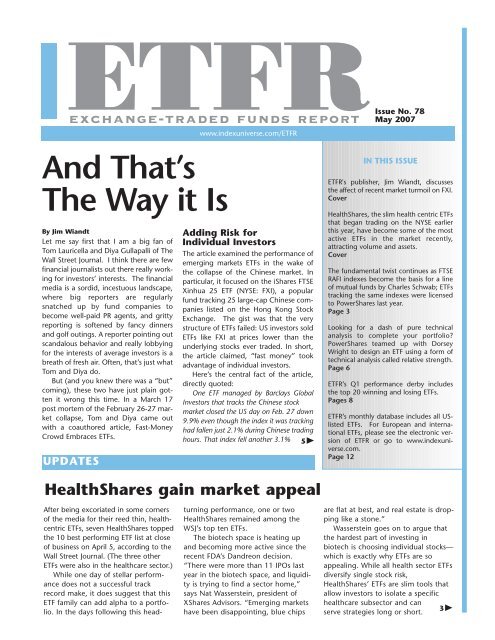
The argument is wrong in many ways,<br />
and this is one case where a picture is<br />
definitely worth a thousand words. The<br />
chart on page nine shows the performance<br />
of three iterations of the FTSE<br />
Xinhua 25 Index trading across three different<br />
markets:<br />
• The underlying index, trading in<br />
China<br />
• FXC, the UK-based ETF tied to the<br />
index<br />
• FXI, the US ETF<br />
Where to begin?<br />
The easiest place is with the assertion that<br />
the Chinese market “fell another 3.1%<br />
the next day.” Indeed: The underlying<br />
index closed down 3.1% the next day in<br />
China. But as you can see in the chart on<br />
page nine, the market opened down 6%<br />
from the previous close, or just 1.77% off<br />
of the close of the US market (a full 4<br />
hours and 45 minutes earlier). If you look<br />
at that chart, the trend lines are almost<br />
<strong>com</strong>ically perfect: a seamless, connectthe-dots<br />
painting of shifting investor sentiment.<br />
It looks to me like, well, stock<br />
market trading in action.<br />
The article drove me crazy because I’d<br />
spent a long time over two days with<br />
Tom and Diya in the days before the article<br />
was published patiently explaining<br />
some of their misunderstandings of how<br />
ETFs work. And after all of that, they<br />
ended up posting something that really<br />
warrants a retraction. If you’re going to<br />
<strong>com</strong>pare today’s US-listed ETF close with<br />
something, try tomorrow’s live opening<br />
of the Chinese index. It seemed to be a<br />
case of the story writing itself, with the<br />
facts being lined up behind that initial<br />
idea, instead of the other way around.<br />
The Facts<br />
• On February 27, funds like FXI (and,<br />
indeed, much of the market) went into a<br />
downward spiral. Here’s that quote<br />
again: “One ETF managed by Barclays<br />
Global Investors that tracks the Chinese<br />
stock market closed the US day on Feb.<br />
27 down 9.9% even though the index it<br />
was tracking had fallen just 2.1% during<br />
Chinese trading hours. That index fell<br />
another 3.1% the next day in China.”<br />
• That first line is meaningless. The<br />
market crash (and everyone knows international<br />
markets have increasingly<br />
moved in lockstep) did not start to happen<br />
until early afternoon in the US, hours<br />
after the Asian markets had closed.<br />
• The second line is a fumble at best, and<br />
a ham-handed hand at making the data fit<br />
the story at worst. Focusing on the close of<br />
Chinese trading the next day, rather than<br />
the open, is simply a fundamental mistake.<br />
Quick quiz: “How do free markets<br />
work?” Answer: “They price in the relevant<br />
information.” If someone sees what<br />
they think is an inefficiency on the sell<br />
side, they BUY BUY BUY. It happens every<br />
day in every market in various degrees.<br />
Only in the wake of a market sell-off and<br />
settling is anything clear.<br />
Effectively, the sellers of FXI were<br />
caught that day in the same place as intraday<br />
sellers of DIA, SPY or any one of a<br />
thousand individual stocks: the markets hit<br />
bottom around 3pm EST, and if you sold<br />
then, you lost out. The US equity markets<br />
recovered some territory 9<br />
ETFR • May 2007 5
ETFR<br />
5 between 3pm and 4pm that day,<br />
and that recovery continued when the<br />
Chinese market opened four-and-a-half<br />
hours later. You can see that clearly in the<br />
trend line of recovery in the chart below.<br />
The great irony here is that there is far<br />
more defined, gameable risk in a traditional<br />
mutual fund that prices its net asset<br />
value once a day. Say an ordinary<br />
investor sends in money to his fund <strong>com</strong>pany<br />
to purchase shares of the AA Active<br />
China Fund at the close of the Chinese<br />
market. He gets those shares priced at<br />
the NAV. The next day, the US market<br />
trades up 3%. A hedge fund manager<br />
can practically be certain that the Chinese<br />
market will follow the US market up when<br />
it opens four-plus hours later. But because<br />
the fund’s price is based on the previous<br />
day’s close in China, he can still buy<br />
shares at yesterday’s NAV. Essentially, for<br />
a fund that does not “fair value price”<br />
(and most of them don’t), the odds are<br />
very strong that hedge fund managers<br />
and other “fast money” can swoop in<br />
and steal that return from the rest of the<br />
funds shareholders. That, like expenses,<br />
is something knowable; the live direction<br />
of trading is not. I’ll take my chances in a<br />
volatile market to bet on the losing team<br />
after the game is over any day.<br />
As a result, a long-only investor in a traditional<br />
mutual fund is much more likely to<br />
get damaged by hedge fund trading<br />
around volatility than an ETF investor.<br />
The only ETF investors who were damaged<br />
in February were those who panicked and<br />
bailed out intraday<br />
on February 27.<br />
Traditional fund<br />
investors, on the<br />
other hand, could<br />
(and probably did)<br />
get hit by a bunch of<br />
shares being bought<br />
on the cheap based<br />
on stale pricing<br />
(assuming no fair<br />
value pricing is in<br />
effect). To add insult<br />
to injury, traditional<br />
mutual fund shareholders<br />
will have to<br />
pay capital gains on<br />
all the fund activity<br />
caused by buys and<br />
sells based on this<br />
late-trading strategy.<br />
Pct Change (%)<br />
2.00%<br />
0.00%<br />
-2.00%<br />
-4.00%<br />
-6.00%<br />
-8.00%<br />
-10.00%<br />
-12.00%<br />
The Malaysia Example<br />
Tom and Diya’s argument, while wrong,<br />
is not new. The poster child for “failed<br />
ETF pricing” is the iShares MSCI Malaysia<br />
ETF (AMEX: EWM). In 1997, during the<br />
Asian financial crisis, the Malaysian markets<br />
shut down to international investors.<br />
Malaysia’s politicians, furious at currency<br />
speculators like George Soros, also halted<br />
trading in the Malaysian ringgit.<br />
For US investors, EWM quickly became<br />
the only game in town. If you had bigtime<br />
Malaysian exposure, EWM was the<br />
only way to hedge it. Effectively, the ETF<br />
became the price discovery mechanism<br />
not only for the Malaysian market, but also<br />
for the Malaysian currency.<br />
As might be expected, the ETF traded<br />
at wild premiums and discounts to the<br />
closed-off Malaysian markets, with discounts<br />
reaching 20-30%. But while people<br />
decried these differences, the ETF was<br />
actually doing its job: it was pricing the<br />
market as accurately as possible, given<br />
investor sentiment at the time.<br />
FTSE China<br />
Trading Feb 27 - Feb 28<br />
16:15<br />
21:00<br />
0:30<br />
3:30<br />
7:30<br />
11:30<br />
15:30<br />
19:30<br />
23:30<br />
3:00<br />
6:30<br />
10:30<br />
13:30<br />
Trading Hours (EST)<br />
Conclusion<br />
It seems to me that the only case Tom<br />
and Diya could even try to make about<br />
trading on February 27 is that ETFs trading<br />
outside the live market for the underlying<br />
stocks may have more volatility, due<br />
to thinner overall trading. But what’s the<br />
suggestion there? Shut down after-hours<br />
trading? Don’t allow live trading on foreign<br />
markets in the US? It’s lunacy, especially<br />
when the obvious alternative (openend<br />
funds) has more knowable downside<br />
to investors. ETFs are only a reflection of<br />
the markets they represent.<br />
In effect, you end up blaming the<br />
market for its own volatility. The ETF<br />
structure didn’t fail, as Tom and Diya<br />
seem to suggest. In fact, the opposite is<br />
true: ETFs reflected prevailing market<br />
sentiment at that time. There happened<br />
to have been more sellers than buyers. If<br />
you had the guts to take the other side of<br />
that trade, instead of selling in panic, you<br />
made money. That’s how the market<br />
works. That’s arbitrage. That’s capitalism.<br />
The truth is that ETFs have brought<br />
MORE liquidity, MORE transparency and<br />
MORE stability to the markets. You can<br />
short ETFs, even in a precipitously falling<br />
market (unlike ordinary equities). And if<br />
a ton of short volume <strong>com</strong>es in, the ETF<br />
shares theoretically have to be created to<br />
cover those loans, necessitating the purchase<br />
of the underlying and actually flattening<br />
the downward volatility.<br />
In short: good intentions, bad execution.<br />
The great irony is that, like the general<br />
tone of current affairs, the authors<br />
have really turned reality on its head to<br />
make the very strength of ETFs into their<br />
weakness. They’re simply barking up the<br />
wrong tree. Take on ETFs for being too<br />
narrow? Sure. Do some exchange-traded<br />
products have ill-considered structures<br />
and active-like costs? Absolutely. Those<br />
criticisms you can level. But don’t take on<br />
the free markets.<br />
FTSE China Local<br />
Market<br />
FXC China ETF London<br />
FXI China ETF US<br />
China<br />
Market: 21:00pm – 3:00am<br />
London<br />
Market: 3:00am – 11:30am<br />
US<br />
Market: 9:30am – 16:15pm<br />
ETFR • May 2007 9


