

US-Listed ETFs Sorted by Asset Class and Year-to-Date Return
US-Listed ETFs Sorted by Asset Class and Year-to-Date Return
US-Listed ETFs Sorted by Asset Class and Year-to-Date Return

You also want an ePaper? Increase the reach of your titles
YUMPU automatically turns print PDFs into web optimized ePapers that Google loves.
UPDATES<br />
www.indexuniverse.com/ETFR<br />
Commodity <strong>ETFs</strong><br />
And The Tax Man<br />
By Dennis Hudachek<br />
<strong>ETFs</strong> have opened doors <strong>to</strong> inaccessible<br />
asset classes, like commodities. Since<br />
the introduction of the SPDR Gold Trust<br />
(NYSE Arca: GLD) in 2004, ETF inves<strong>to</strong>rs<br />
have experienced growing opportunities<br />
in the commodities space. But with<br />
this new access comes new challenges:<br />
Unlike s<strong>to</strong>cks or bonds, commodities<br />
exposure works on an entirely different<br />
level in Uncle Sam’s eyes.<br />
Commodity <strong>ETFs</strong> come in three distinct<br />
structures: gran<strong>to</strong>r trusts, limited<br />
partnerships or exchange-traded notes<br />
(ETN). Knowing how each structure<br />
will affect your tax filing is a crucial<br />
part of the selection process, <strong>and</strong> can<br />
save you money on April 15.<br />
Note: The tax rates discussed here are<br />
relevant through the end of 2012, but are<br />
scheduled <strong>to</strong> change in 2013. Long-term<br />
gains apply <strong>to</strong> positions held for longer<br />
than one year; short-term gains apply <strong>to</strong><br />
positions held for one year or less.<br />
Limited Partnerships<br />
Exchange-traded products that use<br />
futures contracts in their portfolios<br />
are structured as limited partnerships.<br />
Many of the oldest <strong>ETFs</strong> in commodities<br />
are built this way, including the PowerShares<br />
DB Commodity Fund (NYSE<br />
Arca: DBC) <strong>and</strong> the United States Natural<br />
Gas Fund (NYSE Arca: UNG). Many<br />
futures-based commodity <strong>ETFs</strong> are<br />
regulated <strong>by</strong> the Commodity Futures<br />
Trading Commission as commodities<br />
pools. Since they’re classified as limited<br />
partnerships <strong>by</strong> the IRS, however, “limited<br />
partnership” will be used <strong>to</strong> refer<br />
<strong>to</strong> these funds here.<br />
Limited partnerships have unique tax<br />
implications. Currently, 60 percent of<br />
any gains are taxed at the long- 10<br />
Vol. 11 | No. 12<br />
December 2011<br />
IN THIS ISSUE<br />
Commodity <strong>ETFs</strong> follow three distinct<br />
structures, each with different tax rules.<br />
Learn how each structure works, <strong>and</strong><br />
how upcoming funds may affect your tax<br />
day paperwork.<br />
Page 1<br />
Jess Gaspar of Commonfund explains the<br />
ins <strong>and</strong> outs of the commodities complex<br />
in this special interview, from the construction<br />
of broad-based indexes <strong>to</strong> the everlasting<br />
allure of gold.<br />
Page 6<br />
Blair Shein, vice president of Compass<br />
Financial Group, shows why Indonesia holds<br />
a growing place in his clients’ portfolios <strong>and</strong><br />
how EIDO stacks up <strong>to</strong> its competition.<br />
Page 11<br />
ETFR’s monthly data bank covers all U.S.-<br />
listed <strong>ETFs</strong>, including assets, performance<br />
data <strong>and</strong> more.<br />
Pages 13-22<br />
News Highlights: iShares’ Archard,<br />
Kauffman CIO Testify To Congress;<br />
Vanguard Finally Files for Int’l Bond Funds;<br />
PowerShares Launches Financial <strong>ETFs</strong>;<br />
CurrencyShares Rolls Out Renminbi ETF …<br />
And much more!<br />
Pages 1-4<br />
iShares’ Archard, Kauffman CIO Testify To Congress<br />
The U.S. Senate held a subcommittee<br />
hearing on Wednesday, Oct. 19,<br />
<strong>to</strong> discuss the role that <strong>ETFs</strong> might be<br />
playing in driving market volatility <strong>and</strong><br />
whether they posing risks <strong>to</strong> the stability<br />
of the financial system.<br />
Noel Archard, managing direc<strong>to</strong>r at<br />
iShares, <strong>and</strong> Harold Bradley, chief investment<br />
officer at the nonprofit Kauffman<br />
Foundation, were among those testifying<br />
at the U.S. Senate Banking subcommittee<br />
hearing, “Market Microstructure: Examination<br />
of Exchange-Traded Funds (<strong>ETFs</strong>).”<br />
Also on the panel were Nasdaq’s Eric<br />
Noll, an executive at the exchange in<br />
charge of transaction services, as well<br />
as Eileen Rominger, the direc<strong>to</strong>r of the<br />
Securities <strong>and</strong> Exchange Commission’s<br />
Investment Management division, the<br />
Senate said on its website.<br />
The hearing <strong>to</strong>ok place at a time when<br />
many question whether <strong>ETFs</strong>—particularly<br />
leveraged <strong>and</strong> inverse <strong>ETFs</strong>—play a<br />
crucial role in driving increased market<br />
volatility. Others worry that short-selling<br />
in the ETF market represents a systemic<br />
risk <strong>to</strong> inves<strong>to</strong>rs.<br />
The hearing addressed several overarching<br />
concerns about <strong>ETFs</strong>, such as<br />
whether or not they add <strong>to</strong> market volatility<br />
<strong>and</strong> if the use of <strong>ETFs</strong> <strong>and</strong> indexing<br />
is slowing the issuance of initial public<br />
offerings. Three of the hearing participants—all<br />
but Bradley—felt strongly<br />
that, since ETF shares are traded between<br />
buyer <strong>to</strong> seller, there was little chance of
Based on underst<strong>and</strong>ing. Built on experience.<br />
FlexShares <strong>ETFs</strong>.<br />
For advisors<br />
who listen<br />
as much as<br />
Like you, we’ve built our reputation<br />
<strong>by</strong> listening <strong>to</strong> clients’ needs <strong>and</strong><br />
tailoring solutions around them.<br />
So we designed FlexShares <strong>ETFs</strong><br />
<strong>to</strong> address the specific challenges<br />
faced <strong>by</strong> a variety of inves<strong>to</strong>rs,<br />
like managing inflation risk or<br />
building their wealth. FlexShares<br />
leverage more than a century of<br />
experience from the world’s<br />
fourth-largest index manager.<br />
So you won’t just track the latest<br />
index. You’ll target real-world<br />
goals. For more information, visit<br />
flexshares.com/advisor or call<br />
1-855-FlexETF (1-855-353-9383).<br />
Or scan here <strong>to</strong> view our video.<br />
we do.<br />
CAPITAL APPRECIATION<br />
RISK MANAGEMENT<br />
INCOME GENERATION<br />
LIQUIDITY<br />
Before investing carefully consider the FlexShares investment objectives, risks, charges <strong>and</strong> expenses. This <strong>and</strong> other information<br />
is in the prospectus, a copy of which may be obtained <strong>by</strong> visiting www.flexshares.com. Read the prospectus carefully before you invest.<br />
Foreside Fund Services, LLC, distribu<strong>to</strong>r.<br />
An investment in FlexShares is subject <strong>to</strong> investment risk, including the possible loss of principal amount invested. Funds’<br />
returns may not match the returns of their respective indexes. The Funds may invest in emerging markets, derivatives <strong>and</strong><br />
concentrated sec<strong>to</strong>rs. In addition, the Funds may be subject <strong>to</strong> fluctuation of yield, income risk, interest rate risk, non-diversification<br />
risk, asset class risk <strong>and</strong> market risk. For a complete description of Fund risks please refer <strong>to</strong> the prospectus.
UPDATES<br />
IndexUniverse LLC.<br />
353 Sacramen<strong>to</strong> Street, Suite 1520<br />
San Francisco, CA 94111<br />
CEO<br />
Jim Wi<strong>and</strong>t<br />
415 659 9007<br />
Fax 415 659 9005<br />
jwi<strong>and</strong>t@indexuniverse.com<br />
COO<br />
Don Friedman<br />
415 659 9009<br />
dfriedman@indexuniverse.com<br />
Publisher & Direc<strong>to</strong>r of Sales<br />
Foster Wright<br />
646 867 4481<br />
fwright@indexuniverse.com<br />
Edi<strong>to</strong>r<br />
Matt Hougan<br />
mhougan@indexuniverse.com<br />
Managing Edi<strong>to</strong>r<br />
Cory Banks<br />
cbanks@indexuniverse.com<br />
Copy Edi<strong>to</strong>r<br />
Lisa Barr<br />
lbarr@indexuniverse.com<br />
Art Direc<strong>to</strong>r<br />
Jeannine Gaubert Pamoukdjian<br />
jpamoukdjian@indexuniverse.com<br />
Online Production Manager<br />
Juan Calderon<br />
jcaldero@indexuniverse.com<br />
SUBSCRIPTION INFORMATION<br />
The introduc<strong>to</strong>ry rate <strong>to</strong> subscribe <strong>to</strong> ETFR is<br />
$279 annually. Subscribe <strong>by</strong> contacting Ivana<br />
Zivkovic at izivkovic@indexuniverse.com or <strong>by</strong><br />
calling 415-659-9029.<br />
COPYRIGHT STATEMENT<br />
© 2011 IndexUniverse LLC. All rights reserved.<br />
The text, images <strong>and</strong> other materials contained or<br />
displayed are proprietary <strong>to</strong> IndexUniverse LLC, except<br />
where otherwise noted, <strong>and</strong> constitute valuable<br />
intellectual property. No material from any part of<br />
any IndexUniverse LLC publication, product, service,<br />
report, e-mail or Web site may be downloaded, transmitted,<br />
broadcast, transferred, assigned, reproduced<br />
or in any other way used or otherwise disseminated in<br />
any form <strong>to</strong> any person or entity, without the explicit<br />
written consent of IndexUniverse LLC.<br />
For permission <strong>to</strong> pho<strong>to</strong>copy <strong>and</strong> use material electronically,<br />
please contact reprints@indexuniverse.com or<br />
call 415-659-9004.<br />
market movement impact. The IPO impact<br />
was largely dismissed as well: The<br />
proliferation of new <strong>and</strong> different indexes<br />
created for <strong>ETFs</strong> would be a reason<br />
for management <strong>to</strong> be confident in<br />
an IPO, instead of skittish.<br />
Another issue raised <strong>by</strong> Mr. Archard<br />
concerned uniform labeling st<strong>and</strong>ards,<br />
which would exclude leveraged, inverse<br />
<strong>and</strong> derivative products from the<br />
ETF label. As of yet, little support exists<br />
for such an initiative.<br />
Vanguard Plans<br />
Int’l Bond Funds—Finally<br />
After years of deliberation on international<br />
bonds as a worthy investment, Vanguard<br />
Group filed paperwork with the<br />
SEC in Oc<strong>to</strong>ber for two bonds—one focused<br />
on investment-grade debt outside<br />
the United States <strong>and</strong> the other on sovereign<br />
credits from emerging markets.<br />
The two funds <strong>and</strong> the estimated<br />
expense ratios of the ETF versions are:<br />
• Vanguard Total International Bond<br />
Index Fund, 0.30 percent<br />
• Vanguard Emerging Markets Government<br />
Bond Index Fund, 0.35 percent<br />
The international bond fund will be<br />
hedged, meaning that whatever currency<br />
exposure a given bond has will<br />
be neutralized <strong>by</strong> the fund’s hedging<br />
strategy, Vanguard said in a press release.<br />
The emerging markets fund will<br />
meanwhile own dollar-denominated<br />
credits, according <strong>to</strong> the filing.<br />
By hedging currency exposure, Vanguard<br />
said the fund’s returns should<br />
more closely correlate with the underlying<br />
performance of international bonds<br />
without currency dis<strong>to</strong>rtions. Vanguard,<br />
citing Lipper Inc. research, said most<br />
international bond funds offered <strong>to</strong>day<br />
don’t use hedging strategies.<br />
PowerShares Launches<br />
Financial <strong>ETFs</strong><br />
Invesco PowerShares launched four<br />
new financial-industry <strong>ETFs</strong> in Oc<strong>to</strong>ber,<br />
based on the same KBW indexes State<br />
Street Global Advisors s<strong>to</strong>pped using<br />
on a group of similar funds.<br />
The new <strong>ETFs</strong> <strong>and</strong> their tickers are:<br />
• PowerShares KBW Bank Portfolio<br />
(NYSE Arca: KBWB)<br />
• PowerShares KBW Capital Markets Index<br />
(NYSE Arca: KBWC)<br />
• PowerShares KBW Insurance Portfolio<br />
(NYSE Arca: KBWI)<br />
• PowerShares KBW Regional Banking<br />
Portfolio (NYSE Arca: KBWR)<br />
The funds target various pockets of<br />
the financial sec<strong>to</strong>r, no doubt set <strong>to</strong> be<br />
a crucial part of the broader recovery.<br />
Industry sources said PowerShares was<br />
contemplating filing a lawsuit <strong>to</strong> block<br />
SSgA from reintroducing the SSgA funds<br />
before the PowerShares launch. Those<br />
SSgA funds include the $1.19 billion<br />
SPDR S&P Bank ETF (NYSE Arca: KBE)<br />
<strong>and</strong> also the SPDR S&P Regional Banking<br />
ETF (NYSE Arca: KRE), a $47 million fund<br />
that also happens <strong>to</strong> be one of the most<br />
heavily shorted <strong>ETFs</strong> on the market.<br />
SSgA officials declined <strong>to</strong> comment<br />
on financial aspects of its indexing<br />
agreements with either S&P or KBW.<br />
CurrencyShares<br />
Rolls Out Renminbi ETF<br />
In Oc<strong>to</strong>ber, CurrencyShares rolled out a<br />
currency ETF that is designed <strong>to</strong> reflect<br />
the value of China’s currency in dollars.<br />
The CurrencyShares Chinese Renminbi<br />
Trust (NYSE Arca: FXCH) takes advantage<br />
of China’s commitment <strong>to</strong> let its<br />
currency appreciate against the U.S. dollar.<br />
That upward trend has been halted in<br />
times of crisis, but its upward trend over<br />
time is widely considered inevitable.<br />
Moreover, some sources believe<br />
currency appreciation is a <strong>to</strong>ol China<br />
will use <strong>to</strong> tame inflationary pressures<br />
as its economy grows. A stronger currency<br />
would soften the blow of inflation<br />
<strong>by</strong> increasing purchasing power<br />
for China as it seeks out goods <strong>and</strong><br />
services in global markets.<br />
FXCH has an annual expense ratio<br />
of 0.40 percent.<br />
iShares Launches<br />
Local Currency Bond ETF<br />
BlackRock unit iShares launched a local<br />
currency bond ETF in Oc<strong>to</strong>ber, focused<br />
on the emerging markets. The iShares<br />
Emerging Markets Local Currency Bond<br />
Fund (NYSE Arca: LEMB) has an annual<br />
expense ratio of 0.60 percent, making<br />
it more expensive than the competing<br />
funds already on the market.<br />
LEMB will track a Barclays Capital<br />
ETFR • December 2011 3
UPDATES<br />
benchmark that tracks debt from Brazil,<br />
Chile, Egypt <strong>and</strong> Hungary. The fund will use<br />
a representative sampling strategy rather<br />
than replicate the credits in the index.<br />
The competing WisdomTree Emerging<br />
Markets Local Debt ETF (NYSE Arca: ELD)<br />
had $1.12 billion in assets under management<br />
as of Oct. 18, while Van Eck’s Market<br />
Vec<strong>to</strong>rs Emerging Markets Local Currency<br />
Bond ETF (NYSE Arca: EMLC) had<br />
$504 million, according <strong>to</strong> data compiled<br />
<strong>by</strong> IndexUniverse. Both were rolled out a<br />
bit more than a year ago.<br />
Schwab Debuts<br />
Dividend ETF<br />
In Oc<strong>to</strong>ber, Charles Schwab rolled out a<br />
high-dividend ETF that will undercut the<br />
price on two dividend-focused <strong>ETFs</strong> from<br />
Vanguard Group.<br />
The Schwab <strong>US</strong> Dividend Equity ETF<br />
(NYSE Arca: SCHD) comes with an expense<br />
ratio of 0.18 percent, just below the<br />
0.18 percent cost of both the Vanguard<br />
High Dividend Yield Index ETF (NYSE<br />
Arca: VYM) <strong>and</strong> the Vanguard Dividend<br />
Appreciation ETF (NYSE Arca: VIG).<br />
Dividend-focused investments loom<br />
largely in an investment universe fraught<br />
with volatility. Getting a reliable payout<br />
is a welcome option among inves<strong>to</strong>rs<br />
tired out <strong>by</strong> the market’s gyrations<br />
<strong>and</strong> frustrated <strong>by</strong> low yields on many<br />
bond investments.<br />
Schwab said its dividend-focused<br />
ETF, which will choose companies that<br />
consistently pay dividends <strong>and</strong> have<br />
strong “financial ratios” relative <strong>to</strong> their<br />
peers, is based on the Dow Jones U.S.<br />
Dividend 100 Index. That benchmark is<br />
a subset, excluding REITs, of the Dow<br />
Jones U.S. Broad Market Index, according<br />
<strong>to</strong> regula<strong>to</strong>ry filings.<br />
AdvisorShares Launches<br />
ETF With TrimTabs<br />
AdvisorShares launched an ETF in Oc<strong>to</strong>ber,<br />
with TrimTabs as advisor. The AdvisorShares<br />
TrimTabs Float Shrink ETF<br />
(NYSE Arca: TTFS) seeks <strong>to</strong> beat the Russell<br />
3000 Index <strong>by</strong> picking s<strong>to</strong>cks with<br />
liquidity <strong>and</strong> fundamental characteristics<br />
that his<strong>to</strong>rically have superior long-term<br />
performance, according <strong>to</strong> information<br />
on AdvisorShares’ website.<br />
TTFS recalls some of the passive strategies<br />
based on enhanced beta that screen<br />
securities for variables such as low beta<br />
or volatility, only in this case the security<br />
selection will be based on research that<br />
focuses on s<strong>to</strong>ck prices as a function of<br />
supply <strong>and</strong> dem<strong>and</strong> rather than value.<br />
The advisor, TrimTabs <strong>Asset</strong> Management,<br />
is a unit of TrimTabs Investment<br />
Research. The new ETF comes with an annual<br />
expense ratio of 0.99 percent.<br />
Russell Plans<br />
6 Active <strong>US</strong> Equity <strong>ETFs</strong><br />
Russell Investments filed regula<strong>to</strong>ry paperwork<br />
with the SEC in Oc<strong>to</strong>ber <strong>to</strong> market<br />
six actively managed <strong>ETFs</strong> that target<br />
U.S. equities <strong>by</strong> size <strong>and</strong> style.<br />
The six funds are:<br />
• Russell Large Cap ETF<br />
• Russell Large Cap Growth ETF<br />
• Russell Large Cap Value ETF<br />
• Russell All Cap ETF<br />
• Russell Mid Cap ETF<br />
• Russell Small Cap ETF<br />
The lead portfolio manager for all six<br />
funds is Robert Kuharic, who has been<br />
in various money management activities<br />
at Russell since 2005. The funds will also<br />
make use of a multimanager approach.<br />
The additional managers will be unaffiliated<br />
<strong>and</strong> given the discretion <strong>to</strong> utilize<br />
a variety of investing styles, including<br />
ones focusing on growth, value <strong>and</strong>/or<br />
market-oriented, according <strong>to</strong> the filing.<br />
UBS Launches<br />
2X Cloud Computing ETN<br />
UBS released <strong>to</strong> market a double-exposure<br />
exchange-traded note targeting the<br />
world of cloud computing, bringing it<br />
in<strong>to</strong> competition with a so-far successful<br />
single-exposure ETF that First Trust<br />
brought <strong>to</strong> market during the summer.<br />
The ETRACS Monthly 2xLeveraged ISE<br />
Cloud Computing TR Index ETN due Oc<strong>to</strong>ber<br />
4, 2041 (NYSE Arca: LSKY) seeks <strong>to</strong><br />
match the performance of the ISE Cloud<br />
Computing Index, the same benchmark<br />
that First Trust’s “SKYY” is based on. Its<br />
exposure is compounded monthly.<br />
Cloud computing refers <strong>to</strong> computer<br />
users accessing many different servers <strong>to</strong><br />
meet their needs, as opposed <strong>to</strong> using<br />
centralized computing resources. The<br />
UBS ETN comes with an annual expense<br />
ratio of 0.60 percent, the same as SKYY’s.<br />
Russell Launches<br />
3 Int’l Fac<strong>to</strong>r-Based <strong>ETFs</strong><br />
Russell Investments last month launched<br />
three non-U.S. international “fac<strong>to</strong>rbased”<br />
<strong>ETFs</strong>. The three funds, which<br />
all have net annual expense ratios of<br />
0.25 percent, are:<br />
• Russell Developed ex-U.S. Low Beta ETF<br />
(NYSE Arca: XLBT)<br />
• Russell Developed ex-U.S. Low Volatility<br />
ETF (NYSE Arca: XLVO)<br />
• Russell Development ex-U.S. High Momentum<br />
ETF (NYSE Arca: XHMO)<br />
All three <strong>ETFs</strong> are “intelligent beta”<br />
products that go beyond the plain-vanilla<br />
market-cap-weighted funds that dominate<br />
the industry. Such smart beta products<br />
cherry-pick securities with certain<br />
characteristics with a view <strong>to</strong> managing<br />
risk the way an active manager might,<br />
only with rules-based indexes instead.<br />
And as is common with U.S. <strong>ETFs</strong> that<br />
track foreign s<strong>to</strong>cks, some of the assets<br />
in the Russell <strong>ETFs</strong> are likely <strong>to</strong> be in the<br />
form of depositary receipts, which offer<br />
greater liquidity, but can also introduce<br />
larger tracking errors. Russell has said the<br />
tracking error on the <strong>ETFs</strong> isn’t likely <strong>to</strong> be<br />
more than 5 percent.<br />
Direxion Sets Reverse<br />
Split On 6 <strong>ETFs</strong><br />
Direxion planned reverse share splits on<br />
six of its <strong>ETFs</strong> applying <strong>to</strong> shareholders<br />
of record after the Nov. 9 market close.<br />
Reverse splits are designed <strong>to</strong> raise pershare<br />
prices on each of the securities.<br />
Five will be 1-for-5 reverse splits, Direxion<br />
said in a press release. Those affected<br />
securities are:<br />
• Direxion Daily Real Estate Bear 3x<br />
Shares (NYSE Arca: DRV)<br />
• Direxion Daily Emerging Markets Bull<br />
3x Shares (NYSE Arca: EDC)<br />
• Direxion Daily Financial Bull 3x Shares<br />
(NYSE Arca: FAS)<br />
• Direxion Daily Latin America Bull 3x<br />
Shares (NYSE Arca: LBJ)<br />
• Direxion Daly 20+ Treasury Bear 3x<br />
Shares (NYSE Arca: TMV)<br />
The sixth will be a 1-for-3 reverse split,<br />
the company said. That ETF is:<br />
• Direxion Daily Russia Bull 3x Shares<br />
(NYSE Arca: R<strong>US</strong>L)<br />
Each of the <strong>ETFs</strong> will be offered on a postsplit<br />
basis on Nov. 10, Direxion said. <br />
4 ETFR • December 2011
Commonfund’s Gaspar:<br />
Why You Should Own Commodities<br />
By Cory Banks<br />
Commodities are gaining ground in the<br />
ETF world. Long considered the purview of<br />
hardcore traders, producers <strong>and</strong> inves<strong>to</strong>rs<br />
with millions of dollars in margin, the doors<br />
<strong>to</strong> this asset class have been thrown open<br />
<strong>by</strong> exchange-traded products. Some of<br />
the largest ETPs in the industry track commodities,<br />
whether through benchmarks<br />
like the Dow Jones-UBS Commodity Index,<br />
subsection indexes for specific commodity<br />
markets, single commodities or even the<br />
spot price of physical commodities.<br />
Because of the overwhelming potential,<br />
many in the markets are bullish<br />
on the role of commodities in an inves<strong>to</strong>r’s<br />
portfolio. One of those bulls is Jess<br />
Gaspar, head of Quantitative Research at<br />
Commonfund <strong>Asset</strong> Management <strong>and</strong> coauthor<br />
of “Commodity Investing: Maximizing<br />
<strong>Return</strong>s Through Fundamental<br />
Analysis.” Gaspar believes in the growing<br />
importance of oil, agricultural <strong>and</strong> other<br />
commodity markets in an investment<br />
portfolio. Speaking with ETFR Managing<br />
Edi<strong>to</strong>r Cory Banks, Gaspar explained what<br />
makes these products so important, <strong>and</strong><br />
what drives their performance.<br />
ETFR: Why should inves<strong>to</strong>rs consider<br />
commodities as an asset class?<br />
GASPAR: First, over the last 10 years,<br />
commodities have had equitylike returns<br />
with equitylike volatility. Secondly,<br />
they have his<strong>to</strong>rically had low correlation<br />
with s<strong>to</strong>cks, bonds <strong>and</strong> most other<br />
asset classes. The third reason is that<br />
you’ve got a relatively high correlation<br />
with inflation. There are very few quality<br />
inflation hedges. It’s an imperfect world<br />
when you’re trying <strong>to</strong> protect yourself<br />
from inflation, <strong>and</strong> commodities are one<br />
of the few asset classes that can actually<br />
help you out. Finally, commodities indices<br />
are composed of futures, which are<br />
the most liquid markets in the world.<br />
ETFR: Is it possible <strong>to</strong> index broad commodities?<br />
Jess Gaspar<br />
GASPAR: If you can make the right calls<br />
on individual commodities, go for it. If<br />
you’re less confident in your ability <strong>to</strong><br />
make the right calls, then you buy indexes.<br />
When we’re talking about investing<br />
in commodity futures, they are an<br />
investment that is really predicated on<br />
the value of a particular commodity at a<br />
particular point in time.<br />
Why do commodity investments<br />
make money? The No. 1 reason is you<br />
get the collateral return. When you<br />
buy a future, it’s basically setting aside<br />
margins, no money down. So you earn<br />
your collateral. For most folks, that’s T-<br />
bills. And in some periods, unlike the<br />
present, T-bills can actually have a decent<br />
rate of return.<br />
The second reason is insurance. This is<br />
why most people would argue that commodities<br />
are an attractive investment.<br />
Producers of commodities tend <strong>to</strong> have<br />
long time frames. They need <strong>to</strong> put in<br />
place plants or mines or facilities <strong>to</strong> make<br />
a commodity. When they’re thinking<br />
about a large capital expenditure, they<br />
don’t want <strong>to</strong> take a huge risk. They have<br />
no revenues associated or low revenues<br />
associated with that capital expenditure.<br />
What they want <strong>to</strong> do is sell forward<br />
their production. They’re willing <strong>to</strong> pay<br />
a little bit extra <strong>to</strong> get rid of the risk. So<br />
commodities inves<strong>to</strong>rs are earning the<br />
insurance premium provided <strong>by</strong> producers<br />
<strong>and</strong> other long-term sellers.<br />
The third reason you make money in<br />
commodities is rebalancing. There are<br />
19 commodities in the Dow Jones-UBS<br />
Index <strong>and</strong> it rebalances. The index ends<br />
up selling the expensive commodities<br />
<strong>and</strong> buying the cheap ones. And that<br />
rebalancing itself is a source of return<br />
when there are instruments that are imperfectly<br />
correlated with one another.<br />
And then the fourth reason—<strong>and</strong> I<br />
think this is a little more subtle—is convenience<br />
yield. If there is a product that, in<br />
some states of the world could be scarce,<br />
it’s pretty helpful <strong>to</strong> have it. If there is<br />
an environment where you might not<br />
be able <strong>to</strong> get food, you’d be in a lot of<br />
trouble. So you will s<strong>to</strong>re a little bit.<br />
Well, what happens is that for most<br />
inven<strong>to</strong>ry levels of corn or beans or<br />
wheat or whatever it might be, there is<br />
a fairly calm relationship between the<br />
inven<strong>to</strong>ry level <strong>and</strong> the price of the underlying<br />
product. When inven<strong>to</strong>ries get<br />
scarce, it gets highly nonlinear. They call<br />
it a hockey stick. And the reason is because<br />
if you can’t get it, you’re going<br />
<strong>to</strong> pay whatever you can because you<br />
don’t want <strong>to</strong> starve. Now that’s clearly<br />
an exaggeration of reality.<br />
However, if you can’t get heating<br />
oil or natural gas, you’re going <strong>to</strong> pay<br />
a pretty high price in the winter. If you<br />
can’t get copper <strong>to</strong> produce cars, <strong>and</strong><br />
it’s going <strong>to</strong> hold up your entire production<br />
process, you’re going <strong>to</strong> pay a lot for<br />
copper. So there’s this region of inelastic<br />
dem<strong>and</strong> when you have small inven<strong>to</strong>ries<br />
that can really lead <strong>to</strong> profitable spikes in<br />
prices. So, one of the benefits of holding<br />
commodity futures <strong>and</strong> commodities in<br />
general is you can earn some premium in<br />
those times of shortage.<br />
6 ETFR • December 2011
Inside<strong>ETFs</strong><br />
PORTFOLIO MANAGEMENT<br />
<br />
5 th annual<br />
conference<br />
2012<br />
InsideCommodities<br />
<br />
InsideIndexing InsideCommodities<br />
www.Inside<strong>ETFs</strong>Conference.com /ETFR<br />
From the producers of:<br />
InsideCommodities<br />
Inside<strong>ETFs</strong>Europe<br />
InsideIndexing<br />
January 22-24, 2012<br />
InsideIndexing Inside<strong>ETFs</strong><br />
<br />
Designed specifically for FINANCIAL ADVISORS<br />
Inside<strong>ETFs</strong>Europe<br />
Featured Speakers Include:<br />
Inside<strong>ETFs</strong>Europe<br />
Inside<strong>ETFs</strong><br />
Inside<strong>ETFs</strong><br />
Tom Dorsey<br />
President, Founding<br />
Member, Dorsey Wright<br />
& Associates<br />
Bur<strong>to</strong>n Malkiel<br />
Professor of Economics<br />
Prince<strong>to</strong>n University<br />
Ben Mezrich<br />
Author of<br />
“The Accidental<br />
Billionaires”<br />
Michael Milken<br />
Chairman<br />
The Milken Institute<br />
Robert Shiller<br />
Professor of Economics<br />
Yale University<br />
Conference attendees will be able <strong>to</strong>:<br />
Network with more than 650 financial advisors<br />
Gain access <strong>to</strong> over 30 informative sessions<br />
including our LIVE ETF Trading Seminar<br />
Participate in our NEW ETF Expert Track<br />
Celebrate the industry’s achievements at our<br />
inaugural IndexUniverse ETF Awards Dinner<br />
Meet with representatives from every<br />
ETF issuer<br />
TAKE ADVANTAGE OF OUR FINANCIAL ADVISOR RATE:<br />
www.Inside<strong>ETFs</strong>Conference.com/ETFR or call 415-659-9006<br />
Presented <strong>by</strong>:
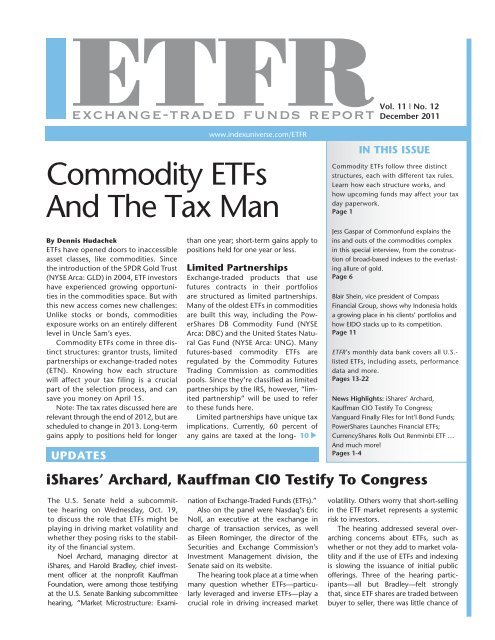
Figure 1<br />
10 Commodity <strong>ETFs</strong> To Watch In 2012<br />
TickeR NAme focuS Aum ($m)<br />
CORN Teucrium Corn Corn 99.45 1.49<br />
<strong>US</strong>CI United States Commodity Broad Market 426.05 0.95<br />
DBA PowerShares DB Agriculture Broad Market 2,408.17 0.85<br />
<strong>US</strong>O United States Oil Crude Oil 1,344.85 0.45<br />
BNO United States Brent Oil Crude Oil 77.19 0.75<br />
IAU iShares Gold Trust Gold 9,690.93 0.25<br />
GLD SPDR Gold Gold 72,650.29 0.40<br />
SLV iShares Silver Silver 10,877.36 0.50<br />
MOO Market Vec<strong>to</strong>rs Agribusiness Agriculture Equity 5,795.49 0.56<br />
SOYB Teucrium Soybeans Soybeans 2.19 1.00<br />
Source: IndexUniverse<br />
ETFR: Each commodity market is distinct<br />
from one another. Do broad-based commodities<br />
indexes make sense? Should we<br />
be talking about gold <strong>and</strong> corn in the<br />
same benchmark?<br />
GASPAR: If you were <strong>to</strong> use a mathematical<br />
program <strong>to</strong> sit down <strong>and</strong><br />
construct an optimal portfolio of commodities,<br />
it might not look like the indices<br />
that we currently have. They are<br />
intended <strong>to</strong> be what I would call reasonably<br />
robust <strong>and</strong> intuitive.<br />
You look at three primary things.<br />
One is, how important is this commodity<br />
in world production? How large is<br />
crude oil compared <strong>to</strong> coffee? Well,<br />
you’re going <strong>to</strong> have a much bigger<br />
weight in crude oil because it’s a much<br />
bigger part of the economy.<br />
The second part is, how liquid is the<br />
market in which it trades? You probably<br />
want <strong>to</strong> have more position in more liquid<br />
markets. And then the third piece is what I<br />
would call “robustness” criteria. You don’t<br />
want <strong>to</strong> be <strong>to</strong>o concentrated in any particular<br />
thing. By combining those things<br />
<strong>to</strong>gether, I think you can build an intuitive<br />
index that makes reasonable sense.<br />
A lot of the recent work on the index<br />
side has been on constructing dynamic<br />
indices that shift across commodities,<br />
<strong>to</strong> try <strong>and</strong> take advantage of surpluses<br />
<strong>and</strong> shortages. A passive index may be<br />
less efficient than an active index. But<br />
when you take active risk, it’s a different<br />
exP<br />
RATio<br />
source of risk. You have <strong>to</strong> make your<br />
own judgment as <strong>to</strong> whether you think<br />
active risk is a worthy investment on the<br />
commodities side.<br />
ETFR: So much of the commodities bull<br />
s<strong>to</strong>ry is about China. What happens if<br />
China has a hard l<strong>and</strong>ing?<br />
GASPAR: China is a very small, poor,<br />
rural, agricultural society that is shifting<br />
<strong>to</strong> an industrializing, more advanced,<br />
urban society. That process has a lot of<br />
characteristics. One of the most important<br />
characteristics for commodities is it<br />
involves industrialization <strong>and</strong> urbanization,<br />
which are extremely commodity<br />
intensive. They are rapacious consumers<br />
of commodities.<br />
In the last 10 years, that process has<br />
kicked in<strong>to</strong> full gear, which is creating<br />
very large rapid growth <strong>and</strong> dem<strong>and</strong><br />
suddenly. So the supply, which normally<br />
would grow, may not have had<br />
enough time yet <strong>to</strong> reappear. That leads<br />
me <strong>to</strong> be a short-run Malthusian <strong>and</strong> a<br />
long-run technologist. Malthus basically<br />
says, “Look. We’re going <strong>to</strong> run out of<br />
these natural resources. And that’s going<br />
<strong>to</strong> keep humanity from getting very<br />
wealthy.” And in the short run, that can<br />
certainly be true. In the long run, we have<br />
<strong>to</strong> be more technologists, because man<br />
has been incredibly ingenious in devising<br />
new <strong>and</strong> better gadgets <strong>and</strong> widgets <strong>and</strong><br />
finding alternatives <strong>to</strong> substitute for the<br />
way things have been done in the past.<br />
But whether China will have a hard<br />
l<strong>and</strong>ing is not entirely clear. What<br />
should be evident is that the <strong>to</strong>rrential<br />
growth rate that China has had the last<br />
decade or two has <strong>to</strong> slow down, because<br />
they’ve gone from this heavily<br />
rural labor force <strong>to</strong> a slightly less rural labor<br />
force. They’ve already moved quite<br />
far along that technological frontier <strong>to</strong>wards<br />
where the U.S., Japan <strong>and</strong> other<br />
leading nations are.<br />
That doesn’t mean China is going<br />
<strong>to</strong> slow down dramatically, but they’re<br />
probably not going <strong>to</strong> grow at the pace<br />
they have in the past.<br />
ETFR: We’re talking about China simply<br />
from the perspective of dem<strong>and</strong>. Does<br />
China have an impact on supply?<br />
GASPAR: It does. But China is not particularly<br />
resource abundant. Its abundant<br />
resource is labor. They are already<br />
importing corn from the U.S., <strong>and</strong><br />
they’re major importers of the metals<br />
<strong>and</strong> of energy. So they are really one of<br />
these countries that are coming online<br />
that has lots of labor <strong>and</strong> not so much<br />
natural resources.<br />
Brazil is the reverse. Brazil has <strong>to</strong>ns of<br />
natural resources.<br />
ETFR: Would you consider Brazil a big<br />
player in commodities?<br />
GASPAR: Yes, definitely. Brazil is a significant<br />
exporter of grains. They are an exporter<br />
of iron ore <strong>and</strong> other things as well.<br />
ETFR: You had mentioned inflation concerns<br />
in the overall case for commodities.<br />
Can you go in<strong>to</strong> more detail on that?<br />
GASPAR: Sure. These gigantic government<br />
debt levels <strong>and</strong> large budget deficits<br />
will have <strong>to</strong> be resolved somehow or<br />
other. One way they can be resolved is <strong>to</strong><br />
grow faster. Now, none of us has a magic<br />
but<strong>to</strong>n that says, “Grow faster.” We don’t<br />
really know how <strong>to</strong> do that yet. The second<br />
way we can address those budget<br />
deficits <strong>and</strong> debts is <strong>to</strong> cut spending, but<br />
that’s hard <strong>to</strong> do, <strong>to</strong>o. Thirdly, we can<br />
raise taxes, which nobody likes.<br />
The fourth option is inflation. When<br />
you have 5 percent inflation, every dollar<br />
is now worth 95 cents next year.<br />
People see the dollar in their h<strong>and</strong>, they<br />
8 ETFR • December 2011
don’t think about the real value of the<br />
dollar. They’re not necessarily cognizant<br />
of the fact that the money that they’ve<br />
got in the bank can’t buy as much now<br />
as it did the year before.<br />
But there are two impediments <strong>to</strong> inflation.<br />
One is that central banks have<br />
this hard-won independence <strong>and</strong> credibility<br />
over inflation-fighting. They don’t<br />
want <strong>to</strong> lose that.<br />
I think the larger concern with inflation<br />
is that a future administration which<br />
is more populist gets rid of someone like<br />
Ben Bernanke <strong>and</strong> throws in somebody<br />
who is much less concerned about inflation,<br />
which is called a tail risk. If that happens,<br />
then we could really get substantial<br />
inflation, even double-digit inflation,<br />
potentially. It’s something that people<br />
should be paying attention <strong>to</strong> <strong>and</strong> appropriately<br />
hedging their portfolios for.<br />
Figure 2<br />
ETFR: Does gold ever come up in that hedge?<br />
GASPAR: It does. There are three<br />
camps: those who love gold, those who<br />
hate gold <strong>and</strong> then those who just don’t<br />
pay attention <strong>to</strong> it. I’m in that middle<br />
crowd. And the reason is because gold<br />
really plays the role of an alternative currency.<br />
If you don’t have confidence in<br />
your own currency, you go <strong>to</strong> gold.<br />
But the only reason gold works is<br />
because people think gold works. If nobody<br />
thought gold was a good s<strong>to</strong>red<br />
value, then it wouldn’t be.<br />
Now, over the last 45 years, commodity<br />
indices broadly returned about<br />
18 percent a year. Between them, equities<br />
<strong>and</strong> bonds average about 1 percent.<br />
So that’s an example of a situation where<br />
But the only<br />
reason gold works<br />
is because people<br />
think gold works.<br />
If nobody thought<br />
gold was a good<br />
s<strong>to</strong>red value, then it<br />
wouldn’t be.<br />
commodities are—or at least have been<br />
his<strong>to</strong>rically—very attractive investments.<br />
And gold is part of that.<br />
ETFR: Do you think commodities, as an<br />
asset class, are going <strong>to</strong> continue like<br />
that? That’s just such a big number compared<br />
<strong>to</strong> equities <strong>and</strong> bonds.<br />
GASPAR: Yeah. That’s a pretty extreme<br />
outcome. I’m not going <strong>to</strong> assert that<br />
that’s going <strong>to</strong> happen again. But it is<br />
suggestive of some of the forces at work<br />
in an environment where interest rates<br />
have been kept low for a long time. Suppose<br />
you park your money in the bank.<br />
Back <strong>to</strong> that earlier point, you’re losing<br />
the rate of inflation every year, because<br />
you’re not earning any interest rate on<br />
that. So you just lose [<strong>to</strong>] inflation.<br />
So why should you bother? Why not<br />
buy gold <strong>and</strong>, in the event that gold<br />
prices rise, you make some returns? And<br />
it doesn’t cost you anything <strong>to</strong> finance<br />
it, because that interest rate is zero.<br />
ETFR: Do you think commodity investments<br />
require more diligence than s<strong>to</strong>cks,<br />
than bonds?<br />
GASPAR: It’s a different set of things<br />
you have <strong>to</strong> focus on. To be a very good<br />
equity inves<strong>to</strong>r, you need <strong>to</strong> underst<strong>and</strong><br />
the fundamentals of a company, <strong>and</strong><br />
that takes resources <strong>and</strong> time. To be a<br />
very good inves<strong>to</strong>r of commodities, you<br />
have <strong>to</strong> do the same thing. You’re still<br />
looking at fundamentals, they’re just<br />
different fundamentals.<br />
You want <strong>to</strong> underst<strong>and</strong> the weather<br />
for corn <strong>and</strong> beans <strong>and</strong> other agricultural<br />
commodities. You’re going <strong>to</strong> want <strong>to</strong><br />
look at dem<strong>and</strong> <strong>and</strong> supply <strong>and</strong> all those<br />
types of things. Perhaps people aren’t<br />
accus<strong>to</strong>med <strong>to</strong> looking at those types of<br />
information, because it’s a different set<br />
of information. <br />
Five Upcoming Commodity <strong>ETFs</strong> In Registration<br />
eTf<br />
Why iT’S iNTeReSTiNG<br />
Market Vec<strong>to</strong>rs<br />
Unconventional Oil & Gas ETF<br />
United States Asian Commodity Basket Fund<br />
Invests in companies engaged in the production of oil <strong>and</strong> gas via nontraditional methods.<br />
Holds futures contracts in commodities important <strong>to</strong> Asian economies.<br />
Teucrium Agricultural Fund<br />
SSgA Real <strong>Asset</strong>s Fund<br />
iShares Copper Trust<br />
Invests equally in Teucrium’s futures-based funds covering corn, wheat, soybeans <strong>and</strong> sugar.<br />
An actively managed fund that invests in ETPs with exposure <strong>to</strong> futures, producers,<br />
inflation-protected securities <strong>and</strong> real estate securities.<br />
A gran<strong>to</strong>r trust holding physical copper. Similar funds from JP Morgan <strong>and</strong> ETF<br />
Securities are also in registration.<br />
ETFR • December 2011 9
Commodity <strong>ETFs</strong> from page 1<br />
term capital gains rate of 15 percent,<br />
with the remaining 40 percent taxed<br />
at the inves<strong>to</strong>r’s ordinary income rate,<br />
regardless of how long the shares are<br />
held. This comes out <strong>to</strong> a blended maximum<br />
capital gains rate of 23 percent.<br />
Limited partnership <strong>ETFs</strong> are also<br />
considered pass-through investments,<br />
so the trust is “marked-<strong>to</strong>-market” at<br />
the end of each year. Any gains accrued<br />
are passed on <strong>to</strong> its inves<strong>to</strong>rs, potentially<br />
creating a taxable event. This means<br />
that your cost basis adjusts at year-end<br />
<strong>and</strong> you can be subject <strong>to</strong> pay taxes on<br />
gains regardless of whether or not you<br />
sold your shares.<br />
Finally, for tax reporting, limited<br />
partnership <strong>ETFs</strong> also generate a Schedule<br />
K-1 form. These forms often create<br />
uncertainty <strong>and</strong> annoyance for the average<br />
inves<strong>to</strong>r not familiar with K-1s when<br />
they receive these forms in the mail.<br />
These forms can also be mailed out later<br />
than 1099s, which can add <strong>to</strong> frustration<br />
on the part of some inves<strong>to</strong>rs looking <strong>to</strong><br />
get their taxes out of the way early.<br />
Exchange-Traded Notes<br />
Limited partnerships may seem complicated,<br />
but they’re not the only option.<br />
In fact, of the 135 commodity products<br />
available as of Oct. 31, the vast majority—87—are<br />
actually ETNs.<br />
Instead of holding physical commodities<br />
or futures, ETNs are unsecured, unsubordinated<br />
debt notes issued <strong>by</strong> banks<br />
that promise <strong>to</strong> provide the return of a<br />
specific index. This means they carry<br />
credit risk: If the bank issuing the note<br />
goes bankrupt or defaults, inves<strong>to</strong>rs can<br />
lose their entire investment.<br />
Popular commodity ETNs include the<br />
iPath Dow Jones UBS Commodity ETN<br />
(NYSE Arca: DJP), the Elements Rogers<br />
International Commodity ETN (NYSE<br />
Arca: RJI) <strong>and</strong> the iPath S&P GSCI Crude<br />
Oil ETN (NYSE Arca: OIL).<br />
From a tax st<strong>and</strong>point, ETNs have<br />
some distinct advantages for longterm<br />
inves<strong>to</strong>rs. They’re currently taxed<br />
like equity funds <strong>and</strong> get reported on a<br />
1099 form—long-term gains are taxed<br />
at 15 percent (note that this is for<br />
commodity ETNs; currency ETNs are<br />
taxed differently).<br />
Gran<strong>to</strong>r Trusts<br />
The final structure—gran<strong>to</strong>r trusts—<br />
are used for “physically held” precious<br />
metals <strong>ETFs</strong>, such as the SPDR Gold<br />
Trust (NYSE Arca: GLD), the iShares Silver<br />
Trust (NYSE Arca: SLV) <strong>and</strong> the ETFS<br />
Physical Swiss Gold Shares (NYSE Arca:<br />
SGOL). <strong>ETFs</strong> like these s<strong>to</strong>re bullion in<br />
vaults, giving inves<strong>to</strong>rs direct exposure<br />
<strong>to</strong> spot returns.<br />
Under current IRS rules, investments<br />
in these precious metals <strong>ETFs</strong> are considered<br />
collectibles. Collectibles never qualify<br />
for the 15 percent tax rate applied <strong>to</strong><br />
traditional equity investments; instead,<br />
long-term gains are taxed at a maximum<br />
rate of 28 percent. If shares are held for<br />
one year or less, gains are taxed as ordinary<br />
income (maximum 35 percent).<br />
A Better Way?<br />
If you’re looking for tax efficiency without<br />
the ETN credit risk, there may be<br />
hope. ETF Securities recently filed paperwork<br />
with the Securities <strong>and</strong> Exchange<br />
Commission for a suite of collateralized<br />
swap-based commodity<br />
funds. While the filings are light on details,<br />
according <strong>to</strong> the ETFS Collateralized<br />
Commodities Trust S-1 filing from<br />
May 27, 2010, the new funds will be<br />
structured as limited partnerships <strong>and</strong><br />
reported on K-1s.<br />
That means inves<strong>to</strong>rs will still have<br />
extra paperwork. But according <strong>to</strong> the<br />
filing, the funds are expected <strong>to</strong> be<br />
treated as prepaid forward contracts<br />
<strong>and</strong> qualify for the long-term capital<br />
gains rate of 15 percent if shares are<br />
held for over a year. This would make<br />
the taxation of these funds similar <strong>to</strong><br />
commodity ETNs <strong>and</strong> benefit long-term<br />
Figure 1<br />
Tax Rates By ETF Structure<br />
inves<strong>to</strong>rs who are wary of ETNs due <strong>to</strong><br />
their credit risks. While counterparty risk<br />
is also a concern for inves<strong>to</strong>rs, according<br />
<strong>to</strong> the filing, it looks like these funds will<br />
be fully collateralized.<br />
Making The Right Choice<br />
Finding the right ETF requires evaluating<br />
plenty of fac<strong>to</strong>rs, of which taxes are<br />
only a part. But knowing the tax implications<br />
of different choices can make a<br />
difference, especially with commodity<br />
<strong>and</strong> currency funds.<br />
From a tax perspective, the time period<br />
that you expect <strong>to</strong> own a fund matters.<br />
For short-term holders in high tax<br />
brackets, for example, LPs offer a strong<br />
tax benefit, since 60 percent of any gains<br />
are taxed at the low 15 percent tax rate,<br />
regardless of holding period.<br />
On the flip side, long-term inves<strong>to</strong>rs<br />
might gain an advantage with ETNs<br />
because they are subject <strong>to</strong> 15 percent<br />
long-term gains, compared with the<br />
60/40 blend of partnerships, which<br />
comes out <strong>to</strong> a blended maximum of<br />
23 percent. The Catch-22 is that ETNs<br />
come with credit risk.<br />
Then there are tax reporting differences.<br />
The tax structure associated with<br />
LPs can be challenging for inves<strong>to</strong>rs who<br />
are accus<strong>to</strong>med <strong>to</strong> 1099s when they<br />
receive K-1s in the mail. For inves<strong>to</strong>rs<br />
looking <strong>to</strong> simplify their taxes without<br />
K-1s, gran<strong>to</strong>r trusts <strong>and</strong> ETNs might<br />
look more appealing.<br />
Disclaimer: We are not professional tax<br />
advisors. This article <strong>and</strong> table is for informational<br />
purposes only <strong>and</strong> not intended<br />
<strong>to</strong> be tax advice. Individuals should always<br />
consult with a professional tax advisor regarding<br />
fund taxation. <br />
STRucTuRe LoNG-TeRm ShoRT-TeRm<br />
Open End (40 Act) N/A N/A<br />
UIT (40 Act) N/A N/A<br />
Gran<strong>to</strong>r Trust (33 Act) 28% 35%<br />
*Limited Partnership (33 Act) **23% **23%<br />
ETN (33 Act) 15% 35%<br />
*Distributes K-1<br />
**Max rate of blended 60 LT/40 ST<br />
10 ETFR • December 2011
Why I Own: EIDO<br />
iShares MSCI Indonesia<br />
Investable Market<br />
Name: Blair Shein<br />
Title: Vice President<br />
firm: Compass Financial<br />
Group Inc.<br />
founded: 1961<br />
Location: Deerfield Beach, Fla<br />
Aum: $200 million<br />
All eTfs? No<br />
ETFR: Today you wanted <strong>to</strong> talk about<br />
single-country Indonesian funds?<br />
Shein: Right. When we began purchasing<br />
Indonesia <strong>ETFs</strong>, we did so through the<br />
Market Vec<strong>to</strong>rs Indonesia Index ETF (NYSE<br />
Arca: IDX), because that was the only one<br />
available at the time. We’ve added the<br />
iShares MSCI Indonesia Investable Market<br />
Index Fund (NYSE Arca: EIDO), because<br />
we like the fact that it has a little higher<br />
allocation <strong>to</strong> the consumer discretionary<br />
sec<strong>to</strong>r. We saw it as a way <strong>to</strong> add <strong>to</strong> our Indonesia<br />
exposure with an investment that<br />
didn’t have the same tax basis.<br />
ETFR: When did you first buy IDX?<br />
Shein: We started buying Indonesia in 2009.<br />
Since that time, it’s appreciated <strong>by</strong> about 50<br />
percent. When we wanted <strong>to</strong> add exposure<br />
during 2011, we asked, “What difference is<br />
there between IDX <strong>and</strong> EIDO?”<br />
One of the reasons we like Indonesia is<br />
because of the consumers <strong>and</strong> the growth<br />
that we see there. And EIDO has a slightly<br />
higher allocation <strong>to</strong> the consumer discretionary<br />
sec<strong>to</strong>r. It also has about twice the<br />
number of holdings as IDX.<br />
ETFR: What made you decide <strong>to</strong> look at<br />
Indonesia?<br />
Shein: One of the main reasons is that<br />
its economy is heavily consumer-driven.<br />
About 60 percent of its GDP is related <strong>to</strong><br />
domestic consumption. And, with the<br />
country’s current demographics, the<br />
potential for additional growth there is<br />
significant. It’s not heavily driven <strong>by</strong> exports,<br />
<strong>and</strong> it appears <strong>to</strong> have a growing<br />
local dem<strong>and</strong>. From the financial stability<br />
st<strong>and</strong>point, it has exercised some fiscal<br />
constraint, unlike many of the other<br />
countries out there. Its debt-<strong>to</strong>-GDP ratio<br />
is roughly 25 percent, which is well<br />
below that of the U.S. <strong>and</strong> many other<br />
developed countries.<br />
ETFR: How does this compare with<br />
other countries?<br />
Shein: Japan is probably the most startling<br />
comparison. Japan’s debt-<strong>to</strong>-GDP ratio is<br />
close <strong>to</strong> 200 percent, while China’s is about<br />
20 percent. Japan is near the <strong>to</strong>p of the<br />
country debt ratio list. Some of the others—<br />
Italy, Greece—are high up there, <strong>to</strong>o.<br />
ETFR: Is EIDO’s sec<strong>to</strong>r breakdown appealing<br />
<strong>to</strong> you because it has a 15 percent allocation<br />
<strong>to</strong> consumer discretionary?<br />
Shein: Yes, compared <strong>to</strong> 11 percent for<br />
IDX. And when we purchased EIDO earlier<br />
this year, it was actually at 18 percent.<br />
ETFR: When you’re evaluating products,<br />
do you evaluate each specific holding?<br />
Shein: No, not every single security. We<br />
will look at some of the individual positions<br />
<strong>to</strong> see if there is a specific company<br />
that we want <strong>to</strong> have exposure <strong>to</strong>. But<br />
really, when we make our decision, we’re<br />
looking more at the demographics of the<br />
country as a whole.<br />
ETFR: Are you looking at these positions<br />
from a long-term perspective?<br />
Shein: For the most part, yes. That being<br />
said, inves<strong>to</strong>rs should be aware that<br />
iShares mSci indonesia investable market<br />
Equity: Indonesia - Total Market<br />
issuer: BlackRock<br />
Legal Structure: 1940s Act<br />
expense Ratio: 0.61%<br />
Aum: $300 billion<br />
ADV (30-Day): 266,120<br />
Avg. Spread: 0.17%<br />
competing funds: IDX<br />
Data as of: 11/09/11<br />
Source: Bloomberg<br />
there are risks. The country still has considerable<br />
improvements that need <strong>to</strong> be<br />
made when it comes <strong>to</strong> infrastructure, the<br />
efficiency <strong>and</strong> productivity of their workforce,<br />
<strong>and</strong> managing their inflation. It also<br />
has a lot of corruption.<br />
There have been inflationary concerns<br />
in Indonesia. In January, the country’s<br />
inflation registered about 7 percent<br />
on an annualized basis. That has since<br />
slowed down. Through September, Indonesia<br />
just reported an annualized rate<br />
of 4.6 percent, which is definitely better.<br />
It also recently reported annualized GDP<br />
numbers of about 6.5 percent, with<br />
projections for increases next year. But<br />
a couple of the rating agencies—S&P<br />
<strong>and</strong> Fitch—have upgraded the rating on<br />
Indonesia earlier this year <strong>to</strong> one notch<br />
below investment grade.<br />
ETFR: These two funds are crushing the<br />
broader-based emerging markets funds. Is<br />
that something you take in<strong>to</strong> consideration?<br />
Shein: Our approach is <strong>to</strong> look for opportunities<br />
wherever they are in the world.<br />
And while we’ll often hold the broad-based<br />
exposure, we’re not restricted <strong>by</strong> a benchmark<br />
target that constrains us from implementing<br />
what we feel are our best ideas.<br />
We would rather invest in something<br />
that we feel has future opportunity. We<br />
feel that Indonesia does have that future<br />
opportunity. <br />
November 9, 2010 – November 9, 2011<br />
N D J F M A M J J A<br />
2010 2011<br />
S O N D<br />
-0.26%<br />
ETFR • December 2011 11
InsideIndexing<br />
inaugural<br />
conference<br />
BUILDING BETTER BETA 2012<br />
InsideCommodities<br />
InsideIndexing InsideCommodities<br />
Inside<strong>ETFs</strong>Europe<br />
Inside<strong>ETFs</strong>Europe InsideIndexing<br />
FOR MORE INFORMATION:<br />
www.InsideIndexingConference.com/ETFR<br />
From the producers of:<br />
Inside<strong>ETFs</strong><br />
Inside<strong>ETFs</strong>Europe<br />
InsideCommodities<br />
March 19-20, 2012<br />
Inside<strong>ETFs</strong><br />
<br />
InsideIndexing<br />
Designed specifically for INSTITUTIONAL INVESTORS<br />
Inside<strong>ETFs</strong><br />
Featured Speakers:<br />
Inside<strong>ETFs</strong>Europe<br />
Inside<strong>ETFs</strong><br />
John C. Bogle<br />
Founder<br />
The Vanguard Group<br />
George F. Will<br />
Pulitzer Prize-Winning<br />
Columnist, Journalist<br />
& Author<br />
Jeremy Siegel<br />
Professor of Finance<br />
University of Pennsylvania<br />
Robert Shiller<br />
Professor of Economics<br />
Yale University<br />
For speaking opportunities, please contact:<br />
Allison Jones at 415-659-9012 or ajones@IndexUniverse.com<br />
Presented <strong>by</strong>:<br />
For sponsorship opportunities, please contact:<br />
Foster Wright at 646-558-6980 or fwright@IndexUniverse.com
December 2011 U.S.-<strong>Listed</strong> <strong>ETFs</strong> <strong>Sorted</strong> <strong>by</strong> <strong>Asset</strong> <strong>Class</strong> <strong>and</strong> <strong>Year</strong>-<strong>to</strong>-<strong>Date</strong> <strong>Return</strong><br />
Vol. 11 | No. 12<br />
Fund Name Ticker Exp Ratio <strong>Asset</strong>s 3-Mo YTD 2010 2009 3-Yr 5-Yr Mkt Cap P/E Std Dev<br />
U.S. Equity: Total Market<br />
WisdomTree Dividend Ex-Financials DTN 0.38 761.3 2.18 7.60 21.44 25.57 14.19 1.53 21,928 15.0 21.77 3.41<br />
WisdomTree Total Dividend DTD 0.28 181.3 -0.38 4.68 16.32 19.11 11.11 -0.12 39,667 13.9 20.01 2.95<br />
iShares S&P 1500 ISI 0.20 299.2 -2.64 0.98 16.24 26.59 11.98 0.49 33,661 14.1 20.01 1.76<br />
Schwab <strong>US</strong> Broad Market SCHB 0.06 763.6 -2.85 0.82 17.10 - - - 29,361 14.0 - 1.80<br />
iShares Dow Jones <strong>US</strong> IYY 0.20 535.3 -3.26 0.57 16.50 28.22 12.41 0.69 31,862 14.0 19.91 1.77<br />
Vanguard Total S<strong>to</strong>ck Market VTI 0.07 19,070.9 -3.35 0.33 17.45 28.87 12.48 0.86 27,053 15.4 20.32 1.89<br />
SPDR Dow Jones Total Market TMW 0.20 182.4 -2.84 0.31 17.34 27.83 11.85 0.69 30,230 14.0 20.06 1.71<br />
iShares Russell 3000 IWV 0.20 3,166.2 -3.21 0.19 16.82 28.07 12.03 0.45 27,260 14.0 20.32 1.72<br />
PowerShares Dynamic Market PWC 0.60 141.1 -6.50 -4.64 17.33 18.47 9.23 -1.98 9,548 10.0 19.26 1.31<br />
U.S. Equity: Total Market Growth<br />
iShares Russell 3000 Growth IWZ 0.25 294.8 -3.03 2.23 17.42 36.83 15.22 2.80 29,315 16.3 19.32 1.26<br />
Fidelity NASDAQ Composite ONEQ 0.30 158.7 -2.06 1.71 17.79 45.16 17.13 3.32 16,195 14.8 22.05 0.82<br />
U.S. Equity: Total Market Value<br />
iShares Russell 3000 Value IWW 0.25 288.8 -3.66 -1.75 15.76 19.66 8.68 -2.14 25,370 12.2 21.80 2.16<br />
U.S. Equity: Extended Cap<br />
Vanguard Extended Market VXF 0.16 1,178.6 -6.79 -3.06 27.62 37.29 16.78 2.49 2,407 17.7 25.01 1.03<br />
PowerShares FTSE RAFI <strong>US</strong> 1500 SmMid PRFZ 0.39 331.8 -7.40 -5.64 28.30 58.64 20.85 3.73 825 13.0 30.89 1.01<br />
U.S. Equity: Large Cap<br />
WisdomTree LargeCap Dividend DLN 0.28 834.2 0.22 5.31 14.98 17.31 10.14 -0.42 61,402 13.6 19.08 2.79<br />
SPDR DJ Industrial Average Trust DIA 0.18 11,253.6 -0.91 5.10 13.97 22.47 11.51 2.38 108,492 13.1 17.99 2.68<br />
PowerShares S&P 500 High Quality PIV 0.50 116.2 -0.13 4.47 20.50 12.59 8.23 -1.87 20,925 13.7 17.47 1.89<br />
iShares MSCI <strong>US</strong>A ESG Select Social KLD 0.50 163.4 -1.58 2.24 13.89 30.51 12.27 0.71 25,918 13.3 19.50 1.43<br />
ProShares Credit Suisse 130/30 CSM 0.95 103.6 -2.10 2.14 14.17 - - - 29,883 14.4 - 0.87<br />
iShares Russell Top 200 IWL 0.15 107.2 -1.86 2.06 11.26 - - - 74,477 13.4 - 1.82<br />
Rydex Russell Top 50 XLG 0.20 449.9 -1.47 2.05 9.32 20.29 8.15 -0.68 140,023 12.9 17.99 2.00<br />
Vanguard Mega Cap 300 MGC 0.13 321.5 -2.44 1.31 13.77 25.09 10.59 - 61,430 14.8 19.55 1.96<br />
iShares Morningstar Large Core JKD 0.20 275.1 -1.51 1.22 12.68 21.05 9.84 1.04 61,441 14.0 19.28 2.01<br />
SPDR S&P 500 SPY 0.15 90,879.7 -2.48 1.18 15.02 26.31 11.35 0.22 48,493 13.8 19.47 1.96<br />
iShares MSCI KLD 400 Social DSI 0.50 146.5 -1.72 1.16 11.42 30.64 10.63 - 34,464 14.9 19.80 1.40<br />
iShares S&P 500 IVV 0.09 27,459.1 -2.55 1.11 15.11 26.43 11.24 0.21 48,476 13.8 19.53 1.95<br />
iShares S&P 100 OEF 0.20 2,809.3 -2.30 1.11 12.48 22.01 9.19 -0.30 102,723 13.0 18.91 1.96<br />
Vanguard S&P 500 VOO 0.06 1,874.1 -2.48 1.03 - - - - 49,199 15.2 - 1.93<br />
Vanguard Large-Cap VV 0.12 2,997.4 -2.91 0.89 15.93 27.36 11.92 0.77 40,552 15.3 19.78 1.89<br />
Schwab <strong>US</strong> Large-Cap SCHX 0.08 670.7 -2.73 0.85 15.92 - - - 40,338 13.9 - 1.80<br />
iShares Russell 1000 IWB 0.15 6,119.5 -3.15 0.66 16.02 28.10 11.84 0.45 36,328 13.9 19.90 1.83<br />
First Trust Large Core AlphaDEX FEX 0.70 255.3 -2.61 0.62 20.67 36.83 17.25 - 12,041 11.8 21.47 0.94<br />
RevenueShares Large Cap RWL 0.49 164.8 -2.38 0.24 16.81 29.86 13.52 - 33,667 10.6 21.24 1.74<br />
Rydex S&P Equal Weight RSP 0.40 3,033.4 -3.66 0.06 21.39 44.59 17.83 1.84 12,753 14.5 24.00 1.41<br />
PowerShares FTSE RAFI <strong>US</strong> 1000 PRF 0.39 1,121.5 -3.22 -1.36 19.69 41.66 16.00 1.20 29,404 11.5 24.54 2.01<br />
PowerShares S&P 500 Low Volatility SPLV 0.25 533.9 3.45 - - - - - 18,931 14.8 - -<br />
U.S. Equity: Large Cap Growth<br />
PowerShares QQQ QQQ 0.20 25,397.2 0.09 6.98 19.89 54.67 21.56 6.91 57,005 14.9 20.72 0.71<br />
SPDR 500 Growth SPYG 0.20 199.2 -1.58 4.37 16.25 37.14 15.56 3.41 49,805 15.7 19.13 1.34<br />
iShares Russell Top 200 Growth IWY 0.20 390.0 -1.57 4.26 11.98 - - - 79,876 15.3 - 1.43<br />
iShares S&P 500 Growth IVW 0.18 6,506.4 -1.69 4.22 14.94 31.13 14.35 2.69 49,787 15.7 17.89 1.48<br />
Rydex S&P 500 Pure Growth RPG 0.35 265.9 -3.93 3.76 26.90 50.12 23.25 5.53 14,923 17.4 22.36 0.41<br />
Vanguard Mega Cap 300 Growth MGK 0.13 547.4 -1.44 3.43 14.53 34.84 13.89 - 52,489 17.5 18.85 1.27<br />
iShares Morningstar Large Growth JKE 0.25 355.8 -1.98 3.11 12.57 43.94 15.04 2.15 61,928 17.0 19.24 0.81<br />
iShares Russell 1000 Growth IWF 0.20 13,557.2 -2.76 2.73 16.48 36.73 15.00 2.86 38,812 16.2 18.96 1.32<br />
Vanguard Growth VUG 0.12 6,007.9 -2.49 2.53 17.23 36.08 14.80 3.23 36,189 18.3 19.16 1.19<br />
Schwab <strong>US</strong> Large-Cap Growth SCHG 0.13 333.0 -3.68 0.65 16.85 - - - 32,184 16.2 - 0.88<br />
PowerShares Dyn Large Cap Growth PWB 0.60 171.3 -4.59 -0.06 13.74 34.49 11.24 0.39 37,879 16.4 19.38 0.87<br />
First Trust Large Growth AlphaDEX FTC 0.70 123.5 -5.48 -2.34 23.62 29.77 15.53 - 13,206 16.5 19.08 0.65<br />
U.S. Equity: Large Cap Value<br />
PowerShares Dyn Large Cap Value PWV 0.60 379.2 -1.87 3.46 13.29 18.60 11.83 2.16 50,748 9.9 18.64 2.39<br />
First Trust Large Cap Value AlphaDEX FTA 0.70 179.4 -0.88 2.67 18.69 40.43 17.24 - 11,380 9.5 25.78 1.16<br />
Schwab <strong>US</strong> Large-Cap Value SCHV 0.13 246.3 -1.86 1.09 14.86 - - - 49,778 12.3 - 2.60<br />
Vanguard Mega Cap 300 Value MGV 0.13 350.9 -2.75 -0.23 13.16 15.74 7.70 - 72,044 12.7 20.85 2.62<br />
iShares Morningstar Large Value JKF 0.25 214.8 -3.54 -0.42 14.57 11.02 6.32 -3.40 69,297 10.3 19.38 2.81<br />
Vanguard Value VTV 0.12 4,954.4 -3.37 -0.88 14.57 19.88 8.86 -1.82 45,549 13.1 20.95 2.60<br />
iShares Russell Top 200 Value IWX 0.20 153.6 -2.74 -0.93 10.59 - - - 69,354 11.8 - 2.44<br />
SPDR S&P 500 Value Index SPYV 0.20 159.0 -2.10 -0.96 15.53 17.03 7.82 -2.00 47,118 12.1 20.44 2.29<br />
iShares Russell 1000 Value IWD 0.20 10,615.5 -3.30 -1.24 15.44 19.23 8.57 -2.12 33,946 12.1 21.47 2.18<br />
iShares S&P 500 Value IVE 0.18 3,879.8 -3.41 -2.18 14.97 20.90 7.71 -2.52 47,015 12.1 22.18 2.25<br />
Yield<br />
Data as of 10/31/2011. Source: Morningstar. Exp Ratio is annual expense ratio. <strong>Asset</strong>s are net assets in $<strong>US</strong> millions. 3-Mo is 3-month <strong>to</strong>tal return. YTD is year-<strong>to</strong>-date. 3- <strong>and</strong> 5-year<br />
returns are annualized. Mkt Cap is geometric average market capitalization. P/E is price-<strong>to</strong>-earnings ratio. Std Dev is 3-year st<strong>and</strong>ard deviation. Yield is 12-month. Includes all<br />
U.S.-listed <strong>ETFs</strong> <strong>and</strong> ETNs with assets over $100 million.<br />
ETFR • December 2011 13
December 2011 U.S.-<strong>Listed</strong> <strong>ETFs</strong> <strong>Sorted</strong> <strong>by</strong> <strong>Asset</strong> <strong>Class</strong> <strong>and</strong> <strong>Year</strong>-<strong>to</strong>-<strong>Date</strong> <strong>Return</strong><br />
Vol. 11 | No. 12<br />
Fund Name Ticker Exp Ratio <strong>Asset</strong>s 3-Mo YTD 2010 2009 3-Yr 5-Yr Mkt Cap P/E Std Dev<br />
U.S. Equity: Mid Cap<br />
WisdomTree MidCap Dividend DON 0.38 248.8 -2.11 3.53 21.65 31.91 17.47 1.85 3,727 17.8 24.50 2.93<br />
First Trust Mid Cap Core AlphaDEX FNX 0.70 221.7 -3.80 1.30 26.64 46.78 21.45 - 2,373 12.8 24.62 0.41<br />
iShares Morningstar Mid Core JKG 0.25 153.2 -4.00 1.03 26.49 39.76 19.13 2.70 5,733 16.4 23.21 1.45<br />
WisdomTree MidCap Earnings EZM 0.38 115.1 -4.16 0.45 25.60 50.22 21.85 - 2,528 12.9 25.53 1.21<br />
Vanguard Mid-Cap VO 0.12 3,307.7 -5.20 -1.11 25.68 40.47 18.48 2.21 6,444 18.6 22.58 1.20<br />
iShares Russell Midcap IWR 0.21 6,019.4 -4.96 -1.12 25.31 40.70 17.51 2.14 6,595 15.6 22.90 1.53<br />
SPDR S&P MidCap 400 MDY 0.25 9,415.7 -5.63 -1.32 26.26 37.49 17.59 3.65 2,912 15.0 22.59 1.02<br />
iShares S&P 400 MidCap IJH 0.21 9,312.8 -5.49 -1.42 26.73 37.48 17.54 3.89 3,252 16.9 22.84 1.20<br />
RevenueShares Mid Cap RWK 0.54 129.1 -4.13 -1.74 23.21 52.55 20.48 - 2,276 11.3 26.70 0.58<br />
U.S. Equity: Mid Cap Growth<br />
Rydex S&P MidCap 400 Pure Growth RFG 0.35 636.8 -5.01 4.84 34.84 60.81 28.55 10.70 3,441 20.8 24.75 0.10<br />
iShares S&P Mid Cap 400 Growth IJK 0.26 2,743.7 -5.15 1.53 30.44 41.11 20.98 6.15 3,685 19.5 22.23 0.63<br />
iShares Morningstar Mid Growth JKH 0.30 160.8 -5.99 1.41 27.84 42.17 19.30 3.85 6,177 23.3 20.61 0.39<br />
iShares Russell Mid Cap Growth IWP 0.25 2,967.8 -4.94 0.17 26.03 46.28 19.90 3.25 6,884 19.0 22.00 0.93<br />
Vanguard Mid-Cap Growth VOT 0.12 1,137.4 -5.98 -0.49 29.14 43.91 19.52 3.26 7,115 22.8 22.25 0.53<br />
U.S. Equity: Mid Cap Value<br />
Vanguard Mid-Cap Value VOE 0.12 775.7 -4.14 -1.63 21.77 38.11 17.32 1.01 5,812 15.6 23.49 1.94<br />
iShares Russell Midcap Value IWS 0.26 2,645.6 -4.89 -2.17 24.43 33.31 15.64 0.65 6,317 13.1 24.27 2.10<br />
iShares S&P MidCap 400 Value IJJ 0.27 1,956.2 -6.05 -3.99 22.58 34.24 14.59 1.55 2,859 14.8 23.86 1.76<br />
U.S. Equity: Small Cap<br />
iShares S&P SmallCap 600 IJR 0.20 6,492.6 -4.95 -1.08 26.61 25.80 13.36 2.03 1,033 17.0 25.95 1.17<br />
First Trust Small Cap Core AlphaDEX FYX 0.70 117.0 -4.20 -1.48 27.35 37.78 17.54 - 663 13.1 28.34 0.32<br />
RevenueShares Small Cap RWJ 0.54 102.5 -4.42 -2.19 25.96 46.53 20.96 - 721 12.4 31.34 0.48<br />
Schwab <strong>US</strong> Small-Cap SCHA 0.13 455.7 -5.63 -2.25 28.62 - - - 1,366 15.2 - 1.33<br />
Vanguard Small-Cap VB 0.17 3,865.7 -5.94 -2.58 28.12 35.94 16.63 2.59 1,549 16.9 26.78 1.19<br />
WisdomTree SmallCap Earnings EES 0.38 120.0 -4.72 -2.83 26.97 48.34 20.27 - 643 12.0 29.87 1.36<br />
WisdomTree SmallCap Dividend DES 0.38 231.1 -2.90 -3.65 27.05 22.15 12.21 -0.67 792 14.8 29.38 3.82<br />
iShares Russell 2000 IWM 0.26 16,156.5 -6.84 -4.57 26.90 28.45 13.02 0.72 955 15.2 26.22 1.39<br />
iShares Morningstar Small Core JKJ 0.25 143.0 -8.18 -4.74 27.68 39.78 16.46 1.05 1,579 15.6 27.73 1.23<br />
U.S. Equity: Small Cap Growth<br />
SPDR S&P SmallCap 600 Growth SLYG 0.25 144.5 -3.98 2.97 30.21 47.12 21.82 5.10 1,150 17.9 26.78 0.62<br />
iShares S&P SmallCap 600 Growth IJT 0.25 1,481.6 -4.63 2.18 28.24 28.81 16.11 4.07 1,150 17.9 24.59 0.85<br />
Vanguard Small-Cap Growth VBK 0.12 1,873.0 -5.85 -0.38 30.95 42.79 19.75 4.63 1,616 20.8 26.31 0.47<br />
iShares Russell 2000 Growth IWO 0.25 3,497.3 -6.29 -2.14 29.38 34.61 16.30 2.71 1,111 17.6 25.63 0.69<br />
U.S. Equity: Small Cap Value<br />
iShares Morningstar Small Value JKL 0.30 152.5 -4.54 -3.73 25.80 40.06 16.25 1.84 1,573 13.3 28.95 2.34<br />
SPDR S&P SmallCap 600 Value Index SLYV 0.25 104.9 -4.89 -4.09 24.62 36.93 15.41 1.53 927 16.2 27.20 1.54<br />
iShares S&P SmallCap 600 Value IJS 0.25 1,502.2 -5.07 -4.20 24.70 21.53 11.16 0.02 928 16.2 27.87 1.36<br />
Vanguard Small-Cap Value VBR 0.23 1,760.9 -6.13 -4.87 25.12 30.97 13.71 0.36 1,485 14.3 27.12 2.01<br />
iShares Russell 2000 Value IWN 0.40 3,592.8 -7.25 -6.96 24.68 20.59 9.62 -1.46 820 13.3 27.11 2.11<br />
U.S. Equity: Micro Cap<br />
iShares Russell Microcap IWC 0.67 395.8 -9.70 -10.08 29.55 23.72 9.69 -3.71 242 12.3 27.96 1.15<br />
U.S. Equity: Basic Materials<br />
Vanguard Materials VAW 0.24 581.5 -9.43 -7.95 24.46 51.44 16.17 4.51 12,128 15.1 28.86 2.37<br />
Materials Select SPDR XLB 0.20 1,942.5 -8.59 -8.78 20.56 48.11 13.09 3.20 18,680 13.1 28.43 2.58<br />
First Trust Materials AlphaDEX FXZ 0.70 170.6 -12.06 -10.08 28.28 59.45 22.60 - 4,280 11.6 32.68 1.76<br />
iShares DJ <strong>US</strong> Basic Materials IYM 0.47 633.4 -12.26 -11.93 31.02 64.37 18.73 5.21 13,349 11.9 32.01 1.75<br />
SPDR S&P Metals <strong>and</strong> Mining XME 0.35 1,004.1 -17.23 -19.67 34.15 87.85 21.88 4.11 2,556 15.2 37.92 0.77<br />
U.S. Equity: Consumer Cyclicals<br />
SPDR S&P Retail XRT 0.35 550.7 -1.07 9.31 37.39 78.03 33.31 6.16 3,049 16.5 28.42 0.93<br />
Consumer Discr Select SPDR XLY 0.20 2,181.3 -1.24 5.36 27.49 40.52 21.88 2.51 27,294 16.6 23.99 1.55<br />
iShares DJ <strong>US</strong> Consumer Services IYC 0.47 222.3 -1.31 5.08 23.26 32.66 18.42 2.54 22,910 16.2 20.58 1.10<br />
First Trust Consumer Discr AlphaDEX FXD 0.70 491.4 -3.27 4.66 32.01 57.11 27.89 - 6,184 12.5 29.44 0.41<br />
Vanguard Consumer Discr VCR 0.24 352.5 -1.88 4.17 30.57 46.87 23.72 2.59 16,311 17.4 25.36 0.95<br />
PowerShares Dynamic Media PBS 0.63 115.1 -8.17 -4.13 20.18 61.92 20.75 -1.87 6,913 13.7 27.68 0.68<br />
SPDR S&P Homebuilders XHB 0.35 810.0 -2.87 -5.92 17.40 27.71 6.35 -12.58 2,312 20.5 37.31 2.73<br />
iShares DJ <strong>US</strong> Home Construction ITB 0.47 264.9 -8.70 -18.21 10.43 22.12 -3.60 -21.82 2,405 25.1 39.59 0.86<br />
U.S. Equity: Consumer Non-Cyclicals<br />
First Trust Consumer Staples AlphaDEX FXG 0.70 190.9 -3.71 12.05 19.75 27.47 16.75 - 9,498 12.8 16.71 0.78<br />
Vanguard Consumer Staples VDC 0.24 811.9 1.12 8.53 14.62 16.55 12.72 6.88 44,055 15.8 12.82 2.39<br />
Consumer Staples Select SPDR XLP 0.20 5,633.7 1.43 8.02 13.81 14.22 11.16 6.44 52,885 15.3 12.72 2.75<br />
iShares DJ <strong>US</strong> Consumer Goods IYK 0.47 415.6 0.17 6.17 18.99 23.32 14.36 5.31 35,359 15.1 15.54 2.09<br />
PowerShares Dyn Food & Beverage PBJ 0.63 210.3 -3.31 4.89 29.97 11.04 14.41 5.32 6,578 14.2 14.69 0.98<br />
Data as of 10/31/2011. Source: Morningstar. Exp Ratio is annual expense ratio. <strong>Asset</strong>s are net assets in $<strong>US</strong> millions. 3-Mo is 3-month <strong>to</strong>tal return. YTD is year-<strong>to</strong>-date. 3- <strong>and</strong> 5-year<br />
returns are annualized. Mkt Cap is geometric average market capitalization. P/E is price-<strong>to</strong>-earnings ratio. Std Dev is 3-year st<strong>and</strong>ard deviation. Yield is 12-month. Includes all<br />
U.S.-listed <strong>ETFs</strong> <strong>and</strong> ETNs with assets over $100 million.<br />
14 ETFR • December 2011<br />
Yield
December 2011 U.S.-<strong>Listed</strong> <strong>ETFs</strong> <strong>Sorted</strong> <strong>by</strong> <strong>Asset</strong> <strong>Class</strong> <strong>and</strong> <strong>Year</strong>-<strong>to</strong>-<strong>Date</strong> <strong>Return</strong><br />
Vol. 11 | No. 12<br />
Fund Name Ticker Exp Ratio <strong>Asset</strong>s 3-Mo YTD 2010 2009 3-Yr 5-Yr Mkt Cap P/E Std Dev<br />
U.S. Equity: Energy<br />
ETRACS MLP Infrastructure ETN MLPI 0.85 184.3 6.01 9.17 - - - - - - - 5.05<br />
JPMorgan Alerian MLP ETN AMJ 0.85 3,241.6 4.12 7.25 34.53 - - - - - - 4.98<br />
Alerian MLP AMLP 0.85 1,577.3 3.66 5.48 - - - - 6,802 16.7 - 6.13<br />
Credit Suisse Cushing 30 MLP ETN MLPN 0.85 206.9 2.28 4.49 - - - - - - - 3.90<br />
PowerShares Dynamic Energy PXI 0.60 133.3 -11.21 4.09 39.56 42.19 19.28 8.07 5,433 12.0 30.25 0.88<br />
Energy Select SPDR XLE 0.20 7,943.7 -8.41 3.29 21.81 21.63 12.98 6.19 56,107 13.1 25.10 1.55<br />
iShares Dow Jones <strong>US</strong> Energy IYE 0.47 879.9 -8.52 3.02 19.00 19.03 11.03 5.68 61,155 12.7 24.05 1.38<br />
SPDR S&P Oil/Gas Expl & Production XOP 0.35 1,047.8 -13.28 2.83 28.58 40.16 17.40 8.08 3,611 16.1 32.56 0.94<br />
Vanguard Energy VDE 0.24 1,760.9 -8.92 2.61 21.05 24.85 12.67 5.99 51,176 15.2 25.60 1.22<br />
iShares DJ <strong>US</strong> Oil/Gas Expl & Production IEO 0.47 360.5 -10.79 0.51 18.65 40.75 14.41 6.49 16,379 17.6 31.75 0.50<br />
First Trust ISE-Revere Natural Gas FCG 0.60 410.0 -15.38 -3.58 12.23 50.06 8.77 - 8,637 12.1 34.64 0.29<br />
First Trust Energy AlphaDEX FXN 0.70 101.8 -14.23 -3.64 27.63 46.54 15.09 - 8,234 10.9 34.98 0.52<br />
SPDR S&P Oil/Gas Equipment & Services XES 0.35 329.5 -16.97 -3.74 30.12 67.80 18.62 5.31 3,104 20.4 36.02 0.83<br />
iShares DJ <strong>US</strong> Oil Equipment & Services IEZ 0.47 431.6 -18.99 -3.97 31.77 63.57 17.10 4.79 12,073 19.8 37.08 0.47<br />
PowerShares Dyn Oil & Gas Services PXJ 0.63 185.5 -19.50 -5.63 29.18 52.86 12.31 1.57 3,605 16.1 39.67 0.38<br />
PowerShares WilderHill Clean Energy PBW 0.60 263.4 -26.15 -41.08 -5.55 27.61 -14.97 -19.25 852 5.3 35.24 1.53<br />
U.S. Equity: Financials<br />
SPDR KBW Regional Banking KRE 0.35 566.8 -4.72 -10.13 20.65 -21.93 -8.25 -11.07 1,922 14.4 32.76 1.68<br />
iShares DJ <strong>US</strong> Financial IYF 0.47 348.4 -7.58 -11.85 12.20 16.37 -0.59 -13.27 21,601 11.7 31.72 1.54<br />
Vanguard Financials VFH 0.27 551.8 -8.11 -12.70 14.83 14.32 -0.57 -12.79 19,950 12.5 32.00 1.87<br />
SPDR KBW Insurance KIE 0.35 141.6 -5.60 -13.68 26.08 27.92 13.78 -5.86 9,579 9.7 34.73 1.97<br />
Financial Select SPDR XLF 0.20 5,803.0 -8.40 -14.52 11.91 16.57 -2.74 -15.61 37,244 10.8 35.30 1.49<br />
iShares DJ <strong>US</strong> Financial Services IYG 0.47 168.0 -10.74 -18.30 7.71 15.69 -6.53 -16.96 33,008 10.4 34.44 0.95<br />
SPDR KBW Bank KBE 0.35 1,152.7 -13.19 -22.93 23.07 -1.29 -10.55 -16.83 6,174 12.4 39.44 1.31<br />
U.S. Equity: Health Care<br />
Biotech HOLDRS BBH - 264.1 3.39 18.75 2.15 11.49 11.05 4.68 28,634 13.9 17.97 -<br />
PowerShares Dyn Pharmaceuticals PJP 0.63 156.9 0.62 13.01 27.51 16.85 20.99 9.06 11,199 14.1 17.20 0.64<br />
iShares DJ <strong>US</strong> Pharmaceuticals IHE 0.47 252.9 -1.28 10.92 12.72 30.06 19.93 7.17 14,882 18.4 17.21 1.34<br />
Pharmaceutical HOLDRS PPH - 478.1 -0.91 8.29 1.67 20.47 10.75 2.01 86,295 17.9 16.05 -<br />
Health Care Select SPDR XLV 0.20 4,088.9 -1.09 8.12 3.32 19.49 9.83 2.06 44,561 15.8 16.18 1.96<br />
PowerShares S&P SmallCap Health Care PSCH 0.29 106.5 -5.03 7.53 - - - - 1,111 17.7 - 0.24<br />
iShares DJ <strong>US</strong> Healthcare Providers IHF 0.47 216.9 -6.06 7.40 11.47 35.44 18.53 2.92 8,262 11.2 23.43 0.22<br />
SPDR S&P Pharmaceuticals XPH 0.35 242.6 -2.28 7.30 22.47 27.60 23.09 8.59 6,160 17.4 18.26 0.93<br />
iShares DJ <strong>US</strong> Healthcare IYH 0.47 555.9 -2.11 6.93 4.13 21.07 10.06 2.45 33,550 16.0 16.54 1.54<br />
Vanguard Health Care VHT 0.24 680.3 -2.51 6.84 5.60 21.81 11.26 2.76 26,812 17.3 16.56 1.63<br />
iShares NASDAQ Biotechnology IBB 0.48 1,350.5 -5.46 5.15 14.84 15.17 11.43 4.48 5,933 18.8 19.92 -<br />
SPDR S&P Biotech XBI 0.35 409.9 -7.08 4.80 17.60 0.17 7.46 5.74 2,405 - 24.12 -<br />
First Trust Health Care AlphaDEX FXH 0.70 435.1 -5.88 4.74 19.01 51.22 22.51 - 7,837 12.9 17.49 0.23<br />
iShares DJ <strong>US</strong> Medical Devices IHI 0.47 337.8 -8.45 0.69 11.35 38.49 9.70 4.11 6,498 17.3 21.64 0.19<br />
PowerShares Dyn Biotech/Genome PBE 0.63 158.4 -3.61 -7.17 31.47 21.91 11.72 2.00 2,975 16.6 21.45 -<br />
First Trust NYSE Arca Biotechnology FBT 0.60 435.3 -13.53 -10.15 36.94 45.05 19.72 8.26 4,761 20.0 28.68 -<br />
U.S. Equity: Industrials<br />
iShares Dow Jones <strong>US</strong> Aerospace/Defense ITA 0.47 108.0 -3.05 2.57 16.60 25.32 12.97 4.46 8,221 12.9 24.65 1.03<br />
Industrial Select SPDR XLI 0.20 3,450.1 -3.06 -2.72 27.85 21.69 12.88 1.69 30,042 14.6 26.90 2.06<br />
iShares DJ <strong>US</strong> Industrial IYJ 0.47 349.4 -3.45 -2.76 25.49 25.46 13.36 1.59 18,086 14.7 26.52 1.47<br />
Vanguard Industrials VIS 0.24 454.0 -3.80 -4.03 27.32 22.11 12.00 1.08 19,304 17.6 27.77 1.37<br />
iShares DJ Transportation Average IYT 0.47 350.0 -5.62 -4.03 26.74 18.93 9.64 2.05 10,123 19.1 28.04 1.49<br />
U.S. Equity: Technology<br />
Internet HOLDRS HHH - 132.4 -2.15 12.71 24.35 82.50 34.58 9.29 48,553 30.4 23.55 -<br />
Technology Select SPDR XLK 0.20 7,603.5 1.16 4.39 11.41 51.25 17.80 3.98 82,151 14.0 19.52 1.40<br />
Vanguard Information Technology VGT 0.24 1,957.5 0.74 3.59 12.78 61.89 20.09 4.92 40,759 15.7 21.69 0.57<br />
iShares DJ <strong>US</strong> Technology IYW 0.47 1,347.7 0.79 3.18 12.42 63.29 19.56 4.89 65,358 14.5 21.84 0.53<br />
iShares S&P North Amer Software IGV 0.48 564.2 1.57 2.74 24.64 47.53 21.04 6.31 12,659 22.8 21.15 -<br />
iShares S&P North American Technology IGM 0.48 389.6 -0.13 2.71 11.98 62.27 19.02 4.82 49,213 14.9 21.76 0.63<br />
Semiconduc<strong>to</strong>r HOLDRS SMH - 537.6 -0.61 -1.24 18.52 61.55 17.29 0.07 22,986 11.4 27.27 -<br />
First Trust NASDAQ-100 Technology QTEC 0.60 177.2 2.24 -1.99 21.71 79.71 25.20 5.35 15,412 12.9 25.40 0.63<br />
Rydex S&P Equal Weight Technology RYT 0.50 109.7 -0.06 -2.25 17.89 69.07 21.43 - 12,755 14.8 25.19 0.52<br />
First Trust DJ Internet FDN 0.60 528.8 -5.56 -2.39 36.72 79.37 31.21 8.55 7,734 24.3 24.07 0.15<br />
SPDR Morgan Stanley Technology MTK 0.50 177.7 0.52 -3.34 15.31 70.14 20.06 3.34 38,353 15.2 23.89 0.70<br />
iShares PHLX SOX Semiconduc<strong>to</strong>r SOXX 0.48 225.0 0.14 -5.34 14.32 74.92 17.50 -2.16 12,525 11.4 29.54 1.22<br />
First Trust Technology AlphaDEX FXL 0.70 145.9 -2.94 -6.78 26.64 66.79 22.80 - 5,861 11.1 26.25 0.03<br />
iShares S&P North Am Multimedia Netwrk IGN 0.48 195.1 -1.18 -14.27 24.30 60.57 15.77 -1.12 8,408 16.0 30.81 0.15<br />
U.S. Equity: Telecommunications<br />
Telecom HOLDRS TTH - 122.3 0.52 2.24 16.38 7.05 10.45 -0.38 92,282 11.1 15.31 -<br />
Vanguard Telecommunication Svcs VOX 0.24 385.4 -5.91 -3.66 19.52 29.25 15.04 0.23 19,962 14.8 17.00 3.02<br />
iShares DJ Telecommunications IYZ 0.47 521.4 -8.92 -7.70 20.72 25.68 13.16 -2.29 14,957 12.8 18.34 3.11<br />
Yield<br />
Data as of 10/31/2011. Source: Morningstar. Exp Ratio is annual expense ratio. <strong>Asset</strong>s are net assets in $<strong>US</strong> millions. 3-Mo is 3-month <strong>to</strong>tal return. YTD is year-<strong>to</strong>-date. 3- <strong>and</strong> 5-year<br />
returns are annualized. Mkt Cap is geometric average market capitalization. P/E is price-<strong>to</strong>-earnings ratio. Std Dev is 3-year st<strong>and</strong>ard deviation. Yield is 12-month. Includes all<br />
U.S.-listed <strong>ETFs</strong> <strong>and</strong> ETNs with assets over $100 million.<br />
ETFR • December 2011 15
December 2011 U.S.-<strong>Listed</strong> <strong>ETFs</strong> <strong>Sorted</strong> <strong>by</strong> <strong>Asset</strong> <strong>Class</strong> <strong>and</strong> <strong>Year</strong>-<strong>to</strong>-<strong>Date</strong> <strong>Return</strong><br />
Vol. 11 | No. 12<br />
Fund Name Ticker Exp Ratio <strong>Asset</strong>s 3-Mo YTD 2010 2009 3-Yr 5-Yr Mkt Cap P/E Std Dev<br />
U.S. Equity: Utilities<br />
Utilities Select SPDR XLU 0.20 6,838.1 6.14 14.54 5.35 11.69 10.61 3.27 15,762 14.5 12.37 3.88<br />
Vanguard Utilities VPU 0.24 917.8 5.37 13.86 7.05 11.27 11.37 3.48 10,515 14.6 12.82 3.62<br />
iShares DJ <strong>US</strong> Utilities IDU 0.47 677.7 5.30 13.68 7.21 12.06 10.79 2.93 11,740 14.9 12.75 3.52<br />
First Trust Utilities AlphaDEX FXU 0.70 116.4 -0.85 7.00 10.47 22.62 14.02 - 7,638 13.9 14.57 2.20<br />
U.S. Equity: Real Estate<br />
iShares FTSE NAREIT Residential Plus REZ 0.48 152.8 -0.85 13.54 30.81 20.73 17.18 - 5,768 40.8 28.90 3.05<br />
iShares Cohen & Steers Realty Majors ICF 0.35 2,286.7 -3.74 9.67 29.14 25.54 15.91 -2.36 11,207 35.6 37.52 2.88<br />
SPDR Dow Jones REIT RWR 0.25 1,412.8 -3.64 8.48 28.03 28.24 16.18 -1.67 7,998 36.5 36.72 3.01<br />
Vanguard REIT VNQ 0.12 9,014.8 -3.85 7.63 28.43 30.07 17.43 -0.57 6,461 39.4 35.58 3.44<br />
First Trust S&P REIT FRI 0.50 360.1 -4.08 7.31 27.73 28.42 16.67 - 6,112 32.1 36.75 2.54<br />
iShares DJ <strong>US</strong> Real Estate IYR 0.47 3,195.5 -4.28 5.17 26.60 30.46 16.05 -2.55 7,937 21.3 33.72 3.80<br />
Schwab U. S. REIT SCHH 0.13 155.5 -3.56 - - - - - 7,998 36.5 - -<br />
U.S. Equity: Theme<br />
iShares FTSE NAREIT Mortgage Plus REM 0.48 228.3 -1.76 -8.46 16.49 11.32 5.55 - 3,132 6.5 16.64 11.04<br />
PowerShares Water Resources PHO 0.60 879.1 -7.23 -9.47 13.27 18.01 7.91 -0.22 1,712 14.1 25.20 0.97<br />
U.S. Equity: Alpha-Seeking<br />
PowerShares DWA Technical Leaders PDP 0.60 459.7 -6.20 2.58 26.59 28.03 16.87 - 8,443 17.1 21.07 0.23<br />
Guggenheim Insider Sentiment NFO 0.60 110.8 -8.03 -1.75 26.79 51.01 20.50 5.36 3,583 12.6 28.96 0.63<br />
U.S. Equity: High Dividend Yield<br />
First Trust Mstar Dividend Leaders FDL 0.45 320.9 3.99 8.72 16.20 13.38 10.49 -1.76 39,517 13.4 22.92 3.62<br />
WisdomTree Equity Income DHS 0.38 292.2 2.13 8.67 17.63 16.87 10.37 -2.01 38,814 14.5 23.75 3.92<br />
iShares DJ Select Dividend DVY 0.40 8,291.9 2.46 7.40 17.79 10.77 7.68 -1.54 10,678 14.6 20.94 3.54<br />
Vanguard High Dividend Yield VYM 0.18 1,980.0 0.56 5.74 14.25 17.17 10.35 - 54,354 14.4 19.98 2.90<br />
First Trust Value Line Dividend FVD 0.70 332.9 1.49 6.47 16.08 19.16 13.00 2.81 14,065 12.8 17.48 2.63<br />
Guggenheim Multi-<strong>Asset</strong> Income CVY 0.60 450.0 -0.41 6.27 17.83 50.43 18.54 1.28 10,737 11.3 24.31 5.27<br />
PowerShares Dividend Achievers PFM 0.50 235.6 0.65 5.49 14.81 10.70 8.30 -0.47 53,512 12.9 17.42 2.50<br />
SPDR S&P Dividend SDY 0.35 7,246.5 2.71 4.61 16.42 19.04 10.74 1.44 11,995 15.6 20.93 3.26<br />
PowerShares HiYld Equity Div Achievers PEY 0.50 276.8 5.61 3.70 20.92 3.34 3.34 -6.67 4,413 14.2 26.85 3.98<br />
Vanguard Dividend Appreciation VIG 0.18 7,904.9 -0.56 3.14 14.76 19.56 11.64 2.39 43,096 15.3 16.62 2.14<br />
iShares High Dividend Equity HDV 0.40 528.8 3.80 - - - - - 60,906 14.0 - -<br />
Global Equity<br />
iShares S&P Global 100 IOO 0.40 985.8 -6.22 -2.95 5.91 24.02 7.21 -1.13 102,656 11.0 22.80 2.74<br />
Vanguard Total World S<strong>to</strong>ck VT 0.25 970.6 -7.86 -5.38 13.07 32.66 11.71 - 34,062 13.7 23.03 2.03<br />
iShares MSCI ACWI ACWI 0.35 2,146.6 -7.64 -5.85 12.82 32.31 10.82 - 32,335 11.3 23.49 2.30<br />
SPDR DJ Global Titans DGT 0.50 105.9 -9.40 -8.13 4.99 24.18 3.48 -3.97 53,010 10.8 20.85 2.70<br />
Global Equity Ex-U.S.<br />
SPDR S&P World ex-<strong>US</strong> GWL 0.34 131.5 -9.76 -8.73 11.29 27.97 9.80 - 21,624 11.3 25.12 2.90<br />
Vanguard FTSE All-World ex-<strong>US</strong> VEU 0.22 6,300.6 -11.23 -9.55 11.80 37.61 12.01 - 26,914 12.7 26.06 2.36<br />
SPDR MSCI ACWI ex-<strong>US</strong> CWI 0.34 401.8 -10.54 -9.72 11.60 37.14 12.11 - 26,869 10.1 25.97 2.91<br />
iShares MSCI ACWI ex <strong>US</strong> ACWX 0.35 868.8 -11.07 -10.19 10.44 36.28 10.73 - 23,832 10.2 26.00 2.85<br />
Vanguard FTSE All-World ex-<strong>US</strong> SmCap VSS 0.33 905.9 -15.32 -13.91 25.59 - - - 1,494 13.7 - 2.50<br />
Vanguard Total International S<strong>to</strong>ck VX<strong>US</strong> 0.20 425.7 -11.84 - - - - - 19,520 12.7 - -<br />
International Equity: Blended Development<br />
iShares S&P Asia 50 AIA 0.50 194.4 -11.53 -11.16 19.56 60.79 18.52 - 55,215 10.2 27.79 2.01<br />
iShares MSCI All Country Asia ex-Japan AAXJ 0.69 1,987.1 -14.06 -15.00 16.22 68.40 19.33 - 15,166 9.7 28.99 2.33<br />
International Equity: Developed<br />
iShares MSCI New Zeal<strong>and</strong> ENZL 0.55 111.4 -11.38 3.85 - - - - 1,677 19.1 - 2.41<br />
WisdomTree Intl Dividend ex-Financials DOO 0.58 246.2 -7.53 -1.87 5.70 33.20 12.62 -1.60 23,829 10.6 26.02 4.43<br />
iShares MSCI Spain EWP 0.54 187.5 -8.96 -2.15 -18.61 32.89 5.74 -2.91 27,936 - 35.59 5.36<br />
iShares MSCI United Kingdom EWU 0.53 1,288.7 -5.98 -2.27 10.28 36.12 11.43 -2.37 45,919 9.8 24.85 2.83<br />
iShares MSCI Kokusai TOK 0.25 640.9 -8.02 -3.06 11.45 31.45 10.50 - 36,045 11.6 22.10 2.38<br />
WisdomTree Intl LargeCap Dividend DOL 0.48 132.0 -7.89 -3.61 1.87 24.90 8.07 -2.18 54,066 10.4 25.59 4.50<br />
iShares MSCI Switzerl<strong>and</strong> EWL 0.53 519.0 -10.71 -4.38 14.48 22.05 10.61 1.77 57,864 11.8 24.69 2.24<br />
iShares MSCI Australia EWA 0.53 2,956.8 -5.83 -5.04 15.35 67.90 22.35 5.46 25,168 11.3 31.77 4.40<br />
WisdomTree Japan SmallCap Dividend DFJ 0.58 200.7 -7.98 -5.15 17.37 0.94 8.77 -2.13 830 12.7 19.11 2.18<br />
WisdomTree DEFA DWM 0.48 403.2 -9.58 -5.30 5.19 27.12 9.10 -2.10 27,519 10.6 24.62 4.21<br />
iShares S&P Europe 350 IEV 0.60 1,092.2 -10.65 -6.76 3.74 28.90 7.78 -3.34 43,803 10.4 27.94 3.17<br />
Vanguard European VGK 0.14 2,630.0 -10.50 -6.89 6.05 31.33 8.65 -2.83 40,633 12.2 27.99 5.05<br />
iShares MSCI Pacific ex-Japan EPP 0.50 3,491.0 -8.92 -7.67 17.77 63.22 21.80 5.60 20,404 9.9 29.30 3.97<br />
WisdomTree Intl MidCap Dividend DIM 0.58 128.8 -10.89 -7.69 11.31 34.00 13.68 -1.01 5,173 11.0 25.19 3.91<br />
Schwab International Equity SCHF 0.13 648.4 -10.54 -8.09 9.31 - - - 28,125 11.4 - 1.85<br />
WisdomTree Intl SmallCap Dividend DLS 0.58 392.9 -9.53 -8.22 19.41 37.09 15.34 -0.83 1,003 11.4 23.96 3.99<br />
iShares MSCI EAFE EFA 0.35 38,615.0 -10.78 -8.25 8.25 26.85 8.65 -2.76 26,681 10.7 25.08 3.16<br />
iShares MSCI Canada EWC 0.53 5,039.3 -8.73 -8.29 19.80 53.07 15.91 4.49 18,626 13.9 27.36 1.85<br />
Data as of 10/31/2011. Source: Morningstar. Exp Ratio is annual expense ratio. <strong>Asset</strong>s are net assets in $<strong>US</strong> millions. 3-Mo is 3-month <strong>to</strong>tal return. YTD is year-<strong>to</strong>-date. 3- <strong>and</strong> 5-year<br />
returns are annualized. Mkt Cap is geometric average market capitalization. P/E is price-<strong>to</strong>-earnings ratio. Std Dev is 3-year st<strong>and</strong>ard deviation. Yield is 12-month. Includes all<br />
U.S.-listed <strong>ETFs</strong> <strong>and</strong> ETNs with assets over $100 million.<br />
16 ETFR • December 2011<br />
Yield
December 2011 U.S.-<strong>Listed</strong> <strong>ETFs</strong> <strong>Sorted</strong> <strong>by</strong> <strong>Asset</strong> <strong>Class</strong> <strong>and</strong> <strong>Year</strong>-<strong>to</strong>-<strong>Date</strong> <strong>Return</strong><br />
Vol. 11 | No. 12<br />
Fund Name Ticker Exp Ratio <strong>Asset</strong>s 3-Mo YTD 2010 2009 3-Yr 5-Yr Mkt Cap P/E Std Dev<br />
International Equity: Developed (Continued)<br />
Vanguard MSCI EAFE VEA 0.12 6,736.2 -11.03 -8.49 8.33 27.52 8.71 - 32,124 12.3 25.33 2.71<br />
iShares MSCI EAFE Value EFV 0.40 1,253.3 -10.44 -8.55 4.59 28.28 7.52 -4.43 29,296 9.1 27.10 4.15<br />
iShares MSCI EAFE Growth EFG 0.40 1,251.0 -11.35 -8.72 13.11 24.15 8.72 -1.43 24,214 13.1 24.30 2.19<br />
iShares MSCI South Korea EWY 0.61 3,666.1 -15.65 -8.99 29.58 72.21 26.55 4.41 14,968 9.7 39.84 0.87<br />
iShares MSCI Germany EWG 0.53 2,863.1 -17.57 -9.13 8.31 20.31 7.33 -0.49 31,299 10.2 34.28 3.14<br />
SPDR Euro STOXX 50 FEZ 0.29 138.9 -13.33 -9.27 -7.75 25.23 3.18 -5.12 54,153 10.1 33.46 4.83<br />
iShares MSCI EAFE Small Cap SCZ 0.40 1,343.8 -12.47 -9.87 21.51 42.78 16.33 - 1,245 11.6 25.53 3.89<br />
iShares MSCI Singapore EWS 0.53 1,565.8 -14.81 -10.29 24.51 67.35 25.10 7.95 12,223 - 29.90 3.98<br />
Vanguard Pacific VPL 0.14 1,472.2 -10.51 -10.43 15.50 20.35 9.71 -2.03 18,978 12.9 21.49 4.38<br />
iShares MSCI France EWQ 0.54 340.0 -14.55 -10.43 -2.38 27.12 5.06 -4.67 28,210 8.5 31.87 3.07<br />
iShares MSCI EMU EZU 0.54 775.1 -14.29 -10.74 -3.00 26.41 4.42 -5.40 26,635 9.2 32.33 3.66<br />
Schwab International Small-Cap Eq SCHC 0.35 154.3 -13.37 -11.02 - - - - 1,464 11.9 - 2.54<br />
SPDR S&P International Small Cap GWX 0.59 760.4 -13.86 -11.16 24.96 38.52 17.03 - 925 12.2 25.08 2.28<br />
PowerShares F/R Dev Mkts ex-<strong>US</strong> SmMid PXF 0.75 245.7 -11.79 -11.23 6.81 36.02 9.47 - 23,896 9.6 29.66 3.42<br />
iShares MSCI Sweden EWD 0.53 302.9 -11.41 -11.99 36.11 55.30 23.87 1.84 16,382 9.9 32.74 3.86<br />
iShares MSCI Japan EWJ 0.54 6,264.9 -12.23 -13.09 13.61 2.93 3.04 -6.10 14,623 14.4 20.26 1.68<br />
iShares MSCI Hong Kong EWH 0.53 1,842.4 -13.84 -13.30 24.16 54.94 19.80 5.26 15,828 7.4 25.34 2.47<br />
WisdomTree Japan Hedged Equity DXJ 0.48 478.5 -8.43 -14.03 -1.78 1.19 -2.42 -8.03 10,971 12.9 19.78 2.27<br />
iShares MSCI Italy EWI 0.54 125.2 -14.50 -15.65 -14.20 21.97 -3.38 -12.22 18,308 8.0 35.80 3.59<br />
Maxis Nikkei 225 NKY 0.50 165.9 -10.64 - - - - - - - - -<br />
International Equity: Emerging<br />
iShares MSCI Indonesia EIDO 0.61 296.4 -12.83 3.09 - - - - 9,042 16.4 - 0.82<br />
Market Vec<strong>to</strong>rs Indonesia IDX 0.60 471.9 -13.19 1.57 41.77 - - - 8,764 12.5 - 0.93<br />
iShares MSCI Malaysia EWM 0.53 929.0 -7.90 -2.48 38.97 49.34 28.34 14.97 7,640 14.5 20.08 2.76<br />
iShares MSCI Thail<strong>and</strong> THD 0.62 479.5 -17.99 -7.31 56.76 81.30 42.88 - 5,748 - 30.78 2.56<br />
Global X/InterBolsa FTSE Colombia 20 GXG 0.78 140.7 -5.38 -9.03 51.44 - - - 5,324 21.4 - 0.69<br />
iShares MSCI Mexico EWW 0.53 1,103.0 -10.56 -10.09 27.95 53.82 23.25 5.24 15,532 - 28.49 1.31<br />
iShares MSCI Russia ER<strong>US</strong> 0.65 111.9 -20.63 -11.40 - - - - 33,181 5.7 - -<br />
SPDR S&P BRIC 40 BIK 0.50 410.8 -13.01 -12.22 11.37 79.10 20.37 - 74,879 7.9 28.54 2.16<br />
SPDR S&P China GXC 0.59 698.0 -15.60 -13.16 7.58 60.45 20.34 - 27,048 9.7 29.20 1.93<br />
BLDRS Emerging Markets 50 ADR ADRE 0.30 452.2 -9.33 -13.32 10.98 65.54 16.98 5.76 47,798 7.5 25.56 2.81<br />
SPDR S&P Emerging Markets GMM 0.59 147.8 -12.42 -13.43 18.76 72.29 21.34 - 18,222 9.6 28.10 1.77<br />
First Trust ISE Chindia FNI 0.60 102.3 -14.30 -13.45 18.17 82.24 20.71 - 15,406 12.2 33.77 0.71<br />
iShares MSCI Emerging Markets EEM 0.69 34,821.3 -13.36 -13.47 16.64 68.82 19.16 5.40 16,060 9.3 29.90 2.05<br />
Vanguard MSCI Emerging Markets VWO 0.22 46,291.1 -14.05 -13.74 19.45 75.30 21.26 5.72 19,348 12.1 29.39 1.95<br />
SPDR S&P Emerging Asia Pacific GMF 0.59 534.1 -14.26 -13.79 19.47 70.57 22.38 - 19,712 11.2 30.39 1.68<br />
iShares MSCI South Africa EZA 0.61 568.2 -9.18 -14.05 36.91 51.23 26.71 8.13 10,364 14.8 31.92 3.77<br />
Schwab Emerging Markets Equity SCHE 0.25 400.3 -11.93 -14.27 - - - - 21,192 9.5 - 0.93<br />
iShares S&P Latin America 40 ILF 0.50 1,733.3 -8.16 -14.27 15.53 91.00 22.77 10.93 37,485 - 29.18 2.50<br />
PowerShares FTSE RAFI Emrg Mkts PXH 0.85 444.8 -13.03 -14.40 13.26 67.02 18.92 - 18,398 8.4 29.46 2.33<br />
Guggenheim BRIC EEB 0.60 497.2 -11.84 -14.50 10.70 86.03 19.44 9.66 41,703 6.3 28.64 2.19<br />
iShares FTSE China 25 FXI 0.72 6,798.1 -14.87 -14.95 3.51 46.82 14.73 6.73 73,555 8.6 28.26 2.30<br />
SPDR S&P Emerging Europe GUR 0.59 117.1 -19.54 -15.49 15.70 78.98 13.56 - 15,389 9.1 36.91 1.63<br />
SPDR S&P Emerging Latin America GML 0.59 135.2 -9.72 -16.04 15.39 103.84 24.91 - 24,031 - 31.98 2.03<br />
SPDR S&P Emerging Middle East/Africa GAF 0.59 107.2 -10.52 -16.56 30.55 50.18 19.85 - 6,933 14.0 26.05 2.30<br />
PowerShares Halter <strong>US</strong>X China PGJ 0.60 282.9 -16.32 -16.57 11.31 62.59 15.29 6.49 7,213 8.8 30.00 1.76<br />
iShares MSCI Taiwan EWT 0.71 2,571.6 -14.61 -17.13 22.70 73.62 17.96 2.82 8,682 11.4 32.22 2.20<br />
WisdomTree Emrg Mkts SmallCap Div DGS 0.64 769.5 -16.67 -17.79 30.19 82.94 27.00 - 1,096 10.1 29.17 4.02<br />
iShares MSCI BRIC BKF 0.69 806.5 -14.84 -18.10 9.21 88.86 18.15 - 24,542 7.8 31.45 2.46<br />
iShares MSCI Brazil EWZ 0.61 10,613.1 -11.62 -18.20 7.69 122.06 23.39 12.19 19,138 6.5 33.05 5.75<br />
Market Vec<strong>to</strong>rs Brazil Small-Cap BRF 0.59 658.9 -12.42 -19.35 24.05 - - - 1,148 10.5 - 1.58<br />
Market Vec<strong>to</strong>rs Russia RSX 0.62 1,881.1 -22.91 -19.68 22.14 139.25 19.67 - 19,620 7.0 44.50 0.60<br />
iShares MSCI Pol<strong>and</strong> EPOL 0.61 137.2 -23.30 -19.70 - - - - 4,133 8.7 - 1.58<br />
iShares MSCI Chile ECH 0.61 563.4 -9.67 -20.00 46.57 86.02 29.13 - 6,637 14.2 26.04 1.53<br />
iShares MSCI All Peru EPU 0.62 423.9 -7.97 -20.21 57.69 - - - 3,496 10.7 - 2.46<br />
iShares S&P India Nifty 50 INDY 0.89 195.4 -12.79 -20.74 24.45 - - - 19,838 13.2 - 0.43<br />
PowerShares India PIN 0.78 402.8 -13.40 -21.95 16.29 79.38 18.07 - 18,080 15.4 34.74 0.94<br />
SPDR S&P Emrg Mkts Small Cap EWX 0.65 888.8 -19.10 -22.86 23.51 94.66 24.39 - 875 8.6 30.94 0.73<br />
iPath MSCI India ETN INP 0.89 590.3 -12.11 -23.19 21.23 102.47 21.96 - 16,604 7.9 38.20 -<br />
WisdomTree India Earnings EPI 0.83 922.2 -13.89 -23.64 20.28 95.08 21.55 - 9,624 7.7 36.56 0.86<br />
iShares MSCI Turkey TUR 0.61 442.1 -14.33 -26.51 25.64 102.82 21.47 - 5,660 12.2 37.07 2.75<br />
Guggenheim China Small Cap HAO 0.75 175.0 -21.61 -29.17 15.85 97.75 22.88 - 1,606 7.8 37.41 2.02<br />
International Equity: Frontier<br />
Guggenheim Frontier Markets FRN 0.70 137.3 -9.84 -18.66 33.88 54.34 13.69 - 7,879 - 25.66 0.62<br />
Market Vec<strong>to</strong>rs Vietnam VNM 0.76 236.9 -6.45 -30.18 4.10 - - - 1,507 9.4 - 1.88<br />
Global Equity: Sec<strong>to</strong>r<br />
iShares S&P Global Healthcare IXJ 0.48 522.2 -4.04 7.01 1.87 17.26 9.23 1.13 51,140 15.7 17.48 2.18<br />
iShares S&P Global Consumer Staples KXI 0.48 440.4 -0.40 6.34 13.16 21.72 13.48 7.03 54,412 15.7 15.20 2.30<br />
Market Vec<strong>to</strong>rs Gaming BJK 0.65 117.9 -10.13 3.67 37.88 36.20 22.88 - 5,270 11.9 33.66 2.48<br />
Yield<br />
Data as of 10/31/2011. Source: Morningstar. Exp Ratio is annual expense ratio. <strong>Asset</strong>s are net assets in $<strong>US</strong> millions. 3-Mo is 3-month <strong>to</strong>tal return. YTD is year-<strong>to</strong>-date. 3- <strong>and</strong> 5-year<br />
returns are annualized. Mkt Cap is geometric average market capitalization. P/E is price-<strong>to</strong>-earnings ratio. Std Dev is 3-year st<strong>and</strong>ard deviation. Yield is 12-month. Includes all<br />
U.S.-listed <strong>ETFs</strong> <strong>and</strong> ETNs with assets over $100 million.<br />
ETFR • December 2011 17
December 2011 U.S.-<strong>Listed</strong> <strong>ETFs</strong> <strong>Sorted</strong> <strong>by</strong> <strong>Asset</strong> <strong>Class</strong> <strong>and</strong> <strong>Year</strong>-<strong>to</strong>-<strong>Date</strong> <strong>Return</strong><br />
Vol. 11 | No. 12<br />
Fund Name Ticker Exp Ratio <strong>Asset</strong>s 3-Mo YTD 2010 2009 3-Yr 5-Yr Mkt Cap P/E Std Dev<br />
Global Equity: Sec<strong>to</strong>r (Continued)<br />
iShares S&P Global Telecommunications IXP 0.48 440.6 -2.65 2.02 11.63 10.67 12.41 2.94 66,367 11.6 17.44 4.69<br />
iShares S&P Global Energy IXC 0.48 1,095.9 -6.84 0.44 11.79 24.71 10.24 3.98 75,141 10.6 24.58 2.03<br />
SPDR DJ Global Real Estate RWO 0.50 316.8 -7.08 0.19 24.01 32.04 14.50 - 6,838 13.7 30.69 7.32<br />
iShares S&P Global Infrastructure IGF 0.48 440.8 -4.92 -0.26 6.97 18.14 8.84 - 13,103 13.4 22.84 3.95<br />
iShares S&P Global Technology IXN 0.48 519.3 -0.46 -0.57 10.44 52.24 15.85 2.22 67,356 14.4 22.66 0.76<br />
iShares S&P Global Consumer Discr RXI 0.48 127.9 -6.58 -1.89 23.29 37.45 15.81 0.40 25,622 15.0 25.11 1.50<br />
iShares S&P Global Utilities JXI 0.48 244.8 -3.42 -2.40 -1.79 6.22 2.19 -0.87 18,823 12.3 16.87 4.22<br />
Market Vec<strong>to</strong>rs Gold Miners GDX 0.53 9,507.3 3.41 -4.29 33.90 36.72 41.51 9.77 14,939 17.8 40.31 0.68<br />
iShares S&P North Amer Natural Res IGE 0.48 1,935.0 -10.29 -4.63 23.34 37.10 15.34 5.25 31,356 13.8 26.58 1.74<br />
Guggenheim S&P Global Water CGW 0.65 201.2 -6.77 -5.20 15.02 31.04 12.05 - 4,433 14.7 21.71 2.10<br />
Market Vec<strong>to</strong>rs Agribusiness MOO 0.56 5,832.8 -7.57 -6.56 23.04 58.74 23.74 - 11,392 10.7 26.94 0.65<br />
Jefferies TR/J CRB Global Commodity Equity CRBQ 0.65 100.5 -8.66 -7.16 16.96 - - - 34,440 9.6 - 1.30<br />
Market Vec<strong>to</strong>rs Hard <strong>Asset</strong>s Producers HAP 0.59 188.0 -10.00 -7.32 16.52 42.51 15.26 - 25,851 9.7 26.57 0.87<br />
iShares S&P Global Industrials EXI 0.48 178.3 -8.56 -7.49 23.28 24.92 12.97 0.19 23,962 13.6 26.49 2.11<br />
PowerShares Global Agriculture PAGG 0.75 123.1 -11.27 -7.78 20.96 49.22 21.27 - 11,158 11.5 28.63 0.96<br />
SPDR Global Natural Resources GNR 0.40 179.5 -11.04 -10.59 - - - - 45,945 9.8 - 1.15<br />
Global X Silver Miners SIL 0.65 363.6 -8.64 -11.81 - - - - 3,712 19.9 - 1.02<br />
PowerShares Cleantech PZD 0.60 108.7 -13.84 -12.84 7.61 35.58 8.80 -1.52 3,070 13.5 28.60 0.16<br />
PowerShares <strong>Listed</strong> Private Equity PSP 0.60 329.7 -13.89 -13.60 25.90 29.86 -0.35 -14.63 1,760 5.9 38.24 11.53<br />
iShares S&P Global Financials IXG 0.48 192.1 -11.30 -14.36 3.90 31.74 1.44 -12.26 36,927 9.6 34.77 2.93<br />
iShares S&P Global Materials MXI 0.48 552.3 -13.38 -14.53 19.92 60.38 17.84 4.41 25,553 10.9 30.01 2.29<br />
PowerShares Global Water PIO 0.75 279.0 -12.83 -14.61 11.24 38.63 13.51 - 1,887 11.8 25.84 1.67<br />
iShares S&P Global Timber/Forestry WOOD 0.48 155.7 -9.88 -15.07 16.19 37.71 8.90 - 4,107 12.5 31.75 3.88<br />
Guggenheim Timber CUT 0.70 121.7 -11.56 -15.85 18.19 50.20 16.86 - 3,432 11.3 34.97 3.39<br />
Market Vec<strong>to</strong>rs Coal KOL 0.59 410.0 -22.07 -19.67 31.34 147.48 28.42 - 6,375 12.9 45.88 0.51<br />
Market Vec<strong>to</strong>rs Junior Gold Miners GDXJ 0.54 2,342.2 -13.65 -21.96 66.53 - - - 708 17.3 - 9.41<br />
Market Vec<strong>to</strong>rs Rare Earth Metals REMX 0.57 266.8 -26.95 -23.88 - - - - 1,032 11.5 - -<br />
Market Vec<strong>to</strong>rs Nuclear Energy NLR 0.57 123.8 -14.85 -25.13 16.59 17.33 6.24 - 3,349 15.3 29.29 5.59<br />
Market Vec<strong>to</strong>rs Steel SLX 0.55 195.5 -19.37 -27.27 19.65 112.49 18.39 5.59 11,914 6.4 41.28 1.94<br />
PowerShares Global Clean Energy PBD 0.75 128.1 -22.54 -29.53 -16.09 31.84 -7.37 - 1,319 7.6 35.21 0.90<br />
Global X Lithium LIT 0.75 107.3 -20.14 -30.59 - - - - 1,728 15.4 - 1.55<br />
Global X Uranium URA 0.69 199.3 -20.91 -50.60 - - - - 1,015 - - -<br />
Global Ex-U.S. Equity: Sec<strong>to</strong>r<br />
SPDR DJ Intl Real Estate RWX 0.59 2,231.5 -10.28 -7.68 21.83 36.34 13.83 - 5,584 7.6 26.48 9.96<br />
WisdomTree Global Ex-<strong>US</strong> Real Estate DRW 0.58 119.6 -11.58 -8.50 17.68 43.24 15.31 - 6,305 7.3 28.23 12.86<br />
Vanguard Global ex-<strong>US</strong> Real Estate VNQI 0.35 172.7 -12.59 -10.10 - - - - 5,352 10.3 - -<br />
International Equity: Developed Sec<strong>to</strong>r<br />
iShares FTSE E/N Dev Real Est ex-<strong>US</strong> IFGL 0.48 369.4 -11.63 -8.68 14.57 42.86 13.14 - 6,126 7.9 26.87 6.34<br />
iShares S&P Dev Ex-<strong>US</strong> Property WPS 0.48 129.4 -11.86 -9.70 18.13 37.66 13.84 - 5,323 7.7 27.97 6.23<br />
Guggenheim Canadian Energy Inc ENY 0.70 132.9 -16.27 -14.56 22.60 59.55 9.55 - 4,646 19.2 36.15 2.53<br />
International Equity: Emerging Sec<strong>to</strong>r<br />
EGShares DJ Emrg Mkts Consumer Titans ECON 0.85 260.5 -4.71 -2.01 - - - - 16,803 18.4 - 0.07<br />
iShares S&P Emrg Mkts Infrastructure EMIF 0.75 118.7 -10.49 -10.27 18.66 - - - 7,734 12.1 - 2.95<br />
Global X China Consumer CHIQ 0.65 136.9 -19.48 -17.98 10.79 - - - 4,626 13.7 - 1.24<br />
PowerShares Emrg Mkts Infrastructure PXR 0.75 131.1 -19.42 -23.08 26.20 86.98 27.54 - 3,910 9.6 36.20 1.77<br />
Global Equity: High Dividend Yield<br />
First Trust Dow Jones Global Select Dividend FGD 0.60 128.0 -3.95 0.43 12.60 59.96 19.84 - 9,449 10.8 28.89 4.73<br />
Global Ex-U.S. Equity: High Dividend Yield<br />
SPDR S&P International Dividend DWX 0.45 577.2 -9.66 -7.15 7.87 60.31 17.56 - 6,813 8.4 31.48 6.71<br />
International Equity: High Dividend Yield<br />
PowerShares Intl Dividend Achievers PID 0.50 658.5 -3.79 1.01 13.47 37.96 13.96 0.16 23,406 11.6 23.80 3.79<br />
WisdomTree DEFA Equity Income DTH 0.58 142.8 -6.39 -0.69 -0.99 33.11 10.07 -2.87 32,760 10.2 26.43 4.95<br />
iShares DJ Intl Select Dividend IDV 0.50 667.2 -6.65 -1.68 11.84 60.55 20.06 - 16,252 9.9 28.34 4.94<br />
WisdomTree Emrg Mkts Equity Income DEM 0.63 1,887.5 -10.36 -8.41 24.66 58.07 21.77 - 8,883 10.7 25.67 4.52<br />
International Equity: Alpha Seeking<br />
PowerShares DWA EM Tech Leaders PIE 0.90 172.3 -16.34 -11.24 25.11 59.35 20.40 - 4,675 13.4 31.67 0.53<br />
U.S. Fixed Income: Broad Market - Broad Maturities<br />
iShares Barclays Government/Credit Bond GBF 0.20 112.9 3.67 8.12 5.71 2.84 9.39 - - - 5.50 3.04<br />
Vanguard Total Bond Market BND 0.11 12,867.6 2.45 6.73 6.20 3.36 8.71 - - - 4.68 3.16<br />
SPDR Barclays Aggregate Bond LAG 0.17 284.5 2.10 6.64 6.25 3.71 8.05 - - - 3.99 2.31<br />
iShares Barclays Aggregate Bond AGG 0.22 13,751.3 2.43 6.61 6.37 3.32 8.59 6.18 - - 4.90 3.19<br />
Schwab <strong>US</strong> Aggregate Bond SCHZ 0.10 112.7 2.48 - - - - - - - - -<br />
Yield<br />
Data as of 10/31/2011. Source: Morningstar. Exp Ratio is annual expense ratio. <strong>Asset</strong>s are net assets in $<strong>US</strong> millions. 3-Mo is 3-month <strong>to</strong>tal return. YTD is year-<strong>to</strong>-date. 3- <strong>and</strong> 5-year<br />
returns are annualized. Mkt Cap is geometric average market capitalization. P/E is price-<strong>to</strong>-earnings ratio. Std Dev is 3-year st<strong>and</strong>ard deviation. Yield is 12-month. Includes all<br />
U.S.-listed <strong>ETFs</strong> <strong>and</strong> ETNs with assets over $100 million.<br />
18 ETFR • December 2011
December 2011 U.S.-<strong>Listed</strong> <strong>ETFs</strong> <strong>Sorted</strong> <strong>by</strong> <strong>Asset</strong> <strong>Class</strong> <strong>and</strong> <strong>Year</strong>-<strong>to</strong>-<strong>Date</strong> <strong>Return</strong><br />
Vol. 11 | No. 12<br />
Fund Name Ticker Exp Ratio <strong>Asset</strong>s 3-Mo YTD 2010 2009 3-Yr 5-Yr Mkt Cap P/E Std Dev<br />
U.S. Fixed Income: Broad Market - Short-Term<br />
Vanguard Short-Term Bond BSV 0.11 7,110.6 0.56 2.83 3.89 1.56 5.37 - - - 3.45 1.97<br />
U.S. Fixed Income: Broad Market - Intermediate<br />
Vanguard Intermediate-Term Bond BIV 0.11 2,632.5 3.09 9.78 9.14 3.93 12.32 - - - 7.00 3.68<br />
iShares Barclays Intermdt Gov/Cred Bond GVI 0.20 621.0 1.58 5.25 5.46 1.99 7.51 - - - 4.51 2.69<br />
U.S. Fixed Income: Broad Market - Long-Term<br />
Vanguard Long-Term Bond BLV 0.11 500.4 11.09 19.61 10.01 0.61 17.48 - - - 12.37 4.30<br />
U.S. Fixed Income: Government<br />
Vanguard Short-Term Govt Bond VGSH 0.15 161.7 0.43 1.52 2.29 - 0.57 0.34 - - - 0.82<br />
U.S. Fixed Income: Treasury - Broad Maturities<br />
PowerShares 1-30 Laddered Treasury PLW 0.25 262.2 9.71 15.92 8.80 -11.09 9.77 - - - 12.18 2.89<br />
U.S. Fixed Income: Treasury - Short Term<br />
iShares Barclays 1-3 Yr Treasury Bond SHY 0.15 9,594.6 0.28 1.34 2.28 0.36 1.94 3.66 - - 1.30 0.89<br />
Schwab Short-Term <strong>US</strong> Treasury SCHO 0.12 202.0 0.27 1.24 - - - - - - - 0.41<br />
PIMCO 1-3 <strong>Year</strong> <strong>US</strong> Treasury TUZ 0.09 122.9 0.23 1.05 2.43 - - - - - - 0.77<br />
iShares Barclays Short Treasury Bond SHV 0.15 3,207.3 0.04 0.05 0.12 0.16 0.26 - - - 0.24 0.09<br />
SPDR Barclays 1-3 Month T-Bill BIL 0.13 2,255.3 -0.07 -0.04 -0.04 0.25 0.02 - - - 0.16 -<br />
U.S. Fixed Income: Treasury - Intermediate<br />
iShares Barclays 7-10 Yr Treasury Bond IEF 0.15 4,156.9 5.61 12.74 9.36 -6.56 9.29 8.44 - - 8.88 2.73<br />
Schwab Intermediate-Term <strong>US</strong> Treasury SCHR 0.12 105.6 2.79 8.45 - - - - - - - 1.56<br />
iShares Barclays 3-7 Yr Treasury Bond IEI 0.15 2,361.3 2.11 7.30 6.31 -1.69 5.83 - - - 4.61 1.81<br />
SPDR Barclays Intermediate Treasury ITE 0.13 219.5 1.75 5.56 4.93 -1.55 4.83 - - - 3.82 1.74<br />
U.S. Fixed Income: Treasury - Long-Term<br />
Vanguard Ext Duration Treasury EDV 0.13 167.5 34.48 43.16 9.79 -35.95 14.54 - - - 33.53 3.17<br />
iShares Barclays 20+ Yr Treasury TLT 0.15 3,440.8 19.37 27.01 9.04 -21.75 12.10 9.75 - - 20.22 3.49<br />
iShares Barclays 10-20 Yr Treasury TLH 0.15 423.8 9.61 17.51 9.69 -9.07 12.09 - - - 12.92 3.03<br />
U.S. Fixed Income: Agencies<br />
iShares Barclays MBS Bond MBB 0.31 3,482.4 1.43 4.96 5.58 4.69 7.16 - - - 3.27 3.34<br />
iShares Barclays Agency Bond AGZ 0.20 382.0 1.30 3.90 3.74 1.66 - - - - - 1.73<br />
U.S. Fixed Income: TIPS<br />
PIMCO 15+ <strong>Year</strong> <strong>US</strong> TIPS LTPZ 0.20 323.5 7.84 23.16 8.66 - - - - - - 3.75<br />
SPDR Barclays TIPS IPE 0.18 536.4 2.89 12.95 6.25 9.95 11.79 - - - 6.53 4.02<br />
iShares Barclays TIPS Bond TIP 0.20 21,171.0 2.72 12.51 6.13 8.95 11.92 7.42 - - 6.60 4.20<br />
Schwab <strong>US</strong> TIPS SCHP 0.14 253.9 2.70 12.50 - - - - - - - 2.82<br />
PIMCO 1-5 <strong>Year</strong> <strong>US</strong> TIPS STPZ 0.20 1,017.6 -0.12 5.12 3.51 - - - - - - 3.01<br />
iShares Barclays 0-5 <strong>Year</strong> TIPS Bond STIP 0.20 220.7 -0.11 5.04 - - - - - - - -<br />
U.S. Fixed Income: Municipal - Broad Market<br />
iShares S&P California Muni Bond CMF 0.25 184.3 3.06 13.45 -2.62 9.20 7.36 - - - 7.10 3.67<br />
PowerShares Insured Natl Muni Bond PZA 0.28 535.7 4.12 10.76 -0.47 17.64 9.11 - - - 6.63 4.64<br />
SPDR Barclays Municipal Bond TFI 0.23 926.9 2.12 9.67 -0.51 10.55 7.72 - - - 5.39 3.00<br />
iShares S&P Natl Municipal Bond MUB 0.25 2,279.4 2.80 9.54 0.10 7.14 7.13 - - - 6.08 3.44<br />
Market Vec<strong>to</strong>rs Short Municipal SMB 0.20 111.3 0.71 4.30 1.21 7.82 5.08 - - - 3.78 1.98<br />
U.S. Fixed Income: Municipal - Short Term<br />
iShares S&P Short Term Natl Muni Bond SUB 0.25 439.2 0.49 3.01 0.36 4.24 - - - - - 1.27<br />
SPDR Nuveen Barclays Sh-Trm Muni Bond SHM 0.20 1,377.5 0.16 2.48 1.02 4.06 3.78 - - - 2.40 1.32<br />
U.S. Fixed Income: Municipal - Intermediate<br />
Market Vec<strong>to</strong>rs Intermediate Muni ITM 0.24 297.2 3.45 9.13 1.63 10.56 8.47 - - - 6.55 3.37<br />
PIMCO Intermediate Muni Bond Strategy MUNI 0.35 107.2 0.98 5.24 3.74 - - - - - - 2.33<br />
U.S. Fixed Income: Municipal - High Yield<br />
Market Vec<strong>to</strong>rs High-Yield Municipal HYD 0.35 283.7 4.22 9.64 0.34 - - - - - - 5.99<br />
U.S. Fixed Income: Municipal - VRDO<br />
PowerShares VRDO Tax-Free Weekly PVI 0.25 427.5 0.22 0.49 0.29 1.00 0.79 - - - 0.32 0.55<br />
U.S. Fixed Income: Municipal - Build America Bonds<br />
PowerShares Build America Bond BAB 0.29 664.6 6.37 18.29 9.38 - - - - - - 5.29<br />
U.S. Fixed Income: Corporate - Investment Grade - Broad Maturities<br />
iShares iBoxx $ Inv Gr Corporate Bond LQD 0.15 15,993.0 3.22 9.51 9.33 8.58 15.20 6.80 - - 9.99 4.49<br />
iShares Barclays Credit Bond CFT 0.20 965.3 2.62 8.36 8.42 11.01 13.87 - - - 6.84 4.23<br />
Data as of 10/31/2011. Source: Morningstar. Exp Ratio is annual expense ratio. <strong>Asset</strong>s are net assets in $<strong>US</strong> millions. 3-Mo is 3-month <strong>to</strong>tal return. YTD is year-<strong>to</strong>-date. 3- <strong>and</strong> 5-year<br />
returns are annualized. Mkt Cap is geometric average market capitalization. P/E is price-<strong>to</strong>-earnings ratio. Std Dev is 3-year st<strong>and</strong>ard deviation. Yield is 12-month. Includes all<br />
U.S.-listed <strong>ETFs</strong> <strong>and</strong> ETNs with assets over $100 million.<br />
Yield<br />
ETFR • December 2011 19
December 2011 U.S.-<strong>Listed</strong> <strong>ETFs</strong> <strong>Sorted</strong> <strong>by</strong> <strong>Asset</strong> <strong>Class</strong> <strong>and</strong> <strong>Year</strong>-<strong>to</strong>-<strong>Date</strong> <strong>Return</strong><br />
Vol. 11 | No. 12<br />
Fund Name Ticker Exp Ratio <strong>Asset</strong>s 3-Mo YTD 2010 2009 3-Yr 5-Yr Mkt Cap P/E Std Dev<br />
U.S. Fixed Income: Corporate - Investment Grade - Short-Term<br />
Vanguard Short-Term Corporate Bond VCSH 0.15 2,060.3 -0.47 2.62 5.27 - - - - - - 2.31<br />
iShares Barclays 1-3 <strong>Year</strong> Credit Bond CSJ 0.20 8,514.2 0.22 1.91 2.88 7.17 5.87 - - - 3.30 2.02<br />
SPDR Barclays Sh-Trm Corporate Bond SCPB 0.12 397.2 -0.30 1.61 2.80 - - - - - - 1.65<br />
U.S. Fixed Income: Corporate - Investment Grade - Intermediate<br />
Vanguard Intermediate Corporate Bond VCIT 0.15 804.8 0.95 7.70 9.97 - - - - - - 3.93<br />
iShares Barclays Intermediate Credit Bond CIU 0.20 4,155.8 0.93 5.61 6.83 12.79 11.47 - - - 5.07 3.83<br />
SPDR Barclays <strong>US</strong> Intermediate Corp Bond ITR 0.15 200.3 0.21 5.49 7.16 - - - - - - 3.08<br />
U.S. Fixed Income: Corporate - Investment Grade - Long-Term<br />
iShares 10+ <strong>Year</strong> Credit Bond CLY 0.20 266.9 6.77 16.25 10.69 - - - - - - 4.74<br />
Vanguard Long-Term Corporate Bond VCLT 0.15 344.6 7.78 15.97 10.62 - - - - - - 4.64<br />
U.S. Fixed Income: Corporate - Investment Grade - Fixed Maturities<br />
Guggenheim BulletShares 2013 Corporate Bond BSCD 0.24 102.6 -0.59 1.31 - - - - - - - 1.34<br />
U.S. Fixed Income: Corporate - High Yield - Broad Maturities<br />
PowerShares Fundamental HiYld Corp Bond PHB 0.50 566.7 -0.14 5.51 9.07 23.70 13.08 - - - 17.22 6.23<br />
iShares iBoxx $ HiYld Corporate Bond HYG 0.50 9,961.3 -0.03 4.70 11.96 28.74 17.92 - - - 17.30 7.77<br />
SPDR Barclays High Yield Bond JNK 0.40 8,410.3 -1.26 3.92 14.20 39.35 20.53 - - - 17.78 7.88<br />
U.S. Fixed Income: Corporate - Convertibles<br />
SPDR Barclays Convertible Bond CWB 0.40 736.8 -5.16 -5.44 14.01 - - - 2,057 20.8 - 3.39<br />
U.S. Fixed Income: Corporate - Loans<br />
PowerShares Senior Loan BKLN 0.83 165.9 -1.65 - - - - - - - - -<br />
U.S. Fixed Income: Corporate - Preferred S<strong>to</strong>ck<br />
PowerShares Preferred PGX 0.50 1,395.5 1.23 4.73 11.56 19.69 11.41 - - - 23.61 6.79<br />
SPDR Wells Fargo Preferred S<strong>to</strong>ck PSK 0.45 119.8 -0.79 2.72 13.98 - - - - - - 6.12<br />
PowerShares Financial Preferred PGF 0.60 1,507.8 -1.76 1.75 15.99 38.70 16.68 - - - 35.49 7.24<br />
iShares S&P <strong>US</strong> Preferred S<strong>to</strong>ck PFF 0.48 7,327.9 -1.95 1.06 13.83 38.70 17.83 - - - 28.62 6.96<br />
International Fixed Income: Blended Development<br />
SPDR DB Intl Govt Infl-Protected Bond WIP 0.50 1,290.0 -5.18 3.95 6.56 17.14 11.60 - - - 13.75 3.91<br />
PIMCO Enh Short Maturity Strategy MINT 0.35 1,549.7 -0.57 0.26 1.64 - - - - - - 0.86<br />
WisdomTree Asia Local Debt ALD 0.55 422.9 -3.21 - - - - - - - - -<br />
International Fixed Income: Developed<br />
SPDR Barclays Intl Treasury Bond BWX 0.50 1,626.9 -1.74 5.76 3.82 5.44 8.83 - - - 11.91 1.75<br />
iShares S&P/Citi Intl Treasury Bond IGOV 0.35 282.1 -2.00 4.97 1.59 - - - - - - 2.96<br />
SPDR Barclays Sh-Trm Intl Treasury Bond BWZ 0.35 237.0 -2.90 4.77 1.59 - - - - - - 0.51<br />
iShares S&P/Citi 1-3 Yr Intl Treasury Bond ISHG 0.35 166.8 -3.64 2.48 1.09 - - - - - - 2.67<br />
International Fixed Income: Emerging<br />
PowerShares Emrg Mkts Sov Debt PCY 0.50 1,319.1 0.97 7.73 10.84 36.04 26.44 - - - 14.16 5.45<br />
iShares JPM <strong>US</strong>D Emrg Mkts Bond EMB 0.60 3,144.3 0.64 7.01 10.86 15.26 20.89 - - - 14.85 4.89<br />
WisdomTree Emrg Mkts Local Debt ELD 0.55 1,144.5 -5.15 1.62 - - - - - - - 4.82<br />
Market Vec<strong>to</strong>rs EM Lcl Currency Bond EMLC 0.49 534.0 -5.39 1.17 - - - - - - - 5.37<br />
Commodities: Broad Market<br />
PowerShares DB Commodity Tracking DBC 0.85 5,628.0 -8.45 0.62 11.90 16.19 3.54 4.11 - - 22.08 -<br />
United States Commodity <strong>US</strong>CI 0.95 423.9 -7.50 -4.87 - - - - - - - -<br />
iPath S&P GSCI ETN GSP 0.75 112.7 -5.86 -1.49 8.36 15.25 -4.12 -3.93 - - 26.92 -<br />
GreenHaven Continuous Commodity GCC 0.85 618.4 -6.56 -2.25 25.19 20.07 12.37 - - - 17.45 -<br />
iShares S&P GSCI Commodity GSG 0.75 1,341.3 -5.40 -2.38 7.17 11.22 -4.18 -4.08 - - 25.75 -<br />
ETRACS CMCI ETN UCI 0.65 131.6 -9.72 -4.83 18.61 40.58 11.64 - - - 21.18 -<br />
ELEMENTS Rogers Intl Commodity ETN RJI 0.75 710.2 -8.10 -5.41 17.86 26.45 4.72 - - - 23.15 -<br />
iPath DJ-UBS Commodity ETN DJP 0.75 2,575.0 -8.94 -8.92 16.23 20.09 3.42 -1.61 - - 20.12 -<br />
Commodities: Agriculture<br />
PowerShares DB Agriculture DBA 0.85 2,489.3 -5.71 -6.00 22.35 0.92 6.29 - - - 18.70 -<br />
ELEMENTS RICI Agricultural ETN RJA 0.75 497.2 -7.52 -12.87 35.01 6.29 7.88 - - - 24.24 -<br />
iPath DJ-UBS Agriculture ETN JJA 0.75 155.6 -8.37 -13.33 38.40 13.17 10.82 - - - 26.83 -<br />
iPath DJ-UBS Grains ETN JJG 0.75 224.0 -8.68 -14.39 29.85 -1.86 3.17 - - - 32.26 -<br />
Commoditites: Energy<br />
PowerShares DB Energy DBE 0.75 140.1 -8.20 4.06 2.63 30.36 0.34 - - - 27.41 -<br />
United States 12 Month Oil <strong>US</strong>L 0.85 191.1 -7.64 -6.26 6.52 36.05 -1.55 - - - 29.11 -<br />
PowerShares DB Oil DBO 0.75 589.7 -8.57 -6.63 2.36 42.85 -0.95 - - - 31.12 -<br />
United States Oil <strong>US</strong>O 0.45 1,151.2 -4.49 -8.36 -0.71 18.67 -13.69 -7.26 - - 35.45 -<br />
Yield<br />
Data as of 10/31/2011. Source: Morningstar. Exp Ratio is annual expense ratio. <strong>Asset</strong>s are net assets in $<strong>US</strong> millions. 3-Mo is 3-month <strong>to</strong>tal return. YTD is year-<strong>to</strong>-date. 3- <strong>and</strong> 5-year<br />
returns are annualized. Mkt Cap is geometric average market capitalization. P/E is price-<strong>to</strong>-earnings ratio. Std Dev is 3-year st<strong>and</strong>ard deviation. Yield is 12-month. Includes all<br />
U.S.-listed <strong>ETFs</strong> <strong>and</strong> ETNs with assets over $100 million.<br />
20 ETFR • December 2011
December 2011 U.S.-<strong>Listed</strong> <strong>ETFs</strong> <strong>Sorted</strong> <strong>by</strong> <strong>Asset</strong> <strong>Class</strong> <strong>and</strong> <strong>Year</strong>-<strong>to</strong>-<strong>Date</strong> <strong>Return</strong><br />
Vol. 11 | No. 12<br />
Fund Name Ticker Exp Ratio <strong>Asset</strong>s 3-Mo YTD 2010 2009 3-Yr 5-Yr Mkt Cap P/E Std Dev<br />
Commoditites: Energy (Continued)<br />
iPath S&P GSCI Crude Oil ETN OIL 0.75 468.7 -4.55 -8.32 -1.04 11.22 -16.45 -9.20 - - 38.19 -<br />
United States Natural Gas UNG 0.60 1,361.1 -14.19 -24.81 -40.56 -56.50 -46.12 - - - 31.34 -<br />
Commoditites: Industrial Metals<br />
PowerShares DB Base Metals DBB 0.75 433.9 -19.82 -17.72 8.58 88.92 12.54 - - - 27.56 -<br />
iPath DJ-UBS Copper ETN JJC 0.75 144.3 -20.25 -20.64 29.04 133.55 21.04 - - - 33.26 -<br />
Commodities: Precious Metals<br />
iShares Gold Trust IAU 0.25 9,134.2 5.67 20.65 29.46 23.90 32.82 22.77 - - 19.80 -<br />
SPDR Gold GLD 0.40 68,824.6 5.72 20.63 29.27 23.99 32.87 22.68 - - 19.83 -<br />
ETFS Physical Swiss Gold SGOL 0.39 1,793.0 5.65 20.57 29.23 - - - - - - -<br />
PowerShares DB Gold DGL 0.75 445.8 5.60 19.84 27.89 22.03 31.16 - - - 19.80 -<br />
PowerShares DB Precious Metals DBP 0.75 524.7 0.71 17.39 37.56 26.58 34.91 - - - 23.69 -<br />
iPath DJ-UBS Precious Metals ETN JJP 0.75 102.4 0.18 17.27 41.91 28.42 36.06 - - - - -<br />
ETFS Physical Precious Metal Basket GLTR 0.60 247.6 -5.03 11.99 - - - - - - - -<br />
ETFS Physical Silver SIVR 0.30 666.5 -13.86 11.06 82.16 - - - - - - -<br />
iShares Silver SLV 0.50 10,743.8 -13.93 10.80 82.14 47.29 51.43 22.21 - - 41.36 -<br />
PowerShares DB Silver DBS 0.75 107.8 -14.24 9.85 81.16 47.07 50.42 - - - 41.68 -<br />
ETFS Physical Platinum PPLT 0.60 706.9 -9.99 -10.04 - - - - - - - -<br />
ETFS Physical Palladium PALL 0.60 448.9 -21.70 -19.69 - - - - - - - -<br />
Currency: Blended Development<br />
PowerShares DB <strong>US</strong> Dollar Bearish UDN 0.75 124.2 -3.07 3.69 -1.60 5.24 4.45 - - - 10.83 -<br />
Currency: Developed<br />
CurrencyShares Australian Dollar FXA 0.40 862.4 -3.10 6.49 17.87 28.88 20.43 10.95 - - 17.40 3.79<br />
CurrencyShares Swiss Franc FXF 0.40 516.4 -10.52 5.94 10.54 2.21 9.42 7.49 - - 16.44 -<br />
CurrencyShares Euro FXE 0.40 257.1 -3.61 3.78 -6.87 2.53 2.94 3.05 - - 14.51 0.19<br />
CurrencyShares Japanese Yen FXY 0.40 657.1 -1.66 3.51 14.20 -2.89 7.67 - - - 10.69 -<br />
CurrencyShares Canadian Dollar FXC 0.40 635.8 -4.10 0.35 4.96 15.24 6.33 3.61 - - 12.14 0.13<br />
Currency: Emerging<br />
WisdomTree Dreyfus Brazilian Real BZF 0.45 137.2 -8.68 1.47 12.46 34.01 16.74 - - - 18.21 -<br />
WisdomTree Dreyfus Chinese Yuan CYB 0.45 518.5 0.43 0.99 1.21 1.20 1.50 - - - 3.14 -<br />
WisdomTree Dreyfus Emrg Currency CEW 0.55 391.1 -6.97 -3.59 6.40 - - - - - - -<br />
<strong>Asset</strong> Allocation<br />
iShares S&P Moderate Allocation AOM 0.31 106.7 -1.10 2.25 7.88 13.50 - - 21,239 12.0 - 2.24<br />
iShares S&P Growth Allocation AOR 0.32 101.8 -2.32 1.11 11.14 18.52 - - 16,357 12.4 - 2.33<br />
PowerShares CEF Income Composite PCEF 1.62 244.4 -3.11 -0.12 - - - - 42,645 13.4 - 8.46<br />
Alternatives: Absolute <strong>Return</strong><br />
PowerShares DB G10 Currency Harvest DBV 0.75 347.0 -0.33 2.74 0.85 21.28 6.25 0.04 - - 12.00 -<br />
IQ Hedge Multi-Strategy Tracker QAI 1.06 164.5 -0.40 0.77 2.59 - - - 11,847 11.9 - 1.50<br />
iShares Diversified Alternatives ALT 0.95 128.8 -2.96 -1.96 1.62 - - - - - - -<br />
Cambria Global Tactical GTAA 1.42 163.1 -7.41 -6.11 - - - - 16,809 14.7 - 0.93<br />
WisdomTree Managed Futures Strategy WDTI 0.95 246.2 -9.23 - - - - - - - - -<br />
Alternatives: Tactical Tools<br />
iPath S&P 500 VIX Short-Term Futures ETN VXX 0.89 840.8 71.34 6.65 -72.40 - - - - - - -<br />
iPath S&P 500 VIX Mid-Term Futures ETN VXZ 0.89 402.6 24.36 -7.62 -14.43 - - - - - - -<br />
Leveraged<br />
ProShares Ultra Gold UGL 0.95 419.3 8.08 37.47 58.28 41.39 - - - - - -<br />
PowerShares DB Gold Dbl Long ETN DGP 0.75 727.5 7.89 36.36 62.37 46.16 66.08 - - - 39.69 -<br />
ProShares Ultra 7-10 <strong>Year</strong> Treasury <strong>US</strong>T 0.95 177.0 11.28 25.03 - - - - - - - 0.02<br />
ProShares Ultra QQQ QLD 0.95 674.2 -3.12 8.40 36.90 121.20 36.27 3.13 - - 42.43 -<br />
ProShares Ultra Dow30 DDM 0.95 280.2 -4.71 5.86 25.37 39.71 16.34 -3.90 - - 36.47 0.46<br />
ProShares UltraPro QQQ TQQQ 0.95 178.7 -9.32 5.32 - - - - - - - -<br />
ProShares Ultra Real Estate URE 0.95 377.0 -12.98 3.26 48.36 12.45 -0.22 - - - 65.46 1.15<br />
ProShares Ultra Technology ROM 0.95 104.9 -2.07 0.60 19.91 146.38 31.67 - - - 44.72 -<br />
Direxion Daily Real Estate Bull 3x DRN 1.03 141.1 -26.08 -2.62 63.51 - - - 6,286 32.3 - 0.10<br />
ProShares Ultra Oil/Gas DIG 0.95 295.8 -21.01 -2.91 33.69 20.59 8.34 - - - 48.55 0.14<br />
ProShares Ultra S&P 500 SSO 0.92 1,566.0 -8.52 -3.24 26.86 47.05 13.80 -9.14 - - 39.86 0.56<br />
Direxion Daily Technology Bull 3x TYH 2.25 208.7 -7.40 -8.20 21.28 240.15 - - 67,698 13.1 - -<br />
ProShares UltraPro S&P 500 UPRO 0.95 298.6 -17.01 -10.87 36.37 - - - - - - 0.06<br />
Direxion Daily Large Cap Bull 3x BGU 1.18 291.9 -19.15 -13.26 39.81 63.98 - - 33,666 12.6 - -<br />
ProShares Ultra Silver AGQ 0.95 856.3 -36.68 -15.04 182.44 78.25 - - - - - -<br />
PowerShares DB Agriculture Dbl Long ETN DAG 0.75 104.6 -14.99 -16.13 30.88 5.70 6.57 - - - 49.78 -<br />
ProShares Ultra Russell 2000 UWM 0.98 191.6 -19.03 -17.08 50.63 42.03 11.10 - - - 52.94 -<br />
Direxion Daily Energy Bull 3x ERX 1.03 374.1 -35.69 -17.11 48.96 14.89 - - 67,682 14.5 - -<br />
Direxion Daily Gold Miners Bull 2X NUGT 0.95 109.1 1.53 -17.12 - - - - 14,004 20.1 - -<br />
Data as of 10/31/2011. Source: Morningstar. Exp Ratio is annual expense ratio. <strong>Asset</strong>s are net assets in $<strong>US</strong> millions. 3-Mo is 3-month <strong>to</strong>tal return. YTD is year-<strong>to</strong>-date. 3- <strong>and</strong> 5-year<br />
returns are annualized. Mkt Cap is geometric average market capitalization. P/E is price-<strong>to</strong>-earnings ratio. Std Dev is 3-year st<strong>and</strong>ard deviation. Yield is 12-month. Includes all<br />
U.S.-listed <strong>ETFs</strong> <strong>and</strong> ETNs with assets over $100 million.<br />
Yield<br />
ETFR • December 2011 21
December 2011 U.S.-<strong>Listed</strong> <strong>ETFs</strong> <strong>Sorted</strong> <strong>by</strong> <strong>Asset</strong> <strong>Class</strong> <strong>and</strong> <strong>Year</strong>-<strong>to</strong>-<strong>Date</strong> <strong>Return</strong><br />
Vol. 11 | No. 12<br />
Fund Name Ticker Exp Ratio <strong>Asset</strong>s 3-Mo YTD 2010 2009 3-Yr 5-Yr Mkt Cap P/E Std Dev<br />
Leveraged (Continued)<br />
ProShares Ultra DJ-UBS Crude Oil UCO 0.95 380.2 -14.01 -27.03 -1.46 -7.38 - - - - - -<br />
ProShares Ultra Financials UYG 0.95 812.1 -20.55 -29.21 18.04 -5.34 -21.74 - - - 62.75 0.32<br />
VelocityShares Daily 2X VIX Sh-Trm ETN TVIX 1.65 159.5 114.56 -29.85 - - - - - - - -<br />
ProShares Ultra Basic Materials UYM 0.95 257.9 -28.49 -29.99 57.39 126.82 19.44 - - - 64.86 -<br />
Direxion Daily Semiconduc<strong>to</strong>r Bull 3X SOXL 1.03 121.7 -13.08 -34.23 - - - - 11,000 10.3 - -<br />
Direxion Daily Small Cap Bull 3x TNA 1.03 905.7 -34.65 -34.40 69.81 41.15 - - 831 13.3 - -<br />
Direxion Daily Financial Bull 3x FAS 1.02 1,585.3 -36.05 -47.31 13.02 -41.44 - - 27,790 12.4 - -<br />
Direxion Daily Emrg Mkts Bull 3x EDC 1.01 400.1 -46.51 -52.14 24.29 206.32 - - 20,107 11.6 - 0.19<br />
Inverse<br />
ProShares Short MSCI Emrg Mkts EUM 0.95 282.7 8.02 4.96 -20.92 -50.67 -29.63 - - - 28.13 -<br />
ProShares UltraShort FTSE China 25 FXP 0.95 179.8 12.86 2.73 -28.30 -76.27 -58.80 - - - 60.99 -<br />
ProShares Short Financials SEF 0.95 124.3 0.35 2.62 -17.43 -41.60 -20.93 - - - 31.71 -<br />
ProShares Short MSCI EAFE EFZ 0.95 248.9 6.10 0.42 -14.24 -30.36 -18.08 - - - 24.29 -<br />
ProShares UltraShort Financials SKF 0.95 347.9 -5.81 -2.44 -35.33 -76.48 -50.28 - - - 60.72 -<br />
PowerShares DB <strong>US</strong> Dollar Bullish UUP 0.75 1,657.9 2.57 -5.02 -1.60 -6.52 -6.40 - - - 11.04 -<br />
ProShares Short Russell 2000 RWM 0.95 561.4 -0.20 -5.44 -27.39 -32.57 -22.83 - - - 25.37 -<br />
ProShares Short S&P 500 SH 0.90 2,667.4 -1.10 -6.02 -16.59 -27.02 -16.63 -4.55 - - 18.84 -<br />
Direxion Daily Emrg Mkts Bear 3x EDZ 1.15 110.2 6.97 -7.06 -59.34 -92.47 - - - - - -<br />
ProShares Short Dow30 DOG 0.95 278.1 -2.09 -9.14 -15.29 -23.66 -15.84 -5.75 - - 17.64 -<br />
PowerShares DB Crude Oil Dbl Short ETN DTO 0.75 236.3 -6.78 -9.41 -20.26 -54.19 -10.66 - - - 70.55 -<br />
ProShares UltraShort Yen YCS 0.95 270.5 2.08 -10.04 -26.43 -2.52 - - - - - -<br />
ProShares UltraShort DJ-UBS Crude Oil SCO 0.95 118.4 -3.95 -10.05 -25.49 -56.89 - - - - - -<br />
ProShares Short QQQ PSQ 0.95 234.5 -3.53 -11.62 -20.61 -40.20 -24.21 -11.48 - - 19.14 -<br />
ProShares UltraShort Euro EUO 0.95 896.8 5.65 -11.67 8.61 -12.04 - - - - - -<br />
ProShares UltraShort S&P 500 SDS 0.89 2,475.4 -5.15 -14.77 -32.21 -50.58 -34.65 -15.74 - - 36.52 -<br />
Direxion Daily Financial Bear 3x FAZ 1.15 1,207.6 -17.84 -15.81 -51.36 -94.56 - - - - - -<br />
ProShares UltraShort Russell 2000 TWM 0.95 422.8 -6.39 -17.50 -50.14 -60.27 -47.01 - - - 48.44 -<br />
ProShares UltraShort MSCI Europe EPV 0.95 110.5 -1.30 -19.62 -34.66 - - - - - - -<br />
ProShares UltraShort Dow 30 DXD 0.95 349.5 -6.42 -19.66 -29.76 -44.94 -32.60 -16.89 - - 34.51 -<br />
ProShares UltraShort 7-10 Yr Treasury PST 0.95 397.2 -11.67 -23.83 -21.51 2.41 -22.16 - - - 16.96 -<br />
ProShares Short 20+ Yr Treasury TBF 0.95 781.7 -18.17 -24.90 -12.39 - - - - - - -<br />
ProShares UltraShort QQQ QID 0.95 671.3 -9.65 -24.99 -38.90 -66.80 -45.87 -27.96 - - 36.84 -<br />
ProShares UltraPro Short S&P 500 SPXU 0.95 533.9 -11.85 -26.02 -46.51 - - - - - - -<br />
ProShares UltraShort Oil/Gas DUG 0.95 110.5 0.85 -26.67 -41.26 -49.12 -43.33 - - - 45.86 -<br />
Direxion Daily Large Cap Bear 3x BGZ 1.02 198.7 -11.66 -26.73 -48.74 -70.71 - - - - - -<br />
ProShares UltraShort Real Estate SRS 0.95 164.6 -8.79 -29.11 -51.63 -85.21 -71.10 - - - 63.35 -<br />
Direxion Daily Small Cap Bear 3x TZA 1.15 925.8 -18.62 -34.59 -68.34 -79.41 - - - - - -<br />
ProShares UltraPro Short QQQ SQQQ 0.95 112.4 -17.92 -39.03 - - - - - - - -<br />
ProShares UltraShort Gold GLL 0.95 142.5 -17.48 -39.39 -46.28 -45.81 - - - - - -<br />
Direxion Daily Energy Bear 3x ERY 1.18 110.2 -6.36 -42.57 -60.02 -69.54 - - - - - -<br />
ProShares UltraShort 20+ Yr Treasury TBT 0.93 3,630.6 -34.41 -44.30 -25.74 32.20 -31.57 - - - 37.39 -<br />
VelocityShares Daily Inv VIX Sh-Trm ETN XIV 1.35 362.8 -58.95 -45.12 - - - - - - - -<br />
Direxion Daily 30-Yr Treasury Bear 3x TMV 1.14 291.7 -49.74 -61.37 -36.69 - - - - - - -<br />
ProShares UltraShort Silver ZSL 0.95 294.6 -14.23 -70.54 -79.50 -72.97 - - - - - -<br />
Active Bear HDGE 1.85 116.0 4.56 - - - - - - - - -<br />
Yield<br />
READ IT IN<br />
FIRST<br />
Data as of 10/31/2011. Source: Morningstar. Exp Ratio is annual expense ratio. <strong>Asset</strong>s are net assets in $<strong>US</strong> millions. 3-Mo is 3-month <strong>to</strong>tal return. YTD is year-<strong>to</strong>-date. 3- <strong>and</strong> 5-year<br />
returns are annualized. Mkt Cap is geometric average market capitalization. P/E is price-<strong>to</strong>-earnings ratio. Std Dev is 3-year st<strong>and</strong>ard deviation. Yield is 12-month. Includes all<br />
U.S.-listed <strong>ETFs</strong> <strong>and</strong> ETNs with assets over $100 million.<br />
22 ETFR • December 2011
BND<br />
Vanguard Total Bond Market ETF<br />
BND has a 35% lower expense ratio than the industry average.*<br />
Are you Vanguarding ® your clients’ portfolios?<br />
Lower expense ratios let your clients keep more of their returns. Start Vanguarding their<br />
portfolios with the Vanguard Total Bond Market ETF. With a 0.11% expense ratio, it can help<br />
your clients reach their goals.<br />
Take a closer look at advisors.vanguard.com/ BND<br />
800-523-0664<br />
All investments are subject <strong>to</strong> risk. Vanguard funds are not insured or guaranteed. Investments in bond funds are subject <strong>to</strong><br />
interest rate, credit, <strong>and</strong> inflation risk.<br />
To buy or sell Vanguard <strong>ETFs</strong>, contact your financial advisor. Usual commissions apply. Not redeemable. Market price may be<br />
more or less than NAV.<br />
For more information about Vanguard ETF Shares, visit advisors.vanguard.com/BND, call 800-523-0664, or contact your broker<br />
<strong>to</strong> obtain a prospectus. Investment objectives, risks, charges, expenses, <strong>and</strong> other important information are contained in the<br />
prospectus; read <strong>and</strong> consider it carefully before investing.<br />
*Source: Morningstar as of 05/01/2011. Based on 2011 industry average expense ratio for bond <strong>ETFs</strong> of 0.17% <strong>and</strong> Vanguard BND<br />
expense ratio of 0.11%.<br />
© 2011 The Vanguard Group, Inc. All rights reserved. U.S. Pat. No. 6,879,964 B2; 7,337,138. Vanguard Marketing Corporation, Distribu<strong>to</strong>r.<br />
Follow us @Vanguard_FA for important insights, news <strong>and</strong> education.
What’s really in your ETF index?<br />
Market Vec<strong>to</strong>rs Index Methodology<br />
For Emerging Markets ETF Inves<strong>to</strong>rs.<br />
➤ Inclusive.<br />
Includes publicly traded companies deriving at least 50% of their revenues from a country, even if the company is listed,<br />
domiciled or headquartered elsewhere. Many emerging market companies list in New York, Hong Kong, London <strong>and</strong> Toron<strong>to</strong>.<br />
➤ Diversified.<br />
S<strong>to</strong>ck weightings are capped at 8%, often resulting in greater diversification <strong>by</strong> holding <strong>and</strong> <strong>by</strong> sec<strong>to</strong>r.<br />
➤ Liquid.<br />
Each s<strong>to</strong>ck must meet minimum requirements for market capitalization <strong>and</strong> daily trading volume. 1<br />
Improves ability <strong>to</strong> track index.<br />
➤ Transparent.<br />
Constituents <strong>and</strong> weights are updated <strong>and</strong> published daily, <strong>and</strong> are accessible for free at vaneck.com.<br />
Market Vec<strong>to</strong>rs Indonesia Index ETF (IDX) 2<br />
Based on the Market Vec<strong>to</strong>rs Indonesia Index (MVIDXTR) 3<br />
➤ Inclusive <strong>and</strong> diversified Indonesia exposure.<br />
➤ Constituents must meet minimum liquidity requirements.<br />
➤ See the latest fund performance <strong>and</strong> get the full list<br />
of index constituents <strong>and</strong> weights, updated daily, at<br />
vaneck.com/idx.<br />
vaneck.com/idx ➤ 888.MKT.VCTR<br />
1 To be “liquid,” a s<strong>to</strong>ck must have: a market cap over <strong>US</strong>D $150 million, a three-month average daily trading volume over <strong>US</strong>D $1 million, <strong>and</strong><br />
traded at least 250,000 shares per month over the last six months.<br />
2 The Fund is classified as a “non-diversified” investment company under the 1940 Act.<br />
3<br />
Fac<strong>to</strong>rs identified refer <strong>to</strong> the index.<br />
The Fund is subject <strong>to</strong> elevated risks, including those associated with investing in foreign securities, in particular in Indonesian issuers, which<br />
include, among others, expropriation, confisca<strong>to</strong>ry taxation, political instability, armed conflict <strong>and</strong> social instability. Inves<strong>to</strong>rs should be willing <strong>to</strong><br />
accept a high degree of volatility <strong>and</strong> the potential of significant loss. The Fund may loan its securities, which may subject it <strong>to</strong> additional credit<br />
<strong>and</strong> counterparty risk. Please refer <strong>to</strong> the prospectus for complete risk information. ➤ Fund shares are not individually redeemable <strong>and</strong> will be<br />
issued <strong>and</strong> redeemed at their NAV only through certain authorized broker-dealers in large, specified blocks of shares called “creation units” <strong>and</strong><br />
otherwise can be bought <strong>and</strong> sold only through exchange trading. Creation units are issued <strong>and</strong> redeemed principally in kind. Shares may trade at a<br />
premium or discount <strong>to</strong> their NAV in the secondary market. ➤ The Market Vec<strong>to</strong>rs Indonesia Index (the “Index”) is the exclusive property of 4assetmanagement<br />
GmbH, which has contracted with Structured Solutions AG <strong>to</strong> maintain <strong>and</strong> calculate the Index. Structured Solutions AG uses its best<br />
efforts <strong>to</strong> ensure that the Index is calculated correctly. Irrespective of its obligations <strong>to</strong>ward 4asset-management GmbH, Structured Solutions AG<br />
has no obligation <strong>to</strong> point out errors in the Index <strong>to</strong> third parties. Market Vec<strong>to</strong>rs Indonesia Index ETF (the “Fund”) is not sponsored, endorsed, sold<br />
or promoted <strong>by</strong> 4asset-management GmbH, <strong>and</strong> 4asset-management GmbH makes no representation regarding the advisability of investing in the<br />
Fund. ➤ Investing involves risk, including possible loss of principal. An inves<strong>to</strong>r should consider investment objectives, risks, charges<br />
<strong>and</strong> expenses of the investment company carefully before investing. To obtain a prospectus or summary prospectus, which contains<br />
this <strong>and</strong> other information, call 888.MKT.VCTR or visit vaneck.com/idx. Please read the prospectus or summary prospectus carefully<br />
before investing.<br />
V A N E C K S E C U R I T I E S C O R P O R A T I O N , D I S T R I B U T O R ■ 3 3 5 M A D I S O N A V E N U E ■ N E W Y O R K , N Y 1 0 0 1 7


