

US-Listed ETFs Sorted by Asset Class and Year-to-Date Return
US-Listed ETFs Sorted by Asset Class and Year-to-Date Return
US-Listed ETFs Sorted by Asset Class and Year-to-Date Return

Create successful ePaper yourself
Turn your PDF publications into a flip-book with our unique Google optimized e-Paper software.
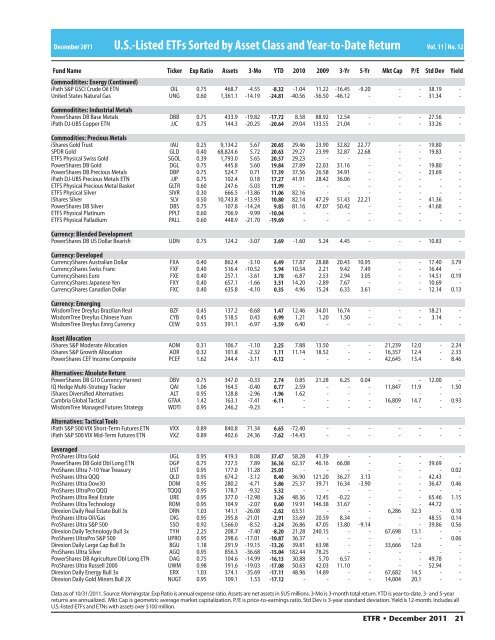
December 2011 U.S.-<strong>Listed</strong> <strong>ETFs</strong> <strong>Sorted</strong> <strong>by</strong> <strong>Asset</strong> <strong>Class</strong> <strong>and</strong> <strong>Year</strong>-<strong>to</strong>-<strong>Date</strong> <strong>Return</strong><br />
Vol. 11 | No. 12<br />
Fund Name Ticker Exp Ratio <strong>Asset</strong>s 3-Mo YTD 2010 2009 3-Yr 5-Yr Mkt Cap P/E Std Dev<br />
Commoditites: Energy (Continued)<br />
iPath S&P GSCI Crude Oil ETN OIL 0.75 468.7 -4.55 -8.32 -1.04 11.22 -16.45 -9.20 - - 38.19 -<br />
United States Natural Gas UNG 0.60 1,361.1 -14.19 -24.81 -40.56 -56.50 -46.12 - - - 31.34 -<br />
Commoditites: Industrial Metals<br />
PowerShares DB Base Metals DBB 0.75 433.9 -19.82 -17.72 8.58 88.92 12.54 - - - 27.56 -<br />
iPath DJ-UBS Copper ETN JJC 0.75 144.3 -20.25 -20.64 29.04 133.55 21.04 - - - 33.26 -<br />
Commodities: Precious Metals<br />
iShares Gold Trust IAU 0.25 9,134.2 5.67 20.65 29.46 23.90 32.82 22.77 - - 19.80 -<br />
SPDR Gold GLD 0.40 68,824.6 5.72 20.63 29.27 23.99 32.87 22.68 - - 19.83 -<br />
ETFS Physical Swiss Gold SGOL 0.39 1,793.0 5.65 20.57 29.23 - - - - - - -<br />
PowerShares DB Gold DGL 0.75 445.8 5.60 19.84 27.89 22.03 31.16 - - - 19.80 -<br />
PowerShares DB Precious Metals DBP 0.75 524.7 0.71 17.39 37.56 26.58 34.91 - - - 23.69 -<br />
iPath DJ-UBS Precious Metals ETN JJP 0.75 102.4 0.18 17.27 41.91 28.42 36.06 - - - - -<br />
ETFS Physical Precious Metal Basket GLTR 0.60 247.6 -5.03 11.99 - - - - - - - -<br />
ETFS Physical Silver SIVR 0.30 666.5 -13.86 11.06 82.16 - - - - - - -<br />
iShares Silver SLV 0.50 10,743.8 -13.93 10.80 82.14 47.29 51.43 22.21 - - 41.36 -<br />
PowerShares DB Silver DBS 0.75 107.8 -14.24 9.85 81.16 47.07 50.42 - - - 41.68 -<br />
ETFS Physical Platinum PPLT 0.60 706.9 -9.99 -10.04 - - - - - - - -<br />
ETFS Physical Palladium PALL 0.60 448.9 -21.70 -19.69 - - - - - - - -<br />
Currency: Blended Development<br />
PowerShares DB <strong>US</strong> Dollar Bearish UDN 0.75 124.2 -3.07 3.69 -1.60 5.24 4.45 - - - 10.83 -<br />
Currency: Developed<br />
CurrencyShares Australian Dollar FXA 0.40 862.4 -3.10 6.49 17.87 28.88 20.43 10.95 - - 17.40 3.79<br />
CurrencyShares Swiss Franc FXF 0.40 516.4 -10.52 5.94 10.54 2.21 9.42 7.49 - - 16.44 -<br />
CurrencyShares Euro FXE 0.40 257.1 -3.61 3.78 -6.87 2.53 2.94 3.05 - - 14.51 0.19<br />
CurrencyShares Japanese Yen FXY 0.40 657.1 -1.66 3.51 14.20 -2.89 7.67 - - - 10.69 -<br />
CurrencyShares Canadian Dollar FXC 0.40 635.8 -4.10 0.35 4.96 15.24 6.33 3.61 - - 12.14 0.13<br />
Currency: Emerging<br />
WisdomTree Dreyfus Brazilian Real BZF 0.45 137.2 -8.68 1.47 12.46 34.01 16.74 - - - 18.21 -<br />
WisdomTree Dreyfus Chinese Yuan CYB 0.45 518.5 0.43 0.99 1.21 1.20 1.50 - - - 3.14 -<br />
WisdomTree Dreyfus Emrg Currency CEW 0.55 391.1 -6.97 -3.59 6.40 - - - - - - -<br />
<strong>Asset</strong> Allocation<br />
iShares S&P Moderate Allocation AOM 0.31 106.7 -1.10 2.25 7.88 13.50 - - 21,239 12.0 - 2.24<br />
iShares S&P Growth Allocation AOR 0.32 101.8 -2.32 1.11 11.14 18.52 - - 16,357 12.4 - 2.33<br />
PowerShares CEF Income Composite PCEF 1.62 244.4 -3.11 -0.12 - - - - 42,645 13.4 - 8.46<br />
Alternatives: Absolute <strong>Return</strong><br />
PowerShares DB G10 Currency Harvest DBV 0.75 347.0 -0.33 2.74 0.85 21.28 6.25 0.04 - - 12.00 -<br />
IQ Hedge Multi-Strategy Tracker QAI 1.06 164.5 -0.40 0.77 2.59 - - - 11,847 11.9 - 1.50<br />
iShares Diversified Alternatives ALT 0.95 128.8 -2.96 -1.96 1.62 - - - - - - -<br />
Cambria Global Tactical GTAA 1.42 163.1 -7.41 -6.11 - - - - 16,809 14.7 - 0.93<br />
WisdomTree Managed Futures Strategy WDTI 0.95 246.2 -9.23 - - - - - - - - -<br />
Alternatives: Tactical Tools<br />
iPath S&P 500 VIX Short-Term Futures ETN VXX 0.89 840.8 71.34 6.65 -72.40 - - - - - - -<br />
iPath S&P 500 VIX Mid-Term Futures ETN VXZ 0.89 402.6 24.36 -7.62 -14.43 - - - - - - -<br />
Leveraged<br />
ProShares Ultra Gold UGL 0.95 419.3 8.08 37.47 58.28 41.39 - - - - - -<br />
PowerShares DB Gold Dbl Long ETN DGP 0.75 727.5 7.89 36.36 62.37 46.16 66.08 - - - 39.69 -<br />
ProShares Ultra 7-10 <strong>Year</strong> Treasury <strong>US</strong>T 0.95 177.0 11.28 25.03 - - - - - - - 0.02<br />
ProShares Ultra QQQ QLD 0.95 674.2 -3.12 8.40 36.90 121.20 36.27 3.13 - - 42.43 -<br />
ProShares Ultra Dow30 DDM 0.95 280.2 -4.71 5.86 25.37 39.71 16.34 -3.90 - - 36.47 0.46<br />
ProShares UltraPro QQQ TQQQ 0.95 178.7 -9.32 5.32 - - - - - - - -<br />
ProShares Ultra Real Estate URE 0.95 377.0 -12.98 3.26 48.36 12.45 -0.22 - - - 65.46 1.15<br />
ProShares Ultra Technology ROM 0.95 104.9 -2.07 0.60 19.91 146.38 31.67 - - - 44.72 -<br />
Direxion Daily Real Estate Bull 3x DRN 1.03 141.1 -26.08 -2.62 63.51 - - - 6,286 32.3 - 0.10<br />
ProShares Ultra Oil/Gas DIG 0.95 295.8 -21.01 -2.91 33.69 20.59 8.34 - - - 48.55 0.14<br />
ProShares Ultra S&P 500 SSO 0.92 1,566.0 -8.52 -3.24 26.86 47.05 13.80 -9.14 - - 39.86 0.56<br />
Direxion Daily Technology Bull 3x TYH 2.25 208.7 -7.40 -8.20 21.28 240.15 - - 67,698 13.1 - -<br />
ProShares UltraPro S&P 500 UPRO 0.95 298.6 -17.01 -10.87 36.37 - - - - - - 0.06<br />
Direxion Daily Large Cap Bull 3x BGU 1.18 291.9 -19.15 -13.26 39.81 63.98 - - 33,666 12.6 - -<br />
ProShares Ultra Silver AGQ 0.95 856.3 -36.68 -15.04 182.44 78.25 - - - - - -<br />
PowerShares DB Agriculture Dbl Long ETN DAG 0.75 104.6 -14.99 -16.13 30.88 5.70 6.57 - - - 49.78 -<br />
ProShares Ultra Russell 2000 UWM 0.98 191.6 -19.03 -17.08 50.63 42.03 11.10 - - - 52.94 -<br />
Direxion Daily Energy Bull 3x ERX 1.03 374.1 -35.69 -17.11 48.96 14.89 - - 67,682 14.5 - -<br />
Direxion Daily Gold Miners Bull 2X NUGT 0.95 109.1 1.53 -17.12 - - - - 14,004 20.1 - -<br />
Data as of 10/31/2011. Source: Morningstar. Exp Ratio is annual expense ratio. <strong>Asset</strong>s are net assets in $<strong>US</strong> millions. 3-Mo is 3-month <strong>to</strong>tal return. YTD is year-<strong>to</strong>-date. 3- <strong>and</strong> 5-year<br />
returns are annualized. Mkt Cap is geometric average market capitalization. P/E is price-<strong>to</strong>-earnings ratio. Std Dev is 3-year st<strong>and</strong>ard deviation. Yield is 12-month. Includes all<br />
U.S.-listed <strong>ETFs</strong> <strong>and</strong> ETNs with assets over $100 million.<br />
Yield<br />
ETFR • December 2011 21


