

US-Listed ETFs Sorted by Asset Class and Year-to-Date Return
US-Listed ETFs Sorted by Asset Class and Year-to-Date Return
US-Listed ETFs Sorted by Asset Class and Year-to-Date Return

Create successful ePaper yourself
Turn your PDF publications into a flip-book with our unique Google optimized e-Paper software.
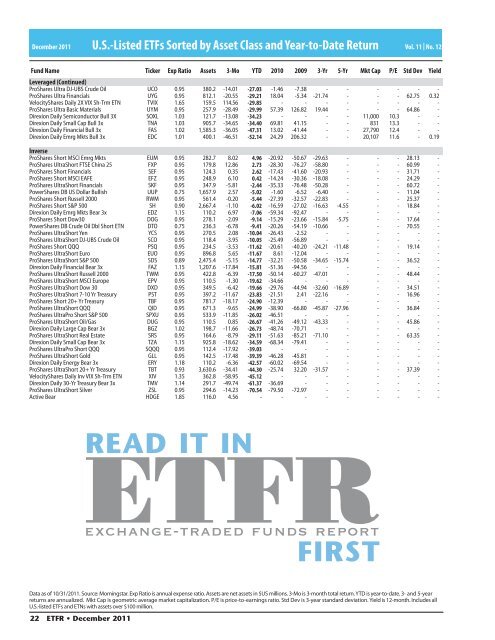
December 2011 U.S.-<strong>Listed</strong> <strong>ETFs</strong> <strong>Sorted</strong> <strong>by</strong> <strong>Asset</strong> <strong>Class</strong> <strong>and</strong> <strong>Year</strong>-<strong>to</strong>-<strong>Date</strong> <strong>Return</strong><br />
Vol. 11 | No. 12<br />
Fund Name Ticker Exp Ratio <strong>Asset</strong>s 3-Mo YTD 2010 2009 3-Yr 5-Yr Mkt Cap P/E Std Dev<br />
Leveraged (Continued)<br />
ProShares Ultra DJ-UBS Crude Oil UCO 0.95 380.2 -14.01 -27.03 -1.46 -7.38 - - - - - -<br />
ProShares Ultra Financials UYG 0.95 812.1 -20.55 -29.21 18.04 -5.34 -21.74 - - - 62.75 0.32<br />
VelocityShares Daily 2X VIX Sh-Trm ETN TVIX 1.65 159.5 114.56 -29.85 - - - - - - - -<br />
ProShares Ultra Basic Materials UYM 0.95 257.9 -28.49 -29.99 57.39 126.82 19.44 - - - 64.86 -<br />
Direxion Daily Semiconduc<strong>to</strong>r Bull 3X SOXL 1.03 121.7 -13.08 -34.23 - - - - 11,000 10.3 - -<br />
Direxion Daily Small Cap Bull 3x TNA 1.03 905.7 -34.65 -34.40 69.81 41.15 - - 831 13.3 - -<br />
Direxion Daily Financial Bull 3x FAS 1.02 1,585.3 -36.05 -47.31 13.02 -41.44 - - 27,790 12.4 - -<br />
Direxion Daily Emrg Mkts Bull 3x EDC 1.01 400.1 -46.51 -52.14 24.29 206.32 - - 20,107 11.6 - 0.19<br />
Inverse<br />
ProShares Short MSCI Emrg Mkts EUM 0.95 282.7 8.02 4.96 -20.92 -50.67 -29.63 - - - 28.13 -<br />
ProShares UltraShort FTSE China 25 FXP 0.95 179.8 12.86 2.73 -28.30 -76.27 -58.80 - - - 60.99 -<br />
ProShares Short Financials SEF 0.95 124.3 0.35 2.62 -17.43 -41.60 -20.93 - - - 31.71 -<br />
ProShares Short MSCI EAFE EFZ 0.95 248.9 6.10 0.42 -14.24 -30.36 -18.08 - - - 24.29 -<br />
ProShares UltraShort Financials SKF 0.95 347.9 -5.81 -2.44 -35.33 -76.48 -50.28 - - - 60.72 -<br />
PowerShares DB <strong>US</strong> Dollar Bullish UUP 0.75 1,657.9 2.57 -5.02 -1.60 -6.52 -6.40 - - - 11.04 -<br />
ProShares Short Russell 2000 RWM 0.95 561.4 -0.20 -5.44 -27.39 -32.57 -22.83 - - - 25.37 -<br />
ProShares Short S&P 500 SH 0.90 2,667.4 -1.10 -6.02 -16.59 -27.02 -16.63 -4.55 - - 18.84 -<br />
Direxion Daily Emrg Mkts Bear 3x EDZ 1.15 110.2 6.97 -7.06 -59.34 -92.47 - - - - - -<br />
ProShares Short Dow30 DOG 0.95 278.1 -2.09 -9.14 -15.29 -23.66 -15.84 -5.75 - - 17.64 -<br />
PowerShares DB Crude Oil Dbl Short ETN DTO 0.75 236.3 -6.78 -9.41 -20.26 -54.19 -10.66 - - - 70.55 -<br />
ProShares UltraShort Yen YCS 0.95 270.5 2.08 -10.04 -26.43 -2.52 - - - - - -<br />
ProShares UltraShort DJ-UBS Crude Oil SCO 0.95 118.4 -3.95 -10.05 -25.49 -56.89 - - - - - -<br />
ProShares Short QQQ PSQ 0.95 234.5 -3.53 -11.62 -20.61 -40.20 -24.21 -11.48 - - 19.14 -<br />
ProShares UltraShort Euro EUO 0.95 896.8 5.65 -11.67 8.61 -12.04 - - - - - -<br />
ProShares UltraShort S&P 500 SDS 0.89 2,475.4 -5.15 -14.77 -32.21 -50.58 -34.65 -15.74 - - 36.52 -<br />
Direxion Daily Financial Bear 3x FAZ 1.15 1,207.6 -17.84 -15.81 -51.36 -94.56 - - - - - -<br />
ProShares UltraShort Russell 2000 TWM 0.95 422.8 -6.39 -17.50 -50.14 -60.27 -47.01 - - - 48.44 -<br />
ProShares UltraShort MSCI Europe EPV 0.95 110.5 -1.30 -19.62 -34.66 - - - - - - -<br />
ProShares UltraShort Dow 30 DXD 0.95 349.5 -6.42 -19.66 -29.76 -44.94 -32.60 -16.89 - - 34.51 -<br />
ProShares UltraShort 7-10 Yr Treasury PST 0.95 397.2 -11.67 -23.83 -21.51 2.41 -22.16 - - - 16.96 -<br />
ProShares Short 20+ Yr Treasury TBF 0.95 781.7 -18.17 -24.90 -12.39 - - - - - - -<br />
ProShares UltraShort QQQ QID 0.95 671.3 -9.65 -24.99 -38.90 -66.80 -45.87 -27.96 - - 36.84 -<br />
ProShares UltraPro Short S&P 500 SPXU 0.95 533.9 -11.85 -26.02 -46.51 - - - - - - -<br />
ProShares UltraShort Oil/Gas DUG 0.95 110.5 0.85 -26.67 -41.26 -49.12 -43.33 - - - 45.86 -<br />
Direxion Daily Large Cap Bear 3x BGZ 1.02 198.7 -11.66 -26.73 -48.74 -70.71 - - - - - -<br />
ProShares UltraShort Real Estate SRS 0.95 164.6 -8.79 -29.11 -51.63 -85.21 -71.10 - - - 63.35 -<br />
Direxion Daily Small Cap Bear 3x TZA 1.15 925.8 -18.62 -34.59 -68.34 -79.41 - - - - - -<br />
ProShares UltraPro Short QQQ SQQQ 0.95 112.4 -17.92 -39.03 - - - - - - - -<br />
ProShares UltraShort Gold GLL 0.95 142.5 -17.48 -39.39 -46.28 -45.81 - - - - - -<br />
Direxion Daily Energy Bear 3x ERY 1.18 110.2 -6.36 -42.57 -60.02 -69.54 - - - - - -<br />
ProShares UltraShort 20+ Yr Treasury TBT 0.93 3,630.6 -34.41 -44.30 -25.74 32.20 -31.57 - - - 37.39 -<br />
VelocityShares Daily Inv VIX Sh-Trm ETN XIV 1.35 362.8 -58.95 -45.12 - - - - - - - -<br />
Direxion Daily 30-Yr Treasury Bear 3x TMV 1.14 291.7 -49.74 -61.37 -36.69 - - - - - - -<br />
ProShares UltraShort Silver ZSL 0.95 294.6 -14.23 -70.54 -79.50 -72.97 - - - - - -<br />
Active Bear HDGE 1.85 116.0 4.56 - - - - - - - - -<br />
Yield<br />
READ IT IN<br />
FIRST<br />
Data as of 10/31/2011. Source: Morningstar. Exp Ratio is annual expense ratio. <strong>Asset</strong>s are net assets in $<strong>US</strong> millions. 3-Mo is 3-month <strong>to</strong>tal return. YTD is year-<strong>to</strong>-date. 3- <strong>and</strong> 5-year<br />
returns are annualized. Mkt Cap is geometric average market capitalization. P/E is price-<strong>to</strong>-earnings ratio. Std Dev is 3-year st<strong>and</strong>ard deviation. Yield is 12-month. Includes all<br />
U.S.-listed <strong>ETFs</strong> <strong>and</strong> ETNs with assets over $100 million.<br />
22 ETFR • December 2011


