Langmuir monolayers of C17, C19, and C21 fatty acids ... - UNAM
Langmuir monolayers of C17, C19, and C21 fatty acids ... - UNAM
Langmuir monolayers of C17, C19, and C21 fatty acids ... - UNAM

You also want an ePaper? Increase the reach of your titles
YUMPU automatically turns print PDFs into web optimized ePapers that Google loves.
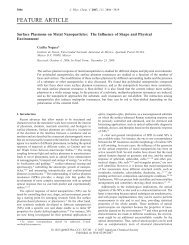
7024 J. Chem. Phys., Vol. 110, No. 14, 8 April 1999 S. Ramos <strong>and</strong> R. Castillo<br />
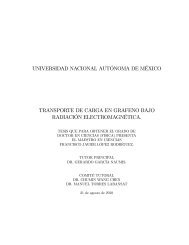
FIG. 3. Surface pressure-temperature phase diagram for C 21 <strong>fatty</strong> acid<br />
monolayer. The phase changes were obtained from our a isotherms ()<br />
<strong>and</strong> BAM observations (). Here, we included the a isotherms data<br />
from Lin et al. 14 ().<br />
gray corresponds to a different azimuthal tilt direction. At<br />
low pressure, in L 2 , the contrast is quite large <strong>and</strong> the mosaic<br />
pattern is outst<strong>and</strong>ing. As temperature is lowered the<br />
contrast decreases. Also, at low temperatures, the number <strong>of</strong><br />
mountain-shaped structures <strong>and</strong> Newton rings increase.<br />
These structures are multilayers defects, since it is not possible<br />
to focus them, <strong>and</strong> they do not change rotating the<br />
polarizer. The number <strong>and</strong> occurrence <strong>of</strong> these mountainshaped<br />
structures or Newton rings depend on how the monolayer<br />
is compressed. We will come back to this issue in more<br />
detail below. The untilted phases S <strong>and</strong> CS also present a<br />
mosaic <strong>of</strong> textures, but with a very low contrast between<br />
their domains. Here, each shade <strong>of</strong> gray corresponds to a<br />
different lattice orientation <strong>of</strong> the all-trans alkane chains<br />
herringbone order. LS is a phase where the contrast is completely<br />
lost in BAM images. This is consistent with the untilted<br />
hexagonal lattice symmetry <strong>of</strong> this phase. Here, the<br />
molecules could be rotating freely rotator structure. 19,20<br />
B. Phase transitions<br />
We have followed here, the method for grouping monolayer<br />
phase transitions used by Rivière et al. 18 Therefore, our<br />
phase transition observations were grouped into four categories<br />
described below. Some phase transitions will be illustrated<br />
with BAM images. In all the images, we have a few<br />
multilayer defects in the field <strong>of</strong> view like Newton rings or<br />
mountain-shaped structures, which do not disappear during<br />
the phase transition under discussion. These defects help us<br />
to assure that we are making observations in the same area <strong>of</strong><br />
the monolayer, before <strong>and</strong> after the phase transition.<br />
1. Transitions between an anisotropic <strong>and</strong> an<br />
isotropic phase „L 2 – LS, L 2 –LS, Ov–LS, <strong>and</strong><br />
S – LS…<br />
L 2 –LS <strong>and</strong> Ov – LS transitions are visible as a lost <strong>of</strong><br />
contrast when they are observed with the BAM, due to the<br />
lack <strong>of</strong> tilting in the hexatic LS phase. This lost <strong>of</strong> contrast<br />
corresponds to a big kink in the isotherm. These transitions<br />
are reversible <strong>and</strong> the mosaic pattern <strong>of</strong> the tilted phases are<br />
recovered on decompressing the monolayer, despite the domain<br />
boundaries in the LS phase have disappeared. The lost<br />
<strong>of</strong> contrast is gradual, but rapid in both transitions. This is<br />
consistent with a continuous decrease in the anisotropy <strong>of</strong> the<br />
monolayer. Figure 4 shows a compression–expansion cycle<br />
along the transition Ov – LS, for C 17 . The defects shown in<br />
Fig. 4 for this monolayer do not change during the transition.<br />
Thus, in the field <strong>of</strong> view confined by those defects, we can<br />
easily see domains <strong>of</strong> the Ov phase with different shades <strong>of</strong><br />
gray, at a pressure slightly below the transition pressure.<br />
These domains disappear when the transition Ov – LS is<br />
reached <strong>and</strong> they reappear when the pressure drops again.<br />
In C 17 or C 21 , it is not so easy to see domains growing in<br />
the L 2 – LS phase transition, as in the case <strong>of</strong> C 19 .InC 19 ,it<br />
is easy to see the how domains <strong>of</strong> the new phases (L 2 or Ov)<br />
grow when the monolayer is relaxing from above the coexistence<br />
line. i.e., when pressure drops <strong>and</strong> the monolayer<br />
reaches the coexistence line slowly. Figure 5 shows the lost<br />
<strong>of</strong> domains form L 2 phase when the pressure is increased <strong>and</strong><br />
the L 2 – LS transition is reached.<br />
We classify L 2 – LS <strong>and</strong> Ov – LS transitions as first order.<br />
Because, when the monolayer is relaxing from slightly<br />
above the transition line, it is possible to see domains <strong>of</strong> the<br />
new tilted phases growing steadily. Also, there is hysteresis<br />
in the pressure <strong>of</strong> the phase change.<br />
In C 21 <strong>and</strong> C 19 , the L 2 – LS phase transition is seen in<br />
the BAM as a sudden loss <strong>of</strong> contrast. This transition also<br />
corresponds to a big kink in the isotherm. The images are<br />
quite similar to the case <strong>of</strong> L 2 – LS or Ov – LS, therefore, a<br />
specific observation <strong>of</strong> this transition is not presented. It is<br />
usual to observe in the L 2 – LS phase transition, the shortening<br />
<strong>of</strong> the L 2 domains during the compression. Nevertheless,<br />
the growing <strong>of</strong> domains is more clearly seen when the monolayer<br />
is relaxing from the LS phase. We classify this transition<br />
as first-order transition.<br />
2. Transitions between a highly anisotropic tilted<br />
phase <strong>and</strong> a weakly anisotropic untilted<br />
phase „L 2 – CS, L 2 –CS, <strong>and</strong> L 2 – S…<br />
In these phase transitions, the decrease in the level <strong>of</strong><br />
contrast among domains is a common feature. However, the<br />
weak anisotropy in S <strong>and</strong> CS phases is visible to the BAM<br />
yet. In C 21 , the L 2 – CS transition can be seen in the BAM as<br />
a rapid growing <strong>of</strong> irregular domains many <strong>of</strong> them elongated<br />
<strong>and</strong> some with a needle shape see Figs. 6a <strong>and</strong> 6b.<br />
Isotherms show this transition with a big kink. Relaxing the<br />
monolayer from the CS phase allows us to see how the<br />
needle-shaped structures start to grow up to irregular domains,<br />
when the border <strong>of</strong> the L 2 is reached. These needle-<br />
Downloaded 26 Feb 2003 to 132.248.7.15. Redistribution subject to AIP license or copyright, see http://ojps.aip.org/jcpo/jcpcr.jsp