Langmuir monolayers of C17, C19, and C21 fatty acids ... - UNAM
Langmuir monolayers of C17, C19, and C21 fatty acids ... - UNAM
Langmuir monolayers of C17, C19, and C21 fatty acids ... - UNAM

Create successful ePaper yourself
Turn your PDF publications into a flip-book with our unique Google optimized e-Paper software.
JOURNAL OF CHEMICAL PHYSICS VOLUME 110, NUMBER 14 8 APRIL 1999<br />
<strong>Langmuir</strong> <strong>monolayers</strong> <strong>of</strong> C 17 ,C 19 , <strong>and</strong> C 21 <strong>fatty</strong> <strong>acids</strong>: Textures, phase<br />
transitions, <strong>and</strong> localized oscillations<br />
Salvador Ramos <strong>and</strong> Rol<strong>and</strong>o Castillo a)<br />
Instituto de Fisica, <strong>UNAM</strong>, P.O. Box 20-364, D.F. 01000, Mexico<br />
Received 19 October 1998; accepted 14 January 1999<br />
The phase diagrams <strong>of</strong> <strong>Langmuir</strong> <strong>monolayers</strong> <strong>of</strong> heptadecanoic (C 17 ), nonadecanoic (C 19 ), <strong>and</strong><br />
heneicosanoic (C 21 ) <strong>acids</strong> have been determined from pressure-area isotherms, <strong>and</strong> from direct<br />
observations <strong>of</strong> the <strong>monolayers</strong> using Brewster angle microscopy. In this paper, we describe the<br />
observed domains, textures <strong>and</strong> phase boundaries for all mesophases presented by these <strong>fatty</strong> <strong>acids</strong><br />
between 2° <strong>and</strong> 45 °C. The phase diagrams <strong>of</strong> the three <strong>fatty</strong> <strong>acids</strong> can be superposed moving the<br />
temperature scale according to the number <strong>of</strong> carbons in the tail <strong>of</strong> the <strong>fatty</strong> <strong>acids</strong>. The L 2 /Ov phase<br />
transition, which is not detected through isotherms, was observed in all the <strong>fatty</strong> <strong>acids</strong> under study.<br />
At low temperatures, CS,L 2 , <strong>and</strong> L 2 phases <strong>of</strong> C 21 were observed, as well as, the transitions among<br />
them. Also, we observed in C 21 a new phase located among the phases L 2 ,L 2 , <strong>and</strong> L 2 . This phase<br />
was found recently, in the relative same place, in the <strong>fatty</strong> acid C 20 with a tilting azimuth between<br />
the nearest-neighbor <strong>and</strong> the next nearest-neighbor directions. In the crystalline phases <strong>of</strong> the<br />
monolayer <strong>of</strong> C 21 , L 2 <strong>and</strong> CS, we observed localized oscillations. These localized oscillations can<br />
be observed by long periods <strong>of</strong> time. The number <strong>of</strong> localized oscillations in the monolayer can be<br />
modified by long periods <strong>of</strong> relaxation or by heat treatment. Our results seem to indicate that these<br />
localized oscillations are areas with high density <strong>of</strong> defects, expelling material out <strong>of</strong> the monolayer.<br />
Therefore, they could be important in the events previous to the collapse. © 1999 American<br />
Institute <strong>of</strong> Physics. S0021-96069971714-9<br />
I. INTRODUCTION<br />
tional order; b bond or lattice orientational order; c tilt<br />
order, which is the order <strong>of</strong> the molecular tilt azimuth with<br />
respect to the local orientational order; d herringbone order<br />
or broken axial symmetry, which is the staggered ordering <strong>of</strong><br />
the planes <strong>of</strong> all-trans hydrocarbon chains. For these order<br />
parameters a distinction has been made between quasi-longrange<br />
order, in which the order decays accordingly to a<br />
power law, <strong>and</strong> short-range order where the order falls <strong>of</strong>f<br />
exponentially with distance.<br />
Among the experimental techniques mentioned above,<br />
Brewster angle microscopy 3,4 probably is the best suited to<br />
be used in direct observations during compression <strong>of</strong> <strong>monolayers</strong>,<br />
in a <strong>Langmuir</strong> trough. This is a technique based on<br />
the study <strong>of</strong> the reflected light coming from an interface illuminated<br />
at the Brewster angle, by a laser beam polarized in<br />
the plane <strong>of</strong> incidence (p). When the angle <strong>of</strong> incidence <strong>of</strong><br />
the laser beam is the Brewster angle, there is no light reflected,<br />
from a clean <strong>and</strong> perfect interface, i.e., the refractive<br />
index changes abruptly form one medium to another. For a<br />
real interface which has a transition region where the refractive<br />
index changes smoothly form one value to another, the<br />
reflected intensity at the Brewster angle is a minimum, but it<br />
does not vanish completely. The reflected intensity depends<br />
strongly on the interfacial characteristics, such as, molecular<br />
density <strong>and</strong> molecular anisotropy. These properties are particularly<br />
modified when a monolayer is located at the interface.<br />
Thus, a monolayer on an interface is able to produce<br />
reflection <strong>of</strong> light. In tilted phases, the anisotropy is sufficiently<br />
strong to have enough light reflection to make quite<br />
visible the mosaic <strong>of</strong> textures due to tilted domains. In una<br />
Electronic mail: rol<strong>and</strong>oc@fenix.ifisicacu.unam.mx<br />
Phase diagrams <strong>of</strong> <strong>Langmuir</strong> <strong>monolayers</strong> <strong>of</strong> <strong>fatty</strong> <strong>acids</strong><br />
on the surface <strong>of</strong> water have been studied intensively for<br />
decades. Nevertheless, significative advances have been obtained<br />
only in the last years due to new experimental techniques.<br />
X-ray diffraction XRD, using intense <strong>and</strong> highly<br />
collimated x-rays available from synchrotron, gives the most<br />
explicit information about the monolayer organization. 1 Nevertheless,<br />
this kind <strong>of</strong> experiment is time consuming <strong>and</strong> expensive<br />
to obtain an entire phase diagram. Other powerful<br />
techniques have been developed to study monolayer organization,<br />
such as, polarized fluorescence microscopy PFM 2<br />
<strong>and</strong> Brewster angle microscopy. 3,4 These techniques complement<br />
the information given by XRD experiments, since they<br />
survey larger scales (1 m providing information about<br />
homogeneity, textures, structure, <strong>and</strong> dynamics <strong>of</strong> <strong>monolayers</strong>.<br />
These optical techniques are quite sensible for observing<br />
very fine details in phase transformations such as molecular<br />
tilting. All these new experimental techniques have revealed<br />
that singularities in the surface pressure-area isotherms, observed<br />
since the time <strong>of</strong> Stenhagen 5 <strong>and</strong> Lundquist, 6,7 are due<br />
to phase changes. Each phase has a different molecular organization.<br />
Bibo, Knobler, <strong>and</strong> Peterson 8 have shown that<br />
molecular organization <strong>of</strong> condensed phases in <strong>fatty</strong> acid<br />
<strong>monolayers</strong> can be seen as a direct analog <strong>of</strong> some specific<br />
smectic phases. Thus, each phase can be described in term <strong>of</strong><br />
four order parameters. These parameters are: 11,12 a posi-<br />
0021-9606/99/110(14)/7021/10/$15.00 7021<br />
© 1999 American Institute <strong>of</strong> Physics<br />
Downloaded 26 Feb 2003 to 132.248.7.15. Redistribution subject to AIP license or copyright, see http://ojps.aip.org/jcpo/jcpcr.jsp
7022 J. Chem. Phys., Vol. 110, No. 14, 8 April 1999 S. Ramos <strong>and</strong> R. Castillo<br />
tilted phases with rectangular lattice symmetry, textures are<br />
also visible, but with much less contrast. This is probably<br />
due to the anisotropy <strong>of</strong> the unit cell herringbone alignment.<br />
Phase transitions are visible either as a dramatic<br />
change in the degree <strong>of</strong> contrast or as a sudden alteration <strong>of</strong><br />
the mosaic <strong>of</strong> textures <strong>and</strong> domain borders. Many <strong>of</strong> the<br />
textures <strong>and</strong> domain morphologies found in <strong>monolayers</strong> using<br />
the Brewster angle microscope BAM, have been explained<br />
using model calculations <strong>of</strong> <strong>monolayers</strong> with tilted<br />
molecules. 9,10,26<br />
The work <strong>of</strong> many different groups has contributed to<br />
obtain a general picture <strong>of</strong> the phase diagram <strong>of</strong> <strong>fatty</strong> acid<br />
<strong>monolayers</strong>, as well as, the structure <strong>of</strong> their phases using<br />
XRD, PFM, <strong>and</strong> Brewster angle microscopy. This picture<br />
can be reviewed as follows: At very low surface densities,<br />
when the average area per molecule, a, is much larger than<br />
the cross section area <strong>of</strong> an isolated molecule, an amphiphilic<br />
monolayer behaves as a two dimensional gas. Here, a molecule<br />
in a monolayer is still free to show all the conformational<br />
entropic contribution without any interference from<br />
neighbors. A first-order phase transition from the gas phase<br />
to a liquid-exp<strong>and</strong>ed LE phase is observed upon compression<br />
<strong>of</strong> the monolayer. LE phase is isotropic <strong>and</strong> molecules<br />
are tilted. The gas-phase side <strong>of</strong> the transition is <strong>of</strong> the order<br />
<strong>of</strong> a300– 1500 Å 2 /molec, whereas on the LE side a is <strong>of</strong><br />
the order <strong>of</strong> the cross section area <strong>of</strong> an isolated chain<br />
(30– 40 Å 2 /molec. A second phase transition to a liquid<br />
condensed LC state is observed upon further compression<br />
<strong>of</strong> the monolayer; a is <strong>of</strong> the order <strong>of</strong> 22– 25 Å 2 /molec. Here,<br />
a is just barely larger than the cross sectional area <strong>of</strong> a fully<br />
stretched all-trans chain. Actually, condensed phase is<br />
made up <strong>of</strong> a variety <strong>of</strong> mesophases, i.e., phases where the<br />
translational order <strong>of</strong> the molecules is short ranged <strong>and</strong> the<br />
orientational order <strong>of</strong> the bonds between the molecules is<br />
long range. At low surface pressures, there are several<br />
phases showing molecular tilt with distinct symmetry. L 2<br />
phase has a collective tilt towards a nearest neighbor<br />
NN. 14,16,20–22,24,30 L 2 <strong>and</strong> Ov phases tilt to a next-nearest<br />
neighbor NNN molecule. 14,16,20,22,24,30 The L 2 /Ov transition<br />
is quite peculiar, since it was found through BAM observations<br />
only, 17 since it cannot be detected with surface<br />
pressure-area isotherms, due to the lack <strong>of</strong> an area/molecule<br />
change during the transition. 16 At high pressure, there are<br />
two untilted phases, the super liquid phase, LS, 19–21,25 <strong>and</strong><br />
the solid phase, S. 14,19,20,23 Structure <strong>of</strong> mesophases can be<br />
locally hexagonal LS or distorted hexagonal, i.e., centered<br />
rectangular (L 2 , L 2 , Ov, S). In addition to mesophases,<br />
crystalline phases have been found with a positional quasilong-range<br />
order. They show positional correlations larger<br />
than 500 Å. They are CS <strong>and</strong> L 2 phases, both are centered<br />
rectangular with herringbone order. L 2 is at two-dimensional<br />
crystal with a NN-tilt 14 <strong>and</strong> CS is untilted. 14,22–25 At very<br />
high pressures, all phases collapse in multilayers. The details<br />
<strong>of</strong> the multilayering process are quite unknown. Textures <strong>of</strong><br />
condensed phases <strong>and</strong> the precise coexistence lines between<br />
phases have been obtained mainly using PFM <strong>and</strong> Brewster<br />
angle microscopy. This is the case for L 2 /L 2 <strong>and</strong> L 2 /CS<br />
transitions, 15 for L 2 /L 2 / L 2 transitions, 27 <strong>and</strong> many more presented<br />
with detail by Rivière et al. 18<br />
Tilt to an intermediate direction breaks the chiral symmetry<br />
<strong>of</strong> a monolayer. The breaking <strong>of</strong> inversion symmetry<br />
allows nonchiral molecules to arrange in chiral structures.<br />
Phases in which molecular tilt is intermediate between NN<br />
<strong>and</strong> NNN directions have been observed. Durbin et al., 13<br />
have found a intermediate phase I for a monolayer <strong>of</strong><br />
eicosanoic acid (C 20 ) using surface pressure-area isotherms<br />
<strong>and</strong> x-ray diffraction. These authors also found that the transition<br />
from I phase to an NN-tilted structure is first order,<br />
with a 60° change in the tilt direction, whereas, the transition<br />
to an NNN-tilted structure is apparently continuous.<br />
In this paper, we will present a detailed study to obtain<br />
all the boundaries in the phase diagrams <strong>of</strong> three <strong>fatty</strong> <strong>acids</strong>:<br />
Heneicosanoic (C 21 ), nonadecanoic (C 19 ), heptadecanoic<br />
(C 17 ), in the temperature range <strong>of</strong> 2 – 45 °C. A partial phase<br />
diagram <strong>of</strong> C 21 has been presented by Fischer et al. 29 Also<br />
for C 21 , Teer et al. 28 have presented a whole phase diagram,<br />
which has been obtained by shifting the temperature axis<br />
(6 °C per methylene group from other phase diagrams previously<br />
reported. 18 Our phase diagrams were determined using<br />
surface pressure-area isotherms <strong>and</strong> BAM observations.<br />
Therefore, in this paper, we will show the mosaic <strong>of</strong> texture<br />
<strong>of</strong> the phases as observed with the BAM, as well as, the<br />
phase transitions between those phases. Fatty <strong>acids</strong> with an<br />
odd carbon tail have been less studied than the case <strong>of</strong> even<br />
carbon tail <strong>acids</strong>. For the case <strong>of</strong> C 17 , we present the change<br />
<strong>of</strong> textures during the phase transformations: L 2 – Ov,<br />
Ov – LS, <strong>and</strong> L 2 – LS. As far as we know, they are not previously<br />
reported. The same phase changes are presented for<br />
C 19 , although we included the L 2 – L 2 , L 2 – LS, <strong>and</strong> L 2 – S<br />
transitions. C 21 is the richest phase diagram, since in addition<br />
to the mentioned phase transitions, we observed the L 2 – L 2<br />
<br />
<strong>and</strong> the L 2 – CS transformations at low temperatures. Also,<br />
we will report here a new intermediate phase for C 21 , which<br />
has been reported quite recently for the case <strong>of</strong> C 20 . 13 In<br />
addition, we will present an outst<strong>and</strong>ing observation made<br />
with the BAM in C 21 , which has not been reported before, as<br />
far as we know. We observed localized oscillations in the<br />
monolayer, in the crystalline phases L 2 <strong>and</strong> CS. Localized<br />
oscillations are related to energy <strong>and</strong> stress concentration in<br />
some relative large areas with high concentration <strong>of</strong> defects<br />
in the monolayer. They could be important in the events<br />
previous to the collapse.<br />
II. EXPERIMENT<br />
C 17 97%, C 19 99%, <strong>and</strong> C 21 99% were purchased<br />
from Aldrich U.S.A., <strong>and</strong> they were used without any further<br />
purification. With the aid <strong>of</strong> an spreading solution, <strong>fatty</strong><br />
<strong>acids</strong> were spread onto a subphase <strong>of</strong> ultrapure water<br />
Nanopure-UV at pH2. The spreading solution was made<br />
with chlor<strong>of</strong>orm Aldrich U.S.A., HPLC. HCl Merck,<br />
Mexico was used to modify pH.<br />
All <strong>monolayers</strong> were prepared on a computerized Nima<br />
<strong>Langmuir</strong>–Blodgett trough TKB 2410A, Nima Technology<br />
Ltd., Engl<strong>and</strong> using a Wilhelmy plate to measure the surface<br />
pressure 0 , i.e., the surface tension difference <strong>of</strong> the<br />
Downloaded 26 Feb 2003 to 132.248.7.15. Redistribution subject to AIP license or copyright, see http://ojps.aip.org/jcpo/jcpcr.jsp
J. Chem. Phys., Vol. 110, No. 14, 8 April 1999 S. Ramos <strong>and</strong> R. Castillo<br />
7023<br />
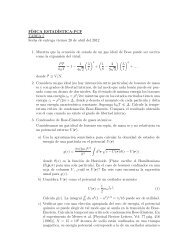
FIG. 1. Surface pressure-temperature phase diagram for C 17 <strong>fatty</strong> acid<br />
monolayer. The phase changes were obtained from our a isotherms ()<br />
<strong>and</strong> BAM observations ().<br />
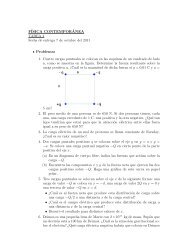
FIG. 2. Surface pressure-temperature phase diagram for C 19 <strong>fatty</strong> acid<br />
monolayer. The phase changes were obtained from our a isotherms ()<br />
<strong>and</strong> BAM observations ().<br />
clean subphase <strong>and</strong> that <strong>of</strong> the amphiphile covered subphase.<br />
The trough is isolated from vibrations using a pneumatic<br />
tube incorporated into a steel base. The barriers are made <strong>of</strong><br />
polytetrafluoroethylene PTFE fitted with stiffening bars defining<br />
a working circular area starting at 1000 cm 2 . All experiments<br />
were carried out in a dust-free environment. The<br />
speed <strong>of</strong> compression was in the range <strong>of</strong> 1–5 Å 2 /molec.min.<br />
The BAM observations were performed using a BAM1<br />
Nan<strong>of</strong>ilm Technologie GmbH, Germany with a spatial<br />
resolution <strong>of</strong> 4 m. The BAM analyzer gave the best contrast<br />
while kept at 0 ° or180 °.<br />
The Nima LB trough <strong>and</strong> the BAM were placed on a<br />
concrete table cemented to the ground floor <strong>of</strong> our building.<br />
Temperature in the trough was kept constant with the aid <strong>of</strong><br />
a water circulator bath Cole-Parmer 1268-24, U.S.A..<br />
III. RESULTS AND DISCUSSION<br />
A. General features<br />
Figures 1–3 show the different phases found for C 17 ,<br />
C 19 , <strong>and</strong> C 21 , in the range <strong>of</strong> temperatures worked in this<br />
study (2 – 45 °C. The coexistence lines were obtained from<br />
the temperatures <strong>and</strong> the pressures, where phase changes do<br />
occur. The phase changes were determined from our a<br />
isotherms <strong>and</strong> from BAM observations. The three phase diagrams<br />
are displaced in some regular fashion. They follow the<br />
known rule that the addition <strong>of</strong> one CH 2 group to the tail <strong>of</strong><br />
a <strong>fatty</strong> acid, displaces the phase boundaries to higher temperatures<br />
by a value in the range <strong>of</strong> 5 – 8 °C.<br />
We identified the phases for the three <strong>fatty</strong> <strong>acids</strong> studied<br />
here, with the aid <strong>of</strong> the information given for the even carbon<br />
tail <strong>acids</strong> mentioned in the Introduction. The C 17 monolayer<br />
Fig. 1 presents three phases in the worked temperature<br />
range: L 2 , LS, <strong>and</strong> the relative new Ov phase. For<br />
surface pressures above 35– 45 mN/m the monolayer is collapsed.<br />
The C 19 monolayer Fig. 2 presents five phases in<br />
the worked temperature range: L 2 , L 2 , Ov, S, <strong>and</strong> LS. The<br />
monolayer collapses for surface pressures above 45 mN/m,<br />
at low temperatures. The collapse occurs at pressures <strong>of</strong> the<br />
order <strong>of</strong> 70 mN/m for temperatures in the range <strong>of</strong><br />
10– 25 °C. At higher temperature, the collapse pressure falls<br />
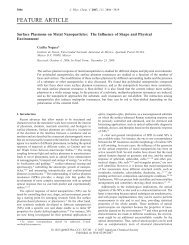
down as temperature is increased. As expected, the C 21<br />
monolayer Fig. 3 presents the richest phase diagram, because<br />
high-density phases can be observed. The phases presented<br />
in Fig. 3 are: L 2 , L 2 , L 2 , Ov, CS, S, <strong>and</strong> LS. Here,<br />
we also included the a isotherm data <strong>of</strong> Lin et al. 14 In<br />
this phase diagram, we also show a phase I, where the<br />
boundary with L 2 was obtained with isotherms <strong>and</strong> the<br />
boundary with the L 2 was determined with BAM observations.<br />
In the same relative place <strong>of</strong> the phase diagram, recently,<br />
Durbin et al. 13 have reported a similar phase for C 20<br />
<strong>fatty</strong> acid using XRD. The molecular tilt <strong>of</strong> this new phase is<br />
intermediate between NN <strong>and</strong> NNN directions. They named<br />
this phase as I phase, so we did the same for C 21 . The C 21<br />
monolayer presents the collapse when reaches values <strong>of</strong><br />
the order <strong>of</strong> 60 mN/m.<br />
In BAM images, all tilted phases L 2 , Ov, L 2 , <strong>and</strong> L<br />
2<br />
show the same general pattern: A mosaic <strong>of</strong> irregularly<br />
shaped domains. The contrast between domains comes from<br />
the different tilting <strong>of</strong> the all-trans hydrocarbon tails. This<br />
contrast is relatively strong in tilted phases. Each shade <strong>of</strong><br />
Downloaded 26 Feb 2003 to 132.248.7.15. Redistribution subject to AIP license or copyright, see http://ojps.aip.org/jcpo/jcpcr.jsp
7024 J. Chem. Phys., Vol. 110, No. 14, 8 April 1999 S. Ramos <strong>and</strong> R. Castillo<br />
FIG. 3. Surface pressure-temperature phase diagram for C 21 <strong>fatty</strong> acid<br />
monolayer. The phase changes were obtained from our a isotherms ()<br />
<strong>and</strong> BAM observations (). Here, we included the a isotherms data<br />
from Lin et al. 14 ().<br />
gray corresponds to a different azimuthal tilt direction. At<br />
low pressure, in L 2 , the contrast is quite large <strong>and</strong> the mosaic<br />
pattern is outst<strong>and</strong>ing. As temperature is lowered the<br />
contrast decreases. Also, at low temperatures, the number <strong>of</strong><br />
mountain-shaped structures <strong>and</strong> Newton rings increase.<br />
These structures are multilayers defects, since it is not possible<br />
to focus them, <strong>and</strong> they do not change rotating the<br />
polarizer. The number <strong>and</strong> occurrence <strong>of</strong> these mountainshaped<br />
structures or Newton rings depend on how the monolayer<br />
is compressed. We will come back to this issue in more<br />
detail below. The untilted phases S <strong>and</strong> CS also present a<br />
mosaic <strong>of</strong> textures, but with a very low contrast between<br />
their domains. Here, each shade <strong>of</strong> gray corresponds to a<br />
different lattice orientation <strong>of</strong> the all-trans alkane chains<br />
herringbone order. LS is a phase where the contrast is completely<br />
lost in BAM images. This is consistent with the untilted<br />
hexagonal lattice symmetry <strong>of</strong> this phase. Here, the<br />
molecules could be rotating freely rotator structure. 19,20<br />
B. Phase transitions<br />
We have followed here, the method for grouping monolayer<br />
phase transitions used by Rivière et al. 18 Therefore, our<br />
phase transition observations were grouped into four categories<br />
described below. Some phase transitions will be illustrated<br />
with BAM images. In all the images, we have a few<br />
multilayer defects in the field <strong>of</strong> view like Newton rings or<br />
mountain-shaped structures, which do not disappear during<br />
the phase transition under discussion. These defects help us<br />
to assure that we are making observations in the same area <strong>of</strong><br />
the monolayer, before <strong>and</strong> after the phase transition.<br />
1. Transitions between an anisotropic <strong>and</strong> an<br />
isotropic phase „L 2 – LS, L 2 –LS, Ov–LS, <strong>and</strong><br />
S – LS…<br />
L 2 –LS <strong>and</strong> Ov – LS transitions are visible as a lost <strong>of</strong><br />
contrast when they are observed with the BAM, due to the<br />
lack <strong>of</strong> tilting in the hexatic LS phase. This lost <strong>of</strong> contrast<br />
corresponds to a big kink in the isotherm. These transitions<br />
are reversible <strong>and</strong> the mosaic pattern <strong>of</strong> the tilted phases are<br />
recovered on decompressing the monolayer, despite the domain<br />
boundaries in the LS phase have disappeared. The lost<br />
<strong>of</strong> contrast is gradual, but rapid in both transitions. This is<br />
consistent with a continuous decrease in the anisotropy <strong>of</strong> the<br />
monolayer. Figure 4 shows a compression–expansion cycle<br />
along the transition Ov – LS, for C 17 . The defects shown in<br />
Fig. 4 for this monolayer do not change during the transition.<br />
Thus, in the field <strong>of</strong> view confined by those defects, we can<br />
easily see domains <strong>of</strong> the Ov phase with different shades <strong>of</strong><br />
gray, at a pressure slightly below the transition pressure.<br />
These domains disappear when the transition Ov – LS is<br />
reached <strong>and</strong> they reappear when the pressure drops again.<br />
In C 17 or C 21 , it is not so easy to see domains growing in<br />
the L 2 – LS phase transition, as in the case <strong>of</strong> C 19 .InC 19 ,it<br />
is easy to see the how domains <strong>of</strong> the new phases (L 2 or Ov)<br />
grow when the monolayer is relaxing from above the coexistence<br />
line. i.e., when pressure drops <strong>and</strong> the monolayer<br />
reaches the coexistence line slowly. Figure 5 shows the lost<br />
<strong>of</strong> domains form L 2 phase when the pressure is increased <strong>and</strong><br />
the L 2 – LS transition is reached.<br />
We classify L 2 – LS <strong>and</strong> Ov – LS transitions as first order.<br />
Because, when the monolayer is relaxing from slightly<br />
above the transition line, it is possible to see domains <strong>of</strong> the<br />
new tilted phases growing steadily. Also, there is hysteresis<br />
in the pressure <strong>of</strong> the phase change.<br />
In C 21 <strong>and</strong> C 19 , the L 2 – LS phase transition is seen in<br />
the BAM as a sudden loss <strong>of</strong> contrast. This transition also<br />
corresponds to a big kink in the isotherm. The images are<br />
quite similar to the case <strong>of</strong> L 2 – LS or Ov – LS, therefore, a<br />
specific observation <strong>of</strong> this transition is not presented. It is<br />
usual to observe in the L 2 – LS phase transition, the shortening<br />
<strong>of</strong> the L 2 domains during the compression. Nevertheless,<br />
the growing <strong>of</strong> domains is more clearly seen when the monolayer<br />
is relaxing from the LS phase. We classify this transition<br />
as first-order transition.<br />
2. Transitions between a highly anisotropic tilted<br />
phase <strong>and</strong> a weakly anisotropic untilted<br />
phase „L 2 – CS, L 2 –CS, <strong>and</strong> L 2 – S…<br />
In these phase transitions, the decrease in the level <strong>of</strong><br />
contrast among domains is a common feature. However, the<br />
weak anisotropy in S <strong>and</strong> CS phases is visible to the BAM<br />
yet. In C 21 , the L 2 – CS transition can be seen in the BAM as<br />
a rapid growing <strong>of</strong> irregular domains many <strong>of</strong> them elongated<br />
<strong>and</strong> some with a needle shape see Figs. 6a <strong>and</strong> 6b.<br />
Isotherms show this transition with a big kink. Relaxing the<br />
monolayer from the CS phase allows us to see how the<br />
needle-shaped structures start to grow up to irregular domains,<br />
when the border <strong>of</strong> the L 2 is reached. These needle-<br />
Downloaded 26 Feb 2003 to 132.248.7.15. Redistribution subject to AIP license or copyright, see http://ojps.aip.org/jcpo/jcpcr.jsp
J. Chem. Phys., Vol. 110, No. 14, 8 April 1999 S. Ramos <strong>and</strong> R. Castillo<br />
7025<br />
FIG. 5. Phases observed with the BAM in a compression starting slightly<br />
below the L 2 – LS phase transition (T15.2 °C <strong>and</strong> 29.9 mN/m. L 2<br />
phase, upper panel; LS phase, lower panel.<br />
phases. This boundary is shown in Fig. 2 for C 19 (8.6 °C<br />
<strong>and</strong> in Fig. 3 for C 21 (19.50 °C.<br />
FIG. 4. Phases observed with the BAM in a compression-expansion cycle<br />
starting below the Ov – LS phase transition (T16.0 °C <strong>and</strong> <br />
27.1– 27.3 mN/m. Ov phase, upper panel ; LS phase, medium panel; Ov<br />
phase, lower panel.<br />
shaped structures also appear in the transition L 2 – CS see<br />
Fig. 6c. We classified both transitions as first order.<br />
The L 2 – S transition can be seen as a big kink in the<br />
isotherm <strong>and</strong> as a change in level <strong>of</strong> contrast in the BAM.<br />
This change is not as rapid as in the L 2 – LS transition. Nevertheless,<br />
contrast is not lost completely as in the LS case. It<br />
is possible to see a mosaic pattern with a very low difference<br />
in contrast among domains, as well as, how the contrast is<br />
advancing in the field <strong>of</strong> view along the transition. We classify<br />
this transition as first order. BAM observations made<br />
possible to estimate where the boundary between S <strong>and</strong> LS<br />
phases is, due to the difference in contrast between LS <strong>and</strong> S<br />
3. Transitions between two anisotropic phases with<br />
approximately the same degree <strong>of</strong> anisotropy<br />
„L 2 – L 2 , L 2 – L 2 , L 2 – L 2 , L 2 – Ov, <strong>and</strong> S – CS…<br />
Transition from L 2 to Ov is very clear using the BAM,<br />
whereas, it cannot be noticed with isotherms. In spite <strong>of</strong> the<br />
change from NNN to NN tilting, as mentioned in the introduction,<br />
during the transition the surface area/molecule does<br />
not change. Figure 7 presents an example <strong>of</strong> this transition<br />
for a monolayer <strong>of</strong> C 17 , which is compressed <strong>and</strong> decompressed<br />
on several occasions, around the transition line. The<br />
change <strong>of</strong> domain shapes is evident in these pictures. Most <strong>of</strong><br />
the times, in this kind <strong>of</strong> compression–decompression<br />
cycles, domains reform almost to the same shapes, suggesting<br />
some kind <strong>of</strong> memory. Figures 7a <strong>and</strong> 7c show this<br />
feature. Also there, we can observe how the monolayer<br />
evolves from domains with boundaries with many sharp<br />
kinks (L 2 ) to domains with boundaries with an irregular<br />
shape (Ov). In C 19 , the contrast change is not so clear as in<br />
the case <strong>of</strong> C 17 , but we can see the same features. In C 21 , the<br />
L 2 phase is more fluid than in the other <strong>fatty</strong> <strong>acids</strong>. Thus, it is<br />
more difficult to observe the L 2 – Ov transition. In this case,<br />
it is easy to mistake a phase transition with a rotation <strong>of</strong> the<br />
whole monolayer in the field <strong>of</strong> view <strong>of</strong> the BAM. Domains<br />
Downloaded 26 Feb 2003 to 132.248.7.15. Redistribution subject to AIP license or copyright, see http://ojps.aip.org/jcpo/jcpcr.jsp
7026 J. Chem. Phys., Vol. 110, No. 14, 8 April 1999 S. Ramos <strong>and</strong> R. Castillo<br />
FIG. 6. Phases observed with the BAM close to the L 2 – CS <strong>and</strong> L 2 – CS<br />
phase transitions. L 2 phase as seen just below the transition, upper panel,<br />
<strong>and</strong> CS phase just above the transition, medium panel (T4.9 °C <strong>and</strong> <br />
18.6 mN/m. In the lower panel, we show L 2 phase just starting the<br />
transformation to CS phase (T2.2 °C <strong>and</strong> 19.0 mN/m. Here, there is<br />
a light-gray needle-shaped structure, which suddenly appeared in the lower<br />
left part <strong>of</strong> the field <strong>of</strong> view, in the gray area.<br />
can be seen disappearing steadily from one phase (L 2 ) to the<br />
other (Ov), decompressing the monolayer. All our observations<br />
are consistent with a first-order transition, in agreement<br />
with the observations <strong>of</strong> Rivière et al. In C 21 , one part <strong>of</strong> the<br />
L 2 – Ov boundary must be almost vertical since, it was impossible<br />
for us to catch more experimental points for this<br />
phase transition close to 37 °C. See Fig. 3.<br />
The transition from L 2 – L 2 was observed with the BAM<br />
in C 19 <strong>and</strong> C 21 . This transition is characterized by a change<br />
FIG. 7. Phases observed with the BAM close to the L 2 – Ov phase transition<br />
at T22.8 °C <strong>and</strong> 19.4– 19.7 mN/m. a L 2 phase slightly below<br />
the phase transition; b When L 2 phase is compressed, the Ov phase appears;<br />
c Decompressing the monolayer, L 2 phase is recovered with almost<br />
the same domains.<br />
<strong>of</strong> domain shapes. The contrast between domains is low but<br />
clearly visible, as well as the phase transition. These features<br />
can be seen in Fig. 8. The low level <strong>of</strong> contrast is due to the<br />
same degree <strong>of</strong> anisotropy in both phases. We can see how<br />
rapid domains grow, decompressing the monolayer. We classify<br />
the transition as first order, however, the lack <strong>of</strong> contrast<br />
between domains does not allow to see the growing <strong>of</strong> domains<br />
as clearly as in other cases previously mentioned.<br />
Compressing the L 2 phase <strong>of</strong> C 21 <strong>fatty</strong> acid, at low temperature,<br />
allowed us to reach the outst<strong>and</strong>ing phase transition<br />
Downloaded 26 Feb 2003 to 132.248.7.15. Redistribution subject to AIP license or copyright, see http://ojps.aip.org/jcpo/jcpcr.jsp
J. Chem. Phys., Vol. 110, No. 14, 8 April 1999 S. Ramos <strong>and</strong> R. Castillo<br />
7027<br />
FIG. 9. Front passing along the field <strong>of</strong> view <strong>of</strong> the BAM in the L 2 – L 2<br />
<br />
phase transition at T2.2 °C <strong>and</strong> 5.3 mN/m. a L 2 phase before the<br />
transition; b the front, changing to the new L 2 phase, is visible as bright<br />
irregular domains coming from above; c the front has reached the bottom<br />
<strong>of</strong> the field <strong>of</strong> view.<br />
FIG. 8. Phases observed with the BAM close to the L 2 – L 2 phase transition.<br />
C 19 at T6.4 °C <strong>and</strong> 23.1 mN/m: a L 2 phase <strong>and</strong> b L 2 . C 21 at T<br />
21.0 °C <strong>and</strong> 26.5 mN/m: c L 2 phase <strong>and</strong> d L 2 . In both cases, we<br />
can see the same place in the monolayer, if we use the defects as a guide to<br />
the eye. Defects do not changed during the phase transition.<br />
L 2 – L 2 . Isotherms show this transition as a small kink.<br />
Here, suddenly, an irregular change <strong>of</strong> phase front passes<br />
along the field <strong>of</strong> view <strong>of</strong> the BAM. This front modifies the<br />
mosaic <strong>of</strong> domains. An observation <strong>of</strong> these events is presented<br />
in Fig. 9. The front travels quite rapid, but at a finite<br />
speed in the range <strong>of</strong> 150– 550 m/s. In some cases, previous<br />
to the pass <strong>of</strong> the front, a deformation <strong>of</strong> the domain<br />
pattern is observed. In other cases, it is possible to catch how<br />
the change <strong>of</strong> phase grows up from some regions, like a<br />
growing tree, propagating the change <strong>of</strong> phase front to rest <strong>of</strong><br />
the field <strong>of</strong> view. Decompressing the monolayer, the domain<br />
pattern <strong>of</strong> L 2 changes in a way which recalls a melting process.<br />
We classified this transition as a first-order transition.<br />
In the S – CS phase transition, a mosaic <strong>of</strong> irregular domains<br />
with a very low level <strong>of</strong> contrast among them, changes<br />
Downloaded 26 Feb 2003 to 132.248.7.15. Redistribution subject to AIP license or copyright, see http://ojps.aip.org/jcpo/jcpcr.jsp
7028 J. Chem. Phys., Vol. 110, No. 14, 8 April 1999 S. Ramos <strong>and</strong> R. Castillo<br />
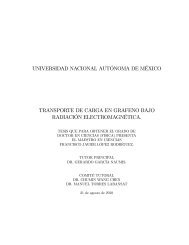
FIG. 10. Several a isotherms <strong>of</strong> the C 21 <strong>fatty</strong> acid temperatures are<br />
indicated in Centigrade scale. They show the main phase transformations<br />
for those temperatures, as well as the location <strong>of</strong> a new phase I. The areaaxis<br />
labels are for the 7.5 °C isotherm; other isotherms are shifted horizontally<br />
proportionally to temperature for clarity.<br />
to another mosaic <strong>of</strong> domains, also with a very low level <strong>of</strong><br />
contrast among domains. However, this transition is quite<br />
clear, <strong>and</strong> BAM images allow to see the needle-shaped domain<br />
characteristics <strong>of</strong> the CS phase. Isotherms show this<br />
transition with a small kink. In the L 2 – L 2 , we also observed<br />
a similar change from a mosaic <strong>of</strong> irregular domains to another<br />
mosaic <strong>of</strong> irregular domains. However, in this case the<br />
change occurs more rapid, <strong>and</strong> the level <strong>of</strong> contrast in L 2 is<br />
lower than in L 2 .<br />
4. Transitions between tilted phases (NN or NNN) to<br />
some intermediate position<br />
As mentioned above, all our observations suggest that<br />
there is a phase I in C 21 , with an intermediate tilt between<br />
NN <strong>and</strong> NNN directions. One phase <strong>of</strong> this kind was observed<br />
in the same relative place in C 20 , by Durbin et al. 13 In<br />
the present work, the phase transitions L 2 – I <strong>and</strong> I – L 2 were<br />
detected in several isotherms as small kinks. Nevertheless,<br />
they are not so clear to be a conclusive evidence. a<br />
isotherms showing these kinks are presented in Fig. 10. The<br />
transition between I – L 2 can be observed easily with the<br />
BAM. An example is shown in Fig. 11. There is no big<br />
change in contrast along the field <strong>of</strong> view during this transition,<br />
although, there is a clear change in the mosaic <strong>of</strong> domains.<br />
In some cases, it is possible to observe how domains<br />
grow.<br />
Our borderline for the L 2 – I transition agrees with experimental<br />
points <strong>of</strong> Lin et al. 14 In the isotherms <strong>of</strong> those<br />
authors, there are some small rounded kinks slightly above<br />
their C – D transition, in the temperature range <strong>of</strong><br />
FIG. 11. Phase transition between I – L 2<br />
phases at T10.9 °C <strong>and</strong> <br />
19.2 mN/m. Defects do not change along the transition, so they can be<br />
used as a guide to the eye to localize domain changes. a I phase slightly<br />
below the transition line, <strong>and</strong> b L 2 phase slightly above the transition line.<br />
7.0– 8.5 °C. That could correspond to the I – L 2 phase transition.<br />
Nevertheless, this is not clear from their isotherms.<br />
They did not make any comment about this feature. Our<br />
observations with the BAM did not allowed us to give a<br />
clear-cut transformation line. This is rather a continuous<br />
transition, where some light gray domains darken slowly becoming<br />
dark gray domains. This goes into the direction <strong>of</strong> a<br />
second-order phase transition. Our observations about the order<br />
<strong>of</strong> the phase transitions do not agree with the work <strong>of</strong><br />
Durbin et al. 13 They classify them in the reverse way, i.e.,<br />
L 2 – I as a first-order <strong>and</strong> I – L 2 as a second-order phase transition.<br />
C. Localized oscillations<br />
In crystalline phases <strong>of</strong> the C 21 monolayer, i.e., L 2 <strong>and</strong><br />
CS , it is possible to observe localized oscillations. These are<br />
localized holes surrounded by Newton rings, which are<br />
blinking, i.e., they appear <strong>and</strong> completely disappear suddenly<br />
in the same place <strong>of</strong> the monolayer. They can be observed<br />
along the monolayer at several parts <strong>of</strong> the field <strong>of</strong> view <strong>of</strong><br />
BAM. In Fig. 12, we present an example <strong>of</strong> these localized<br />
oscillations in four different images, coming from the same<br />
area <strong>of</strong> observation in the monolayer. This images were obtained<br />
from our VCR tape observation records, where the<br />
elapsed time from the first image to the last one is less than<br />
Downloaded 26 Feb 2003 to 132.248.7.15. Redistribution subject to AIP license or copyright, see http://ojps.aip.org/jcpo/jcpcr.jsp
J. Chem. Phys., Vol. 110, No. 14, 8 April 1999 S. Ramos <strong>and</strong> R. Castillo<br />
7029<br />
FIG. 12. Four images <strong>of</strong> a monolayer C 21 in a period <strong>of</strong> time less than a<br />
second, each one showing different localized oscillations. They can be seen<br />
as small holes with newton rings surrounding them. In real time in the<br />
BAM, they look like localized blinking Newton rings. Notice that we are<br />
looking at the same area <strong>of</strong> the field <strong>of</strong> view, as it can be assured by the<br />
persistent fixed defects.<br />
a second. Here, some localized oscillations are seen in one <strong>of</strong><br />
the images, but not in the others. We were unable to measure<br />
a characteristic time <strong>of</strong> oscillation, because the period can go<br />
form a half <strong>of</strong> a second to many oscillation per second, depending<br />
on the chosen localized oscillation. The central part<br />
<strong>of</strong> the blinking Newton rings the holes in the images has a<br />
diameter size <strong>of</strong> the order <strong>of</strong> 23– 31 m. Localized oscillations<br />
can start at low temperatures (2–6°C, <strong>and</strong> at low<br />
pressures compared with the collapse pressure (12 mN/m.<br />
However, as the pressure is increased, the number <strong>of</strong> oscillations<br />
sites increases quite notoriously. The oscillations remain<br />
for a long time until pressure relaxes. In some cases,<br />
these oscillations can be found at the boundary <strong>of</strong> domains.<br />
We made several experiments to find the origin <strong>of</strong> those<br />
oscillations. In some <strong>of</strong> the experiments, we used subphases<br />
previously deaerated to exclude the possibility that bubbles<br />
<strong>of</strong> air formed during the compression, <strong>and</strong> localized below<br />
the monolayer, were the origin <strong>of</strong> the localized oscillations.<br />
Deaeration apparently did not modify the number <strong>of</strong> localized<br />
oscillations when compared with the same experiments,<br />
but using nondeaerated subphases. We also prepared the<br />
monolayer in different conditions to produce a qualitative<br />
modification in the localized oscillation activity. Here, we<br />
make a summary <strong>of</strong> our experiments: a A fully exp<strong>and</strong>ed<br />
monolayer was deposited in a cold subphase (2 – 6 °C, after<br />
a waiting time <strong>of</strong> the order <strong>of</strong> 5 h, the compression process<br />
started on. In this experiment, the number <strong>of</strong> localized oscillations<br />
decreased notoriously; b A fully exp<strong>and</strong>ed monolayer<br />
was deposited on deaerated warm subphase (45.0 °C,<br />
temperature <strong>of</strong> the subphase was lowered slowly for 2 h.<br />
When 2.3 °C was reached, the compression process started<br />
on. Here, there was also a notorious reduction <strong>of</strong> the localized<br />
oscillation; c A fully exp<strong>and</strong>ed monolayer was deposited<br />
on a previously deaerated cold subphase 2 to3°C, <strong>and</strong><br />
compressed after the volatile solvent <strong>of</strong> the spreading solution<br />
was evaporated. In this experiment, there were many<br />
fixed defects fixed newton rings, as well as, too many localized<br />
oscillations along all the field <strong>of</strong> view <strong>of</strong> the BAM;<br />
d A monolayer was deposited on a cold subphase at 2 to3<br />
°C, subsequently, the monolayer was compressed up to <br />
25 mN/m 24 Å 2 /molec.. The next step in this experiment<br />
was to increase temperature slowly up 15.5 °C 2 h,<br />
but maintaining fixed the . In this experiment, initially,<br />
there were too many oscillations, but as temperature was<br />
increased the number <strong>of</strong> localized oscillations decreased, as<br />
well as, the area <strong>of</strong> the monolayer, i.e., there was a loss <strong>of</strong><br />
molecules in the monolayer. In the same way, as temperature<br />
increased, multilayer defects as bright grains <strong>and</strong> mountain<br />
shaped structures increased in number. It is important to<br />
mention, that in all experiments if the speed <strong>of</strong> compression<br />
is increased, the same does the number <strong>of</strong> localized oscillations.<br />
These results about the behavior <strong>of</strong> localized oscillations<br />
in C 21 monolayer suggest that localized oscillations are<br />
big areas with a high density <strong>of</strong> defects dislocations, disclinations,<br />
etc.. Consequently, stress <strong>and</strong> energy are concentrated<br />
in those areas. The monolayer apparently relaxes expelling<br />
matter out <strong>of</strong> the monolayer. Localized oscillations<br />
are quite interesting in themselves <strong>and</strong> they could explain<br />
some events previous to the collapse. We are making<br />
<strong>Langmuir</strong>–Blodgett films with <strong>monolayers</strong> where localized<br />
oscillations are found, to study them with atomic force microscopy.<br />
This study is underway <strong>and</strong> will be published<br />
shortly.<br />
Downloaded 26 Feb 2003 to 132.248.7.15. Redistribution subject to AIP license or copyright, see http://ojps.aip.org/jcpo/jcpcr.jsp
7030 J. Chem. Phys., Vol. 110, No. 14, 8 April 1999 S. Ramos <strong>and</strong> R. Castillo<br />
ACKNOWLEDGMENT<br />
We acknowledge the partial support <strong>of</strong> DGAPA<strong>UNAM</strong><br />
project IN103598.<br />
1 J. Als-Nielsen, D. Jacquemain, K. Kjaer, F. Leveiller, M. Lahav, <strong>and</strong> L.<br />
Leiserowitz, Phys. Rep. 246, 251 1994.<br />
2 C. M. Knobler, in Advances in Chemical Physic, edited by I. Prigogine<br />
<strong>and</strong> S. A. Rice Wiley, New York, 1990, p. 397.<br />
3 D. Höning <strong>and</strong> D. Möbius, J. Phys. Chem. 95, 4590 1991.<br />
4 S. Henon <strong>and</strong> J. Meunier, Rev. Sci. Instrum. 62, 936 1991.<br />
5 E. Stenhagen, in Determination <strong>of</strong> Organic Structures by Physical Methods,<br />
edited by E. A. Braude <strong>and</strong> F. C. Nachord Academic, New York,<br />
1955.<br />
6 M. Lundquist, Prog. Chem. Fats other Lipids 16, 101 1978.<br />
7 M. Lundquist, Chem. Scr. 1, 197 1971.<br />
8 A. M. Bibo, C. M. Knobler, <strong>and</strong> I. R. Peterson, J. Phys. Chem. 95, 5591<br />
1991.<br />
9 D. K. Schwartz, M. W. Tsao, <strong>and</strong> C. M. Knobler, J. Chem. Phys. 101,<br />
8258 1994.<br />
10 T. M. Fischer, R. F. Bruinsma, <strong>and</strong> C. M. Knobler, Phys. Rev. E 50, 413<br />
1994.<br />
11 C. M. Knobler, Science 249, 870 1990.<br />
12 D. Andelman, F. Brochard, C. M. Knobler, <strong>and</strong> F. Rondelez, in Micelles,<br />
Membranes, Microemulsions, <strong>and</strong> Monolayers, edited by W. M. Gelbart,<br />
A. Ben-Sahul, <strong>and</strong> D. Roux Springer, New York, 1994.<br />
13 M. K. Durbin, A. Malik, A. G. Richter, R. Ghaskadvi, T. Gog, <strong>and</strong> P.<br />
Dutta, J. Chem. Phys. 106, 8216 1997.<br />
14 B. Lin, M. C. Shih, T. M. Bohanon, G. E. Ice, <strong>and</strong> P. Dutta, Phys. Rev.<br />
Lett. 65, 191 1990.<br />
15 D. K. Schwartz <strong>and</strong> C. M. Knobler, J. Phys. Chem. 97, 8849 1993.<br />
16 M. K. Durbin, A. Malik, R. Ghaskadvi, M. C. Shih, P. Zschack, <strong>and</strong> P.<br />
Dutta, J. Phys. Chem. 98, 1753 1994.<br />
17 G. A. Overbeck <strong>and</strong> D. Möbius, J. Phys. Chem. 97, 7999 1993.<br />
18 S. Rivière, S. Hénon, J. Meunier, D. K. Schwartz, M. W. Tsao, <strong>and</strong> C. M.<br />
Knobler, J. Chem. Phys. 101, 10045 1994.<br />
19 M. C. Shih, T. M. Bohanon, J. M. Mikrut, P. Zschack, <strong>and</strong> P. Dutta, Phys.<br />
Rev. A 45, 5734 1992.<br />
20 R. M. Kenn, C. Böhm, A. M. Bibo, I. R. Peterson, H. Möhwald, J. Als-<br />
Nielsen, <strong>and</strong> K. Kjaer, J. Phys. Chem. 95, 2092 1991.<br />
21 P. Tippmann-Krayer <strong>and</strong> H. Möhwald, <strong>Langmuir</strong> 7, 2303 1991.<br />
22 D. K. Schwartz, M. L. Schlossman, <strong>and</strong> P. S. Pershan, J. Chem. Phys. 96,<br />
2356 1992.<br />
23 T. M. Bohanon, B. Lin, M. C. Shih, G. E. Ice, <strong>and</strong> P. Dutta, Phys. Rev. B<br />
41, 4846 1990.<br />
24 M. L. Schlossman, D. K. Schwatz, P. S. Pershan, E. H. Kawanoto, G. J.<br />
Kellogg, <strong>and</strong> S. Lee, Phys. Rev. Lett. 66, 1599 1991.<br />
25 K. Kjaer, J. Als-Nielsen, C. A. Helm, P. Tippmann-Krayer, <strong>and</strong> H.<br />
Möhwald, J. Phys. Chem. 93, 3200 1989.<br />
26 G. A. Overbeck, D. Höning, <strong>and</strong> D. Möbius, Thin Solid Films 242, 213<br />
1994.<br />
27 S. Rivière-Cantin, S. Hénon, <strong>and</strong> J. Meunier, Phys. Rev. E 54, 1683<br />
1996.<br />
28 E. Teer, C. M. Knobler, C. Lautz, S. Wurlitzer, J. Kildae, <strong>and</strong> T. M.<br />
Fischer, J. Chem. Phys. 106, 1913 1997.<br />
29 B. Fischer, E. Teer, <strong>and</strong> C. M. Knobler, J. Chem. Phys. 103, 2365 1995.<br />
30 V. M. Kaganer, I. R. Peterson, R. M. Kenn, M. C. Shih, M. Durbin, <strong>and</strong> P.<br />
Dutta, J. Chem. Phys. 102, 9412 1995.<br />
Downloaded 26 Feb 2003 to 132.248.7.15. Redistribution subject to AIP license or copyright, see http://ojps.aip.org/jcpo/jcpcr.jsp