Langmuir monolayers of C17, C19, and C21 fatty acids ... - UNAM
Langmuir monolayers of C17, C19, and C21 fatty acids ... - UNAM
Langmuir monolayers of C17, C19, and C21 fatty acids ... - UNAM

You also want an ePaper? Increase the reach of your titles
YUMPU automatically turns print PDFs into web optimized ePapers that Google loves.
7026 J. Chem. Phys., Vol. 110, No. 14, 8 April 1999 S. Ramos <strong>and</strong> R. Castillo<br />
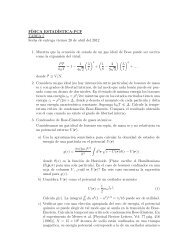
FIG. 6. Phases observed with the BAM close to the L 2 – CS <strong>and</strong> L 2 – CS<br />
phase transitions. L 2 phase as seen just below the transition, upper panel,<br />
<strong>and</strong> CS phase just above the transition, medium panel (T4.9 °C <strong>and</strong> <br />
18.6 mN/m. In the lower panel, we show L 2 phase just starting the<br />
transformation to CS phase (T2.2 °C <strong>and</strong> 19.0 mN/m. Here, there is<br />
a light-gray needle-shaped structure, which suddenly appeared in the lower<br />
left part <strong>of</strong> the field <strong>of</strong> view, in the gray area.<br />
can be seen disappearing steadily from one phase (L 2 ) to the<br />
other (Ov), decompressing the monolayer. All our observations<br />
are consistent with a first-order transition, in agreement<br />
with the observations <strong>of</strong> Rivière et al. In C 21 , one part <strong>of</strong> the<br />
L 2 – Ov boundary must be almost vertical since, it was impossible<br />
for us to catch more experimental points for this<br />
phase transition close to 37 °C. See Fig. 3.<br />
The transition from L 2 – L 2 was observed with the BAM<br />
in C 19 <strong>and</strong> C 21 . This transition is characterized by a change<br />
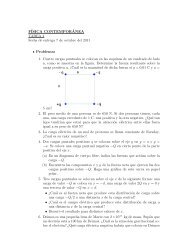
FIG. 7. Phases observed with the BAM close to the L 2 – Ov phase transition<br />
at T22.8 °C <strong>and</strong> 19.4– 19.7 mN/m. a L 2 phase slightly below<br />
the phase transition; b When L 2 phase is compressed, the Ov phase appears;<br />
c Decompressing the monolayer, L 2 phase is recovered with almost<br />
the same domains.<br />
<strong>of</strong> domain shapes. The contrast between domains is low but<br />
clearly visible, as well as the phase transition. These features<br />
can be seen in Fig. 8. The low level <strong>of</strong> contrast is due to the<br />
same degree <strong>of</strong> anisotropy in both phases. We can see how<br />
rapid domains grow, decompressing the monolayer. We classify<br />
the transition as first order, however, the lack <strong>of</strong> contrast<br />
between domains does not allow to see the growing <strong>of</strong> domains<br />
as clearly as in other cases previously mentioned.<br />
Compressing the L 2 phase <strong>of</strong> C 21 <strong>fatty</strong> acid, at low temperature,<br />
allowed us to reach the outst<strong>and</strong>ing phase transition<br />
Downloaded 26 Feb 2003 to 132.248.7.15. Redistribution subject to AIP license or copyright, see http://ojps.aip.org/jcpo/jcpcr.jsp