Unn Ljøstad and Åse Mygland Jone Furlund Owe and Nils ... - ACNR
Unn Ljøstad and Åse Mygland Jone Furlund Owe and Nils ... - ACNR
Unn Ljøstad and Åse Mygland Jone Furlund Owe and Nils ... - ACNR

Create successful ePaper yourself
Turn your PDF publications into a flip-book with our unique Google optimized e-Paper software.
Neuroradiology Article<br />
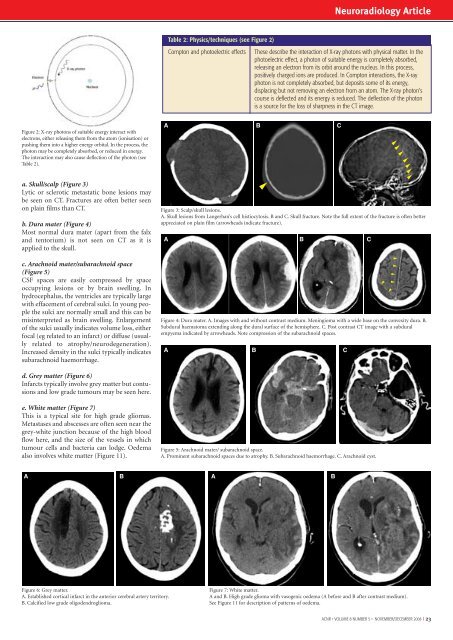
Table 2: Physics/techniques (see Figure 2)<br />
Compton <strong>and</strong> photoelectric effects<br />
These describe the interaction of X-ray photons with physical matter. In the<br />
photoelectric effect, a photon of suitable energy is completely absorbed,<br />
releasing an electron from its orbit around the nucleus. In this process,<br />
positively charged ions are produced. In Compton interactions, the X-ray<br />
photon is not completely absorbed, but deposits some of its energy,<br />
displacing but not removing an electron from an atom. The X-ray photon’s<br />
course is deflected <strong>and</strong> its energy is reduced. The deflection of the photon<br />
is a source for the loss of sharpness in the CT image.<br />
Figure 2: X-ray photons of suitable energy interact with<br />
electrons, either releasing them from the atom (ionisation) or<br />
pushing them into a higher energy orbital. In the process, the<br />
photon may be completely absorbed, or reduced in energy.<br />
The interaction may also cause deflection of the photon (see<br />
Table 2).<br />
A B C<br />
/<br />
/<br />
/<br />
/<br />
/<br />
/<br />
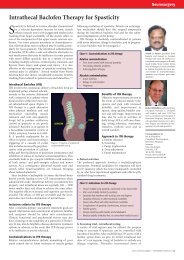
a. Skull/scalp (Figure 3)<br />
Lytic or sclerotic metastatic bone lesions may<br />
be seen on CT. Fractures are often better seen<br />
on plain films than CT.<br />
b. Dura mater (Figure 4)<br />
Most normal dura mater (apart from the falx<br />
<strong>and</strong> tentorium) is not seen on CT as it is<br />
applied to the skull.<br />
c. Arachnoid mater/subarachnoid space<br />
(Figure 5)<br />
CSF spaces are easily compressed by space<br />
occupying lesions or by brain swelling. In<br />
hydrocephalus, the ventricles are typically large<br />
with effacement of cerebral sulci. In young people<br />
the sulci are normally small <strong>and</strong> this can be<br />
misinterpreted as brain swelling. Enlargement<br />
of the sulci usually indicates volume loss, either<br />
focal (eg related to an infarct) or diffuse (usually<br />
related to atrophy/neurodegeneration).<br />
Increased density in the sulci typically indicates<br />
subarachnoid haemorrhage.<br />
Figure 3: Scalp/skull lesions.<br />
A. Skull lesions from Langerhan’s cell histiocytosis. B <strong>and</strong> C. Skull fracture. Note the full extent of the fracture is often better<br />
appreciated on plain film (arrowheads indicate fracture).<br />
A B C<br />
Figure 4: Dura mater. A. Images with <strong>and</strong> without contrast medium. Meningioma with a wide base on the convexity dura. B.<br />
Subdural haematoma extending along the dural surface of the hemisphere. C. Post contrast CT image with a subdural<br />
empyema indicated by arrowheads. Note compression of the subarachnoid spaces.<br />
A<br />
B<br />
/<br />
C<br />
/<br />
/<br />
/<br />
/<br />
/<br />
/<br />
/<br />
d. Grey matter (Figure 6)<br />
Infarcts typically involve grey matter but contusions<br />
<strong>and</strong> low grade tumours may be seen here.<br />
e. White matter (Figure 7)<br />
This is a typical site for high grade gliomas.<br />
Metastases <strong>and</strong> abscesses are often seen near the<br />
grey-white junction because of the high blood<br />
flow here, <strong>and</strong> the size of the vessels in which<br />
tumour cells <strong>and</strong> bacteria can lodge. Oedema<br />
also involves white matter (Figure 11).<br />
Figure 5: Arachnoid mater/ subarachnoid space.<br />
A. Prominent subarachnoid spaces due to atrophy. B. Subarachnoid haemorrhage. C. Arachnoid cyst.<br />
A B A B<br />
Figure 6: Grey matter.<br />
A. Established cortical infarct in the anterior cerebral artery territory.<br />
B. Calcified low grade oligodendroglioma.<br />
Figure 7: White matter.<br />
A <strong>and</strong> B. High grade glioma with vasogenic oedema (A before <strong>and</strong> B after contrast medium).<br />
See Figure 11 for description of patterns of oedema.<br />
<strong>ACNR</strong> • VOLUME 8 NUMBER 5 • NOVEMBER/DECEMBER 2008 I 23