Unn Ljøstad and Åse Mygland Jone Furlund Owe and Nils ... - ACNR
Unn Ljøstad and Åse Mygland Jone Furlund Owe and Nils ... - ACNR
Unn Ljøstad and Åse Mygland Jone Furlund Owe and Nils ... - ACNR

Create successful ePaper yourself
Turn your PDF publications into a flip-book with our unique Google optimized e-Paper software.
Neuroradiology Article<br />
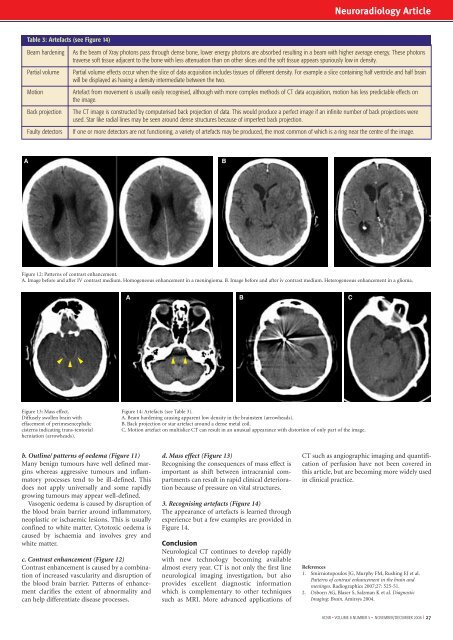
Table 3: Artefacts (see Figure 14)<br />
Beam hardening<br />
Partial volume<br />
Motion<br />
Back projection<br />
Faulty detectors<br />
As the beam of Xray photons pass through dense bone, lower energy photons are absorbed resulting in a beam with higher average energy. These photons<br />
traverse soft tissue adjacent to the bone with less attenuation than on other slices <strong>and</strong> the soft tissue appears spuriously low in density.<br />
Partial volume effects occur when the slice of data acquisition includes tissues of different density. For example a slice containing half ventricle <strong>and</strong> half brain<br />
will be displayed as having a density intermediate between the two.<br />
Artefact from movement is usually easily recognised, although with more complex methods of CT data acquisition, motion has less predictable effects on<br />
the image.<br />
The CT image is constructed by computerised back projection of data. This would produce a perfect image if an infinite number of back projections were<br />
used. Star like radial lines may be seen around dense structures because of imperfect back projection.<br />
If one or more detectors are not functioning, a variety of artefacts may be produced, the most common of which is a ring near the centre of the image.<br />
A<br />
B<br />
Figure 12: Patterns of contrast enhancement.<br />
A. Image before <strong>and</strong> after IV contrast medium. Homogeneous enhancement in a meningioma. B. Image before <strong>and</strong> after iv contrast medium. Heterogeneous enhancement in a glioma.<br />
A B C<br />
/<br />
/<br />
/<br />
/<br />
/<br />
Figure 13: Mass effect.<br />
Diffusely swollen brain with<br />
effacement of perimesencephalic<br />
cisterns indicating trans-tentorial<br />
herniation (arrowheads).<br />
Figure 14: Artefacts (see Table 3).<br />
A. Beam hardening causing apparent low density in the brainstem (arrowheads).<br />
B. Back projection or star artefact around a dense metal coil.<br />
C. Motion artefact on multislice CT can result in an unusual appearance with distortion of only part of the image.<br />
b. Outline/ patterns of oedema (Figure 11)<br />
Many benign tumours have well defined margins<br />
whereas aggressive tumours <strong>and</strong> inflammatory<br />
processes tend to be ill-defined. This<br />
does not apply universally <strong>and</strong> some rapidly<br />
growing tumours may appear well-defined.<br />
Vasogenic oedema is caused by disruption of<br />
the blood brain barrier around inflammatory,<br />
neoplastic or ischaemic lesions. This is usually<br />
confined to white matter. Cytotoxic oedema is<br />
caused by ischaemia <strong>and</strong> involves grey <strong>and</strong><br />
white matter.<br />
c. Contrast enhancement (Figure 12)<br />
Contrast enhancement is caused by a combination<br />
of increased vascularity <strong>and</strong> disruption of<br />
the blood brain barrier. Patterns of enhancement<br />
clarifies the extent of abnormality <strong>and</strong><br />
can help differentiate disease processes.<br />
d. Mass effect (Figure 13)<br />
Recognising the consequences of mass effect is<br />
important as shift between intracranial compartments<br />
can result in rapid clinical deterioration<br />
because of pressure on vital structures.<br />
3. Recognising artefacts (Figure 14)<br />
The appearance of artefacts is learned through<br />
experience but a few examples are provided in<br />
Figure 14.<br />
Conclusion<br />
Neurological CT continues to develop rapidly<br />
with new technology becoming available<br />
almost every year. CT is not only the first line<br />
neurological imaging investigation, but also<br />
provides excellent diagnostic information<br />
which is complementary to other techniques<br />
such as MRI. More advanced applications of<br />
CT such as angiographic imaging <strong>and</strong> quantification<br />
of perfusion have not been covered in<br />
this article, but are becoming more widely used<br />
in clinical practice.<br />
References<br />
1. Smirniotopoulos JG, Murphy FM, Rushing EJ et al.<br />
Patterns of contrast enhancement in the brain <strong>and</strong><br />
meninges. Radiographics 2007;27: 525-51.<br />
2. Osborn AG, Blaser S, Salzman K et al. Diagnostic<br />
Imaging: Brain. Amirsys 2004.<br />
<strong>ACNR</strong> • VOLUME 8 NUMBER 5 • NOVEMBER/DECEMBER 2008 I 27