Unn Ljøstad and Åse Mygland Jone Furlund Owe and Nils ... - ACNR
Unn Ljøstad and Åse Mygland Jone Furlund Owe and Nils ... - ACNR
Unn Ljøstad and Åse Mygland Jone Furlund Owe and Nils ... - ACNR

You also want an ePaper? Increase the reach of your titles
YUMPU automatically turns print PDFs into web optimized ePapers that Google loves.
/<br />
/<br />
/<br />
Neuroradiology Article<br />
A<br />
B<br />
C<br />
/<br />
/<br />
/<br />
/<br />
/<br />
/<br />
/<br />
/<br />
/<br />
/<br />
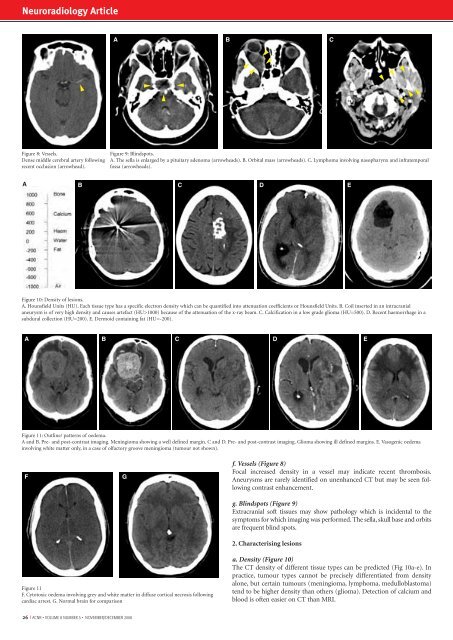
Figure 8: Vessels.<br />
Dense middle cerebral artery following<br />
recent occlusion (arrowhead).<br />
Figure 9: Blindspots.<br />
A. The sella is enlarged by a pituitary adenoma (arrowheads). B. Orbital mass (arrowheads). C. Lymphoma involving nasopharynx <strong>and</strong> infratemporal<br />
fossa (arrowheads).<br />
A<br />
B<br />
C D E<br />
Figure 10: Density of lesions.<br />
A. Hounsfield Units (HU). Each tissue type has a specific electron density which can be quantified into attenuation coefficients or Hounsfield Units. B. Coil inserted in an intracranial<br />
aneurysm is of very high density <strong>and</strong> causes artefact (HU>1000) because of the attenuation of the x-ray beam. C. Calcification in a low grade glioma (HU=500). D. Recent haemorrhage in a<br />
subdural collection (HU=200). E. Dermoid containing fat (HU=-200).<br />
A<br />
B C D E<br />
Figure 11: Outline/ patterns of oedema.<br />
A <strong>and</strong> B. Pre- <strong>and</strong> post-contrast imaging. Meningioma showing a well defined margin. C <strong>and</strong> D. Pre- <strong>and</strong> post-contrast imaging. Glioma showing ill defined margins. E. Vasogenic oedema<br />
involving white matter only, in a case of olfactory groove meningioma (tumour not shown).<br />
F<br />
G<br />
f. Vessels (Figure 8)<br />
Focal increased density in a vessel may indicate recent thrombosis.<br />
Aneurysms are rarely identified on unenhanced CT but may be seen following<br />
contrast enhancement.<br />
g. Blindspots (Figure 9)<br />
Extracranial soft tissues may show pathology which is incidental to the<br />
symptoms for which imaging was performed. The sella, skull base <strong>and</strong> orbits<br />
are frequent blind spots.<br />
2. Characterising lesions<br />
Figure 11<br />
F. Cytotoxic oedema involving grey <strong>and</strong> white matter in diffuse cortical necrosis following<br />
cardiac arrest. G. Normal brain for comparison<br />
a. Density (Figure 10)<br />
The CT density of different tissue types can be predicted (Fig 10a-e). In<br />
practice, tumour types cannot be precisely differentiated from density<br />
alone, but certain tumours (meningioma, lymphoma, medulloblastoma)<br />
tend to be higher density than others (glioma). Detection of calcium <strong>and</strong><br />
blood is often easier on CT than MRI.<br />
26 I <strong>ACNR</strong> • VOLUME 8 NUMBER 5 • NOVEMBER/DECEMBER 2008