Financing Education / pdf - Unesco
Financing Education / pdf - Unesco
Financing Education / pdf - Unesco

You also want an ePaper? Increase the reach of your titles
YUMPU automatically turns print PDFs into web optimized ePapers that Google loves.
PROGRESS IN FINANCING EDUCATION FOR ALL<br />
Changing national financial commitments to EFA since Dakar<br />
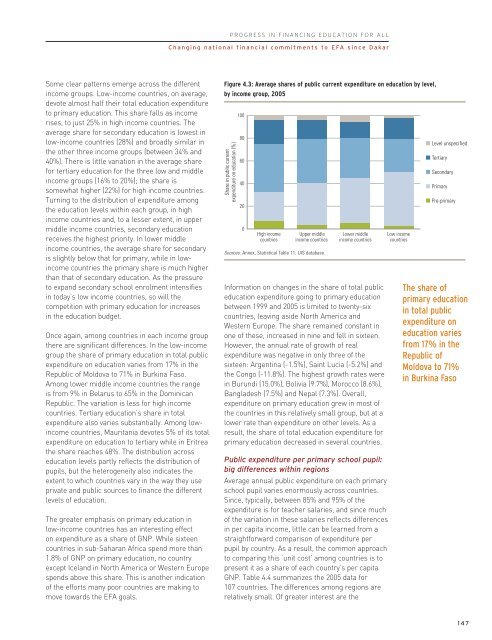
Some clear patterns emerge across the different<br />
income groups. Low-income countries, on average,<br />
devote almost half their total education expenditure<br />
to primary education. This share falls as income<br />
rises, to just 25% in high income countries. The<br />
average share for secondary education is lowest in<br />
low-income countries (28%) and broadly similar in<br />
the other three income groups (between 34% and<br />
40%). There is little variation in the average share<br />
for tertiary education for the three low and middle<br />
income groups (16% to 20%); the share is<br />
somewhat higher (22%) for high income countries.<br />
Turning to the distribution of expenditure among<br />
the education levels within each group, in high<br />
income countries and, to a lesser extent, in upper<br />
middle income countries, secondary education<br />
receives the highest priority. In lower middle<br />
income countries, the average share for secondary<br />
is slightly below that for primary, while in lowincome<br />
countries the primary share is much higher<br />
than that of secondary education. As the pressure<br />
to expand secondary school enrolment intensifies<br />
in today’s low income countries, so will the<br />
competition with primary education for increases<br />
in the education budget.<br />
Once again, among countries in each income group<br />
there are significant differences. In the low-income<br />
group the share of primary education in total public<br />
expenditure on education varies from 17% in the<br />
Republic of Moldova to 71% in Burkina Faso.<br />
Among lower middle income countries the range<br />
is from 9% in Belarus to 65% in the Dominican<br />
Republic. The variation is less for high income<br />
countries. Tertiary education’s share in total<br />
expenditure also varies substantially. Among lowincome<br />
countries, Mauritania devotes 5% of its total<br />
expenditure on education to tertiary while in Eritrea<br />
the share reaches 48%. The distribution across<br />
education levels partly reflects the distribution of<br />
pupils, but the heterogeneity also indicates the<br />
extent to which countries vary in the way they use<br />
private and public sources to finance the different<br />
levels of education.<br />
The greater emphasis on primary education in<br />
low-income countries has an interesting effect<br />
on expenditure as a share of GNP. While sixteen<br />
countries in sub-Saharan Africa spend more than<br />
1.8% of GNP on primary education, no country<br />
except Iceland in North America or Western Europe<br />
spends above this share. This is another indication<br />
of the efforts many poor countries are making to<br />
move towards the EFA goals.<br />
Figure 4.3: Average shares of public current expenditure on education by level,<br />
by income group, 2005<br />
Share in public current<br />
expenditure on education (%)<br />
100<br />
80<br />
60<br />
40<br />
20<br />
0<br />
High income<br />
countries<br />
Upper middle<br />
income countries<br />
Sources: Annex, Statistical Table 11; UIS database.<br />
Lower middle<br />
income countries<br />
Information on changes in the share of total public<br />
education expenditure going to primary education<br />
between 1999 and 2005 is limited to twenty-six<br />
countries, leaving aside North America and<br />
Western Europe. The share remained constant in<br />
one of these, increased in nine and fell in sixteen.<br />
However, the annual rate of growth of real<br />
expenditure was negative in only three of the<br />
sixteen: Argentina (-1.5%), Saint Lucia (-5.2%) and<br />
the Congo (-11.8%). The highest growth rates were<br />
in Burundi (15.0%), Bolivia (9.7%), Morocco (8.6%),<br />
Bangladesh (7.5%) and Nepal (7.3%). Overall,<br />
expenditure on primary education grew in most of<br />
the countries in this relatively small group, but at a<br />
lower rate than expenditure on other levels. As a<br />
result, the share of total education expenditure for<br />
primary education decreased in several countries.<br />
Public expenditure per primary school pupil:<br />
big differences within regions<br />
Average annual public expenditure on each primary<br />
school pupil varies enormously across countries.<br />
Since, typically, between 85% and 95% of the<br />
expenditure is for teacher salaries, and since much<br />
of the variation in these salaries reflects differences<br />
in per capita income, little can be learned from a<br />
straightforward comparison of expenditure per<br />
pupil by country. As a result, the common approach<br />
to comparing this ‘unit cost’ among countries is to<br />
present it as a share of each country’s per capita<br />
GNP. Table 4.4 summarizes the 2005 data for<br />
107 countries. The differences among regions are<br />
relatively small. Of greater interest are the<br />
Low income<br />
countries<br />
Level unspecified<br />
Tertiary<br />
Secondary<br />
Primary<br />
Pre-primary<br />
The share of<br />
primary education<br />
in total public<br />
expenditure on<br />
education varies<br />
from 17% in the<br />
Republic of<br />
Moldova to 71%<br />
in Burkina Faso<br />
147