Chapter 2. Progress towards the EFA goals - Unesco
Chapter 2. Progress towards the EFA goals - Unesco
Chapter 2. Progress towards the EFA goals - Unesco

Create successful ePaper yourself
Turn your PDF publications into a flip-book with our unique Google optimized e-Paper software.
0<br />
Education for All Global Monitoring Report<br />
2<br />
0<br />
1<br />
0<br />
2<br />
0<br />
1<br />
Overcrowded and under-resourced:<br />
a classroom in Malawi<br />
Education for All Global Monitoring Report<br />
© Louise Gubb/Corbis<br />
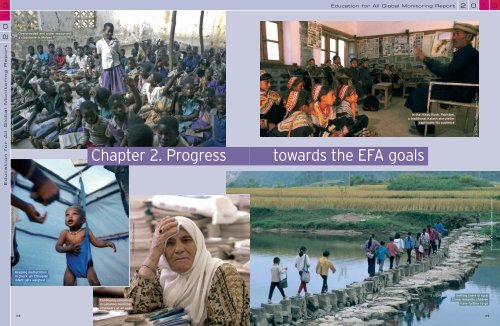
<strong>Chapter</strong> <strong>2.</strong> <strong>Progress</strong><br />
<strong>towards</strong> <strong>the</strong> <strong>EFA</strong> <strong>goals</strong><br />
In <strong>the</strong> Hindu Kush, Pakistan,<br />
a traditional Kalash storyteller<br />
captivates his audience<br />
© Alfredo Caliz/PANOS<br />
© REUTERS/Zohra Bensemra<br />
© Patrick Le Floch/Explorer/Eyedea Illustration<br />
© Chretien Eric/Gamma/Eyedea Presse<br />
Keeping malnutrition<br />
in check: an Ethiopian<br />
infant gets weighed<br />
38<br />
Continuing education<br />
in Lebanon: learning<br />
empowers at all ages<br />
Getting <strong>the</strong>re in rural<br />
China: minority children<br />
have fur<strong>the</strong>r to go<br />
39
1<br />
0<br />
CHAPTER 2<br />
Education for All Global Monitoring Report<br />
2<br />
0<br />
Introduction .................................................................. 41<br />
Early childhood care<br />
and education ............................................................ 42<br />
Universal primary education .............. 54<br />
Youth and adult skills –<br />
expanding opportunities<br />
in <strong>the</strong> new global economy ................... 76<br />
Youth and adult literacy ............................. 94<br />
The quality of education ............................ 104<br />
Estimating <strong>the</strong> cost of<br />
achieving Education for All ................... 119<br />
Monitoring national trends<br />
is <strong>the</strong> core task of <strong>the</strong> <strong>EFA</strong> Global<br />
Monitoring Report. This chapter<br />
examines progress <strong>towards</strong><br />
<strong>the</strong> <strong>goals</strong> adopted at Dakar.<br />
It documents differences across<br />
countries and regions, as well as<br />
<strong>the</strong> sometimes dramatic<br />
differences that coexist within a<br />
single border. It highlights <strong>the</strong> role<br />
of persistent inequalities in holding<br />
back advances <strong>towards</strong> all of <strong>the</strong><br />
<strong>EFA</strong> <strong>goals</strong> and considers <strong>the</strong> degree<br />
to which governments and aid<br />
donors are meeting – or falling<br />
short – of <strong>the</strong>ir promises to invest<br />
in basic education. A costing<br />
exercise assesses <strong>the</strong> financing gap<br />
for forty-six low-income countries,<br />
putting a price tag on <strong>the</strong> cost<br />
of delivering a quality education<br />
to every child, youth and adult.<br />
40
PROGRESS TOWARDS THE <strong>EFA</strong> GOALS<br />
Introduction<br />
Introduction<br />
The Dakar Framework for Action, adopted by<br />
164 governments in 2000, is one of <strong>the</strong> most<br />
comprehensive, wide-ranging and ambitious of<br />
all commitments undertaken by <strong>the</strong> international<br />
community. It pledges to expand learning<br />
opportunities for every youth, adult and child –<br />
and to achieve specific targets in key areas by 2015.<br />
With just five years to go to <strong>the</strong> target date, this<br />
chapter of <strong>the</strong> Report monitors progress <strong>towards</strong><br />
<strong>the</strong> Education for All <strong>goals</strong> set under <strong>the</strong> Dakar<br />
Framework. Effective monitoring is vital to<br />
achieving international development targets. Apart<br />
from keeping <strong>the</strong> <strong>goals</strong> <strong>the</strong>mselves in <strong>the</strong> spotlight,<br />
it can highlight examples of success, provide early<br />
warning of failure, inform policy and support<br />
advocacy. At an international level, measuring<br />
progress <strong>towards</strong> shared <strong>goals</strong> gives insight into<br />
<strong>the</strong> strengths and weaknesses of national<br />
strategies. It demonstrates what can be achieved<br />
in practice and shows that all countries, whatever<br />
<strong>the</strong>ir level of development, can make progress<br />
under strong political leadership. Above all,<br />
monitoring provides a tool to hold governments<br />
accountable for <strong>the</strong> degree to which <strong>the</strong>y act on<br />
<strong>the</strong> commitments <strong>the</strong>y undertake at international<br />
summit meetings.<br />
This chapter starts by highlighting <strong>the</strong> importance<br />
of early childhood care and education in creating<br />
<strong>the</strong> foundations for lifelong learning. It <strong>the</strong>n<br />
monitors progress <strong>towards</strong> universal primary<br />
education, an area which raises serious concerns.<br />
While <strong>the</strong> number of children not attending school<br />
continues to fall, <strong>the</strong> most recent school enrolment<br />
data suggest that <strong>the</strong> goal of universal primary<br />
education by 2015 will be missed. Moreover,<br />
household survey evidence suggests that more<br />
children may be out of school than <strong>the</strong> official<br />
data indicate. <strong>Progress</strong> in school participation<br />
continues to outstrip progress in learning<br />
achievement, pointing to a widening gap between<br />
quantitative and qualitative indicators of progress.<br />
The chapter fur<strong>the</strong>r shows that advances in adult<br />
literacy fall far short of <strong>the</strong> <strong>goals</strong>. Meanwhile,<br />
technical and vocational education programmes<br />
have – at best – a mixed record in responding<br />
to <strong>the</strong> learning needs of youth and young adults.<br />
Financing is critical to accelerating progress<br />
<strong>towards</strong> <strong>the</strong> Education for All <strong>goals</strong>. Current global<br />
estimates of <strong>the</strong> financing required to meet <strong>the</strong><br />
2015 targets are outdated and methodologically<br />
flawed, primarily because <strong>the</strong>y do not take into<br />
account <strong>the</strong> cost of reaching disadvantaged groups.<br />
This Report provides an updated analysis of <strong>the</strong><br />
financing needed to reach key targets, adjusted for<br />
<strong>the</strong> incremental cost of extending opportunities to<br />
disadvantaged groups. The analysis shows that<br />
financing gaps have been underestimated and that<br />
developing country governments and aid donors will<br />
have to act with urgency to close <strong>the</strong>se gaps.<br />
Monitoring is about more than technical<br />
measurement of progress. This chapter highlights<br />
<strong>the</strong> strong connections between progress <strong>towards</strong><br />
specific <strong>goals</strong> and underlying problems of<br />
inequality and social marginalization, which<br />
<strong>Chapter</strong> 3 examines fur<strong>the</strong>r. While national data<br />
help illuminate broad trends, <strong>the</strong>y can obscure<br />
underlying disparities. Gender disparities are<br />
narrowing in many areas, but young girls and<br />
women continue to face disadvantages at several<br />
levels, from early childhood, through primary and<br />
secondary school, and into adulthood. Wider<br />
inequalities linked to poverty, language, ethnicity,<br />
region and o<strong>the</strong>r factors also restrict opportunity<br />
on a global scale.<br />
Global monitoring exercises inevitably reveal<br />
complex and varied patterns. Two broad messages<br />
emerge from <strong>the</strong> detail of national and regional<br />
progress reports on <strong>the</strong> Education for All <strong>goals</strong>.<br />
The first is good news: <strong>the</strong>re is unequivocal<br />
evidence that <strong>the</strong> world is moving in <strong>the</strong> right<br />
direction, with many of <strong>the</strong> poorest countries<br />
registering impressive advances on many fronts.<br />
Their record demonstrates what is achievable<br />
– and shows that many of <strong>the</strong> 2015 <strong>goals</strong> are still<br />
within reach. The second message is cautionary,<br />
with a ‘bad news’ element: on current trends,<br />
progress <strong>towards</strong> <strong>the</strong> Dakar <strong>goals</strong> is far too slow<br />
to meet <strong>the</strong> 2015 targets. An underlying problem<br />
is <strong>the</strong> failure of many governments to put higher<br />
priority on policies that extend opportunities<br />
to <strong>the</strong> most marginalized sections of society.<br />
Failure to change this picture will result in<br />
<strong>the</strong> international community falling far short<br />
of <strong>the</strong> promise made at Dakar in 2000.<br />
<strong>Progress</strong> <strong>towards</strong><br />
<strong>the</strong> Dakar <strong>goals</strong><br />
is far too slow<br />
to meet <strong>the</strong> 2015<br />
targets<br />
41
0<br />
1<br />
2<br />
0<br />
CHAPTER 2<br />
Education for All Global Monitoring Report<br />
High-quality care<br />
in <strong>the</strong> early years<br />
can act as<br />
a springboard for<br />
success in school<br />
Early childhood care<br />
and education<br />
Goal 1: Expanding and improving comprehensive<br />
early childhood care and education, especially for<br />
<strong>the</strong> most vulnerable and disadvantaged children.<br />
‘Five- and six-year-old children are <strong>the</strong> inheritors<br />
of poverty’s curse and not its creators. Unless we<br />
act <strong>the</strong>se children will pass it onto <strong>the</strong> next<br />
generation like a family birthmark.’<br />
These remarks by United States President Lyndon<br />
B. Johnson (1965) retain a powerful resonance.<br />
Early childhood can create <strong>the</strong> foundations for a life<br />
of expanded opportunity – or it can lock children into<br />
a future of deprivation and marginalization. There is<br />
strong – and growing – evidence that high-quality<br />
care in <strong>the</strong> early years can act as a springboard<br />
for success in school. In turn, education provides<br />
vulnerable and disadvantaged children with a<br />
chance to escape poverty, build a more secure<br />
future and realize <strong>the</strong>ir potential. The past decade<br />
has witnessed rapid and sustained increases in <strong>the</strong><br />
number of children entering primary school in <strong>the</strong><br />
world’s poorest countries. Yet every year millions<br />
of children start school carrying <strong>the</strong> handicap<br />
that comes with <strong>the</strong> experience of malnutrition,<br />
ill health and poverty in <strong>the</strong>ir early years.<br />
For many that experience starts, quite literally,<br />
in <strong>the</strong> womb and continues through <strong>the</strong> early years.<br />
Maternal undernutrition and <strong>the</strong> failure of health<br />
systems to provide effective antenatal support,<br />
along with safe delivery and post-natal care,<br />
contribute to child mortality. They also help transmit<br />
educational disadvantage across generations.<br />
Malnutrition before children enter school is ano<strong>the</strong>r<br />
formidable barrier to education. Apart from<br />
threatening lives, it robs children of <strong>the</strong> opportunity<br />
to develop <strong>the</strong>ir potential for learning. That is why<br />
<strong>the</strong> eradication of child malnutrition should be<br />
viewed not just as a development imperative in<br />
its own right, but as a key element in <strong>the</strong> Education<br />
for All agenda.<br />
Effective early childhood care and education can<br />
give children a better chance of escaping what<br />
President Johnson called ‘poverty’s curse’. While<br />
much has been achieved, <strong>the</strong> monitoring evidence<br />
set out in this section suggests that far more has to<br />
be done. To summarize some of <strong>the</strong> key messages:<br />
Malnutrition needs to be recognized as both a<br />
health and an education emergency. Malnutrition<br />
is damaging <strong>the</strong> bodies and minds of around<br />
178 million young children each year,<br />
undermining <strong>the</strong>ir potential for learning,<br />
reinforcing inequality in education and beyond,<br />
and reducing <strong>the</strong> efficiency of investment in<br />
school systems.<br />
Improved access to maternal and child health<br />
care should be seen as a high priority for<br />
education, as well as for public health. Charging<br />
fees for basic services is locking millions of<br />
vulnerable women out of health systems and<br />
exposing <strong>the</strong>ir children to unnecessary risks.<br />
As in <strong>the</strong> education sector, <strong>the</strong> elimination of<br />
user fees should be treated as a high priority.<br />
Governments need to tackle inequality in access<br />
to early childhood care. Those in greatest need of<br />
early childhood care – and with <strong>the</strong> most to gain<br />
from it – have <strong>the</strong> least access. In both rich and<br />
poor countries, parental income and education<br />
heavily influence who attends pre-school<br />
programmes, pointing to <strong>the</strong> need for greater<br />
equity in public provision and financing.<br />
This section is divided into two parts. Part 1<br />
reviews progress and <strong>the</strong> current status of some<br />
key indicators of child well-being and nutrition<br />
in developing countries, and highlights <strong>the</strong> strong<br />
links between maternal and child health. Part 2<br />
provides a snapshot of access to early childhood<br />
programmes across <strong>the</strong> world, along with<br />
evidence that <strong>the</strong>se programmes can play an<br />
important role in equalizing opportunity and<br />
overcoming marginalization.<br />
Malnutrition and ill health —<br />
a ‘silent emergency’ in education<br />
With some notable exceptions, governments<br />
across <strong>the</strong> world have failed to accelerate progress<br />
in combating child hunger. And with <strong>the</strong> sharp<br />
hike in global food prices during 2007 and 2008,<br />
and <strong>the</strong> economic downturn pushing more children<br />
into poverty, a picture that was already bleak has<br />
been deteriorating.<br />
Retarded growth in <strong>the</strong> womb, early-childhood<br />
stunting and anaemia are not typically viewed<br />
as mainstream education issues. The evidence<br />
strongly suggests that <strong>the</strong>y should be. Each of<br />
<strong>the</strong>se conditions can have profound and<br />
irreversible effects on a child’s ability to learn,<br />
undermining <strong>the</strong> potential benefits of education.<br />
42
PROGRESS TOWARDS THE <strong>EFA</strong> GOALS<br />
Early childhood care and education<br />
Neurological science helps explain why education<br />
prospects are shaped in utero and during <strong>the</strong><br />
early years of life. The period from about three<br />
months before birth is critical to <strong>the</strong> formation<br />
of neural pathways, while <strong>the</strong> first three years<br />
are marked by rapid development of language<br />
and memory (Bennett, 2008). Normal brain<br />
development during this period creates a<br />
foundation for future school achievement and<br />
lifelong learning (Harvard University Center on<br />
<strong>the</strong> Developing Child, 2007).<br />
Children who suffer nutritional deprivation in utero<br />
or during <strong>the</strong>ir early years pay a high price later<br />
in life. There is a powerful and growing body of<br />
evidence that nutritional status during <strong>the</strong> first<br />
two years of life strongly determines later<br />
performance in education (Alderman et al., 2001;<br />
Glewwe et al., 2001; Grantham-McGregor et al.,<br />
2007). Children who experience episodes of early<br />
malnutrition tend to score worse on tests of<br />
cognitive function, psychomotor development, fine<br />
motor skills, activity levels and attention span<br />
(Alderman et al., 2006; Behrman, 1996; Maluccio<br />
et al., 2009). They also tend to start school later<br />
and are at greater risk of dropping out before<br />
completing a full primary school cycle. A recent<br />
study in Guatemala finds that <strong>the</strong> impact of being<br />
stunted at age 6 is equivalent in its test score<br />
effects to losing four grades of schooling<br />
(Behrman et al., 2008). The critical but widely<br />
ignored insight to emerge from <strong>the</strong> research<br />
evidence is that what children are able to learn<br />
in school is heavily influenced by pre-school<br />
health and nutrition.<br />
Research carried out for this year’s <strong>EFA</strong> Global<br />
Monitoring Report adds fur<strong>the</strong>r weight to evidence<br />
of <strong>the</strong> long-term impact of nutrition on cognitive<br />
development (Box <strong>2.</strong>1). Drawing on <strong>the</strong> Young<br />
Lives Survey, a unique data set that tracks<br />
children in Ethiopia, India, Peru and Viet Nam<br />
through <strong>the</strong>ir early years, <strong>the</strong> analysis documents<br />
marked nutrition-related disadvantages revealed<br />
in test scores at age 4 to 5. By age 7 to 8, <strong>the</strong><br />
malnutrition penalty is equivalent to <strong>the</strong> loss<br />
of a full term of schooling (Sanchez, 2009).<br />
Child malnutrition — limited progress<br />
Opportunities for education are heavily influenced<br />
by <strong>the</strong> well-being of children before <strong>the</strong>y enter<br />
school. It is an unfortunate fact that, at <strong>the</strong> start<br />
of <strong>the</strong> twenty-first century, <strong>the</strong> twin scourges of<br />
hunger and ill health continue to blight education<br />
on a global scale.<br />
Box <strong>2.</strong>1: Early malnutrition leads to long-term educational damage<br />
Research carried out for this year’s Report strongly reinforces wider<br />
evidence on <strong>the</strong> contribution of malnutrition to educational disadvantage.<br />
Using data from <strong>the</strong> Young Lives Survey, which tracked children in Ethiopia,<br />
India (Andhra Pradesh state), Peru and Viet Nam, <strong>the</strong> study examines <strong>the</strong><br />
relationship between early nutrition and cognitive achievements at age 4 to<br />
5, measured on <strong>the</strong> Peabody Picture Vocabulary Test (PPVT), an international<br />
learning achievement scale. It also looks at <strong>the</strong> relationship between nutrition<br />
at age 7 to 8 and outcomes measured in terms of PPVT scores and<br />
accumulated years of education at age 11 to 12 (for this cohort, Dercon<br />
[2008] presents similar evidence). In both cases, height for age is used as<br />
an indicator of nutritional history and status, standardized using <strong>the</strong> latest<br />
World Health Organization (WHO) growth curve references. Although <strong>the</strong><br />
samples are not nationally representative, <strong>the</strong>y were designed to reflect<br />
cultural, ethnic and geographic differences within each country.<br />
The results are striking. After controlling for an extensive set of child,<br />
parental and household characteristics, and taking into account <strong>the</strong> effect<br />
of community characteristics, <strong>the</strong> results point to a strong association<br />
between nutritional status measured at 6 to 18 months and cognitive<br />
achievement at age 4 to 5. An increase of one standard deviation in early<br />
height for age is associated with an improvement of 4% to 12% of <strong>the</strong> PPVT<br />
standard deviation in <strong>the</strong> Young Lives samples.<br />
Similar findings emerge for <strong>the</strong> older cohort. In this case, an increase<br />
of one standard deviation in nutritional status measured at ages 7 and 8<br />
is associated with a marked increase in school grade attainment that<br />
represents 14% to 20% of <strong>the</strong> grade attainment standard deviation<br />
(about 0.2 to 0.4 additional years of schooling). Given <strong>the</strong> high levels<br />
of stunting for both cohorts in all <strong>the</strong> Young Lives samples, <strong>the</strong> results<br />
underline <strong>the</strong> significant costs imposed by malnutrition on education.<br />
Source: Sanchez (2009).<br />
One way to gauge how children are faring around<br />
<strong>the</strong> world is to look at child mortality rates. While<br />
death rates are falling, <strong>the</strong> world remains far off<br />
track for <strong>the</strong> Millennium Development Goal of a<br />
two-thirds reduction from 1990 levels by 2015.<br />
There were 9.3 million child deaths in 2008. On<br />
current trends <strong>the</strong> millennium goal target will be<br />
missed by a figure equivalent to more than 4 million<br />
additional deaths in 2015. Set against this bad<br />
news is <strong>the</strong> fact that many of <strong>the</strong> world’s poorest<br />
countries, including Ethiopia, Malawi, Mozambique<br />
and <strong>the</strong> United Republic of Tanzania, have cut child<br />
deaths by 40% or more (UNICEF, 2008b).<br />
Child mortality is intimately related to malnutrition.<br />
<strong>Progress</strong> <strong>towards</strong> <strong>the</strong> Millennium Development<br />
Goal target of halving malnutrition has been<br />
painfully slow, with most countries in South Asia<br />
and sub-Saharan Africa off track. It is estimated<br />
that malnutrition is directly implicated in two of<br />
43
0<br />
1<br />
0<br />
CHAPTER 2<br />
2<br />
Education for All Global Monitoring Report<br />
every three deaths of children under age 5. While<br />
<strong>the</strong>re have been some advances <strong>towards</strong> improved<br />
child nutrition, and expanded access to Vitamin A<br />
supplements and iodized salt, achievements fall<br />
far short of <strong>the</strong> <strong>goals</strong> that have been set:<br />
Figure <strong>2.</strong>1: High levels of child stunting are holding back progress in education<br />
Severe and moderate stunting among children under 5, selected countries, 2000–2007 1<br />
Cameroon<br />
Kenya<br />
Uganda<br />
Côte d’Ivoire<br />
Mali<br />
Burkina Faso<br />
Guinea<br />
Benin<br />
C. A. R.<br />
D. R. Congo<br />
Eritrea<br />
Lesotho<br />
Nigeria<br />
Somalia<br />
U. R. Tanzania<br />
Equat. Guinea<br />
Liberia<br />
Zambia<br />
Sierra Leone<br />
Chad<br />
Guinea-Bissau<br />
Mozambique<br />
Comoros<br />
Angola<br />
Rwanda<br />
Malawi<br />
Ethiopia<br />
Madagascar<br />
Niger<br />
Burundi<br />
Djibouti<br />
Mauritania<br />
Sudan<br />
Yemen<br />
Philippines<br />
Myanmar<br />
Viet Nam<br />
Cambodia<br />
DPR Korea<br />
Lao PDR<br />
Timor-Leste<br />
Bangladesh<br />
Pakistan<br />
India<br />
Bhutan<br />
Nepal<br />
Afghanistan<br />
Peru<br />
Guatemala<br />
Sub-Saharan Africa<br />
Arab States<br />
East Asia and <strong>the</strong> Pacific<br />
South and West Asia<br />
Latin America and <strong>the</strong> Caribbean<br />
0 10 20 30 40 50 60<br />
Severe and moderate stunting (%)<br />
Note: Countries included are those in which <strong>the</strong> proportion of stunted children is 30% or more.<br />
1. Data are for <strong>the</strong> most recent year available during <strong>the</strong> period specified.<br />
Source: Annex, Statistical Table 3A.<br />
Childhood stunting. 1 Around one in three<br />
children under age 5 – 178 million in total –<br />
suffers severe or moderate stunting. By <strong>the</strong> time<br />
<strong>the</strong>se children enter school, malnutrition will<br />
have diminished <strong>the</strong>ir potential for learning<br />
– a disadvantage <strong>the</strong>y will carry into adulthood.<br />
Apart from its damaging consequences for<br />
individuals, malnutrition in early childhood<br />
inevitably erodes <strong>the</strong> benefits of investment in<br />
education. The highest regional rates of stunting<br />
are found in central and eastern Africa and<br />
South Asia. Of <strong>the</strong> forty-nine countries where<br />
stunting prevalence rates are in excess of 30%,<br />
thirty are in sub-Saharan Africa (Figure <strong>2.</strong>1).<br />
Low birth weight. Recent international estimates<br />
suggest that about 19 million infants – 14% of all<br />
newborns – are delivered with low birth weight<br />
(UNICEF, 2008b). More than half of <strong>the</strong>se births<br />
take place in South Asia: over one in four of <strong>the</strong><br />
region’s children are delivered with low birth<br />
weight (Figure <strong>2.</strong>2). These children face a<br />
heightened risk of early mortality: low birth<br />
weight is an underlying factor in 60% to 80%<br />
of deaths in <strong>the</strong> first month. They also face<br />
longer-term risks of disadvantage in health<br />
and education. Low birth weight is strongly<br />
associated with loss of years in school and<br />
poorer cognitive skills (Victoria et al., 2008),<br />
which undermine <strong>the</strong> potential benefits of<br />
improved access to secondary education. Many<br />
of <strong>the</strong> 8.3 million Indian children born with low<br />
birth weight will carry a burden of disadvantage<br />
with <strong>the</strong>m into primary school. Moreover,<br />
almost half of all children under age 3 in India<br />
are underweight for <strong>the</strong>ir age, pointing to far<br />
deeper nutritional deficits.<br />
Micronutrient deficiency. Early cognitive<br />
development can be severely impaired by<br />
micronutrient deficiencies. It is estimated that<br />
one-third of all pre-school children is affected<br />
by iodine deficiency, a condition associated with<br />
a loss of ten to fifteen points on IQ tests even<br />
in moderate forms. A similar proportion of<br />
children is affected by Vitamin A deficiency,<br />
a major cause of blindness, ill health and poor<br />
concentration (Victoria et al., 2008).<br />
The factors behind malnutrition vary across<br />
countries. Poverty, social inequalities and livelihood<br />
insecurity all play a role. National wealth is often a<br />
1. Stunting, or low height for age, is caused by long-term insufficiency of<br />
nutrient intake and frequent infections. It generally occurs before <strong>the</strong> age<br />
of 2 and <strong>the</strong> effects are largely irreversible.<br />
44
PROGRESS TOWARDS THE <strong>EFA</strong> GOALS<br />
Early childhood care and education<br />
poor guide to deprivation. Guatemala is not one<br />
of <strong>the</strong> world’s poorest countries, but it has one<br />
of <strong>the</strong> highest levels of child stunting. Almost half<br />
of <strong>the</strong> country’s children are malnourished – and<br />
in parts of rural Guatemala, where <strong>the</strong> population<br />
is largely Mayan, <strong>the</strong> figure reaches 80%. Over<br />
<strong>the</strong> past two years, drought and high food prices<br />
have made things worse. But <strong>the</strong> underlying<br />
problem is extreme inequality in wealth<br />
distribution, allied to <strong>the</strong> failure of government<br />
to mobilize resources for social protection.<br />
Nutritional indicators have been deteriorating<br />
in many countries over <strong>the</strong> past two years.<br />
World agricultural prices rose sharply in <strong>the</strong><br />
two years to 2008, affecting all major traded<br />
food staples. While prices have since fallen, <strong>the</strong>y<br />
have stabilized at levels far higher than <strong>the</strong>y were<br />
before 2007. Effects at <strong>the</strong> national level have<br />
varied considerably, depending on <strong>the</strong> incidence<br />
of poverty and dependence on food imports.<br />
However, higher food prices have almost certainly<br />
stalled global progress in cutting malnutrition.<br />
Recent estimates from <strong>the</strong> Food and Agricultural<br />
Organization of <strong>the</strong> United Nations suggest that<br />
<strong>the</strong> number of malnourished people in <strong>the</strong> world<br />
increased from 848 million in 2005 to 963 million<br />
in 2008, largely because of rising food prices<br />
(FAO, 2008). Ano<strong>the</strong>r 44 million people may<br />
have been pushed into malnutrition during 2008<br />
(Commission on Growth and Development, 2008).<br />
The damage inflicted by higher food prices has<br />
been unevenly spread. Outcomes depend on<br />
whe<strong>the</strong>r households are net sellers or buyers<br />
of food, on access to savings or credit and on<br />
current nutritional status. For people living below<br />
<strong>the</strong> international poverty threshold of $1.25 a day,<br />
many of whom spend 50% to 70% of <strong>the</strong>ir income<br />
on food, higher food prices pose a stark choice:<br />
eat less or decrease spending in o<strong>the</strong>r areas<br />
(von Braun, 2008; World Bank, 2008a). Landless<br />
rural households, low-income urban groups and<br />
female-headed households have been among<br />
<strong>the</strong> hardest hit. Many have cut already inadequate<br />
diets and switched from protein-rich foods to<br />
cheaper coarse cereals (Hauenstein Swan et al.,<br />
2009; von Braun, 2008). In Bangladesh, where<br />
rice and wheat prices almost doubled in 2007,<br />
it is estimated that a 50% increase in <strong>the</strong> price<br />
of food staples increases <strong>the</strong> prevalence of iron<br />
deficiency among women and children by 25%<br />
(Bouis, 2008).<br />
Figure <strong>2.</strong>2: Low birth weight sets <strong>the</strong> scene for lifelong disadvantage<br />
Average % of infants with low birth weight, selected regions, 2000–2007 1<br />
% of infants with low birth weight<br />
30<br />
25<br />
20<br />
15<br />
10<br />
5<br />
0<br />
East Asia/<br />
Pacific<br />
Latin America/<br />
Caribbean<br />
Middle East/<br />
North Africa<br />
Sub-Saharan<br />
Africa<br />
Notes: Regions presented are those used by UNICEF, which differ to some extent from<br />
<strong>the</strong> <strong>EFA</strong> regions. Low birth weight is defined as less than <strong>2.</strong>5 kilograms.<br />
1. Data are for <strong>the</strong> most recent year available during <strong>the</strong> period specified.<br />
Source: UNICEF (2008b).<br />
Short-term distress in <strong>the</strong> form of rising malnutrition<br />
will have long-term consequences for education.<br />
As more children experience episodes of<br />
malnutrition in early childhood <strong>the</strong>ir prospects for<br />
learning will be diminished. At <strong>the</strong> same time, rising<br />
pressure on household budgets will have wider<br />
consequences as poor parents are forced to adjust<br />
household budgets. There is evidence from<br />
Bangladesh, Jamaica and Kenya of households<br />
cutting education spending to accommodate higher<br />
food prices (Hossain et al., 2009; World Bank, 2008e).<br />
High food prices have not been <strong>the</strong> only cause<br />
of rising malnutrition. In nor<strong>the</strong>rn Sri Lanka,<br />
300,000 people were displaced by conflict in 2009.<br />
It is estimated that about 13% of <strong>the</strong> displaced<br />
were children under 5. A survey covering six of<br />
<strong>the</strong> thirteen camps for displaced people found<br />
that one in four children was malnourished and<br />
one in three was moderately or severely stunted<br />
(Jayatissa, 2009). Failure to adequately protect<br />
<strong>the</strong>se children raises wider issues of humanitarian<br />
concern. But <strong>the</strong> consequences for education will<br />
also be severe.<br />
South<br />
Asia<br />
Maternal health — critical, but neglected<br />
The health of newborn children – critical for later<br />
educational chances – is intimately related to<br />
<strong>the</strong> health of <strong>the</strong>ir mo<strong>the</strong>rs. Women who are<br />
malnourished and suffering from micronutrient<br />
deficiency face far higher risks during pregnancy<br />
and childbirth, and are more likely to give birth to<br />
underweight babies. Restricted growth of <strong>the</strong> foetus<br />
during pregnancy is a major risk factor for maternal<br />
health and child survival – and is likely to lead to<br />
future educational disadvantage.<br />
Short-term<br />
distress in <strong>the</strong><br />
form of rising<br />
malnutrition will<br />
have long-term<br />
consequences<br />
for education<br />
45
0<br />
1<br />
0<br />
CHAPTER 2<br />
2<br />
Education for All Global Monitoring Report<br />
More than one<br />
in three births<br />
in developing<br />
countries take<br />
place without<br />
a skilled birth<br />
attendant<br />
Unsafe pregnancy and childbirth exact an immense<br />
human toll. An estimated half a million women lose<br />
<strong>the</strong>ir lives each year from pregnancy and birthrelated<br />
causes – and for every death ano<strong>the</strong>r thirty<br />
women suffer severe long-term injuries. Almost all<br />
<strong>the</strong>se deaths and injuries could be averted through<br />
access to antenatal care, skilled attendance during<br />
pregnancy and emergency obstetric care. Poor<br />
maternal health, inadequate nutrition and limited<br />
access to care are also implicated in <strong>the</strong> deaths of<br />
<strong>the</strong> 4 million newborns who do not survive <strong>the</strong>ir first<br />
month (Lawn et al., 2006). Two conditions – birth<br />
asphyxia and sepsis with pneumonia – cause nearly<br />
60% of <strong>the</strong>se deaths. The real cause, however, is<br />
limited access to skilled health professionals at birth<br />
and a failure to prioritize maternal and child health<br />
in national policy (Thea and Qazi, 2008).<br />
This ‘needless human tragedy’ (UNICEF, 2008b)<br />
goes beyond maternal and child mortality and<br />
immediate health risks. Undernutrition in utero, low<br />
birth weight and heightened vulnerability to sickness<br />
after birth can cause direct structural damage to <strong>the</strong><br />
brain that impairs cognitive development and locks<br />
children into a future of underachievement. Wider<br />
health risks during pregnancy and childbirth also<br />
have consequences for education:<br />
Maternal iodine deficiency in pregnancy causes<br />
an estimated 38 million children to be born<br />
each year facing risks of mental impairment<br />
and congenital abnormalities (UNICEF, 2007b).<br />
Anaemia, which affects around half of all<br />
pregnant women, heightens <strong>the</strong> risks associated<br />
with pregnancy and reduces prospects for child<br />
survival (UNICEF, 2008b).<br />
Around half of <strong>the</strong> stunting observed in infants<br />
occurs in <strong>the</strong> uterus and <strong>the</strong> remainder during<br />
<strong>the</strong> first two years of life (Victoria et al., 2008).<br />
of sexual and reproductive health, early marriage<br />
and poor access to information all contribute.<br />
Providing quality health care<br />
Inadequate maternal and child health care is<br />
holding back advances in education. <strong>Progress</strong><br />
<strong>towards</strong> <strong>the</strong> Millennium Development Goal target<br />
of a three-quarters reduction in maternal deaths<br />
by 2015 has been close to zero. Meanwhile, limited<br />
improvements in survival in <strong>the</strong> first month of life<br />
are preventing progress <strong>towards</strong> <strong>the</strong> target on<br />
child mortality.<br />
One of <strong>the</strong> most urgent priorities is providing<br />
quality health services. Intrauterine growth<br />
restrictions and maternal micronutrient deficiencies<br />
can be readily detected through antenatal care and<br />
treated at little cost. Access to facilities providing<br />
skilled attendance at birth, emergency obstetric<br />
care and post-natal care could prevent over 80%<br />
of maternal and neonatal deaths, and set children<br />
on course for a healthy future (UNICEF, 2008b).<br />
Yet more than one in three births in developing<br />
countries take place without a skilled birth<br />
attendant. Skilled attendance rates are lowest<br />
in South Asia (41%) and sub-Saharan Africa (45%)<br />
(UNICEF, 2008b). Not coincidentally, <strong>the</strong>se are <strong>the</strong><br />
regions with <strong>the</strong> highest maternal mortality rates.<br />
Poverty undermines maternal health in several<br />
ways. It heightens exposure to threats such as<br />
malnutrition and infectious disease. It can also<br />
reduce access to vital health care, ei<strong>the</strong>r because<br />
care is lacking or because it is unaffordable to<br />
<strong>the</strong> very poor. The poverty risk factor is graphically<br />
captured in a UNICEF review of evidence from<br />
fifty household surveys that found that neonatal<br />
mortality rates among <strong>the</strong> poorest 20% were<br />
typically 20% to 50% higher than for <strong>the</strong> wealthiest<br />
quintile (UNICEF, 2008b). These health inequalities<br />
fuel education disparities later in life.<br />
The absence of skilled health personnel during<br />
delivery costs lives and leaves children facing<br />
lifetime disadvantages. Asphyxia contributes<br />
to around one-quarter of newborn deaths<br />
and results in about 1 million children suffering<br />
learning difficulties and disabilities such as<br />
cerebral palsy (WHO, 2005).<br />
Access to health provision is not <strong>the</strong> only barrier to<br />
improved child and maternal care. Many underlying<br />
problems associated with pregnancy and childbirth<br />
reflect a failure to protect women’s rights. Low<br />
status, heavy workloads, a lack of voice in matters<br />
The poorest mo<strong>the</strong>rs and children are often<br />
underserved along <strong>the</strong> whole continuum of care.<br />
In South Asia, being poor reduces by a factor of<br />
five <strong>the</strong> probability of having a skilled health person<br />
in attendance during delivery. Even controlling for<br />
poverty, indigenous people and ethnic minorities are<br />
often severely disadvantaged. In Guatemala, nonindigenous<br />
women are more than twice as likely as<br />
<strong>the</strong>ir indigenous counterparts to give birth in a<br />
public health facility with trained personnel. The<br />
factors excluding poor and vulnerable households<br />
from basic maternal and child health services vary<br />
by country but include cost, distance and <strong>the</strong> poor<br />
46
PROGRESS TOWARDS THE <strong>EFA</strong> GOALS<br />
Early childhood care and education<br />
quality of public care. Whatever <strong>the</strong> underlying<br />
causes of health disadvantage, <strong>the</strong> consequences<br />
include educational disadvantage later in life.<br />
The strength of <strong>the</strong> links between maternal health<br />
and education is often overlooked. Some of those<br />
links are very direct. Young women of middle to<br />
higher secondary school age, 15 to 19, account<br />
for one in seven deaths related to pregnancy and<br />
childbirth (WHO and UNICEF, 2003). The younger<br />
<strong>the</strong> age at pregnancy, <strong>the</strong> greater <strong>the</strong> health risks<br />
for mo<strong>the</strong>r and child. Being born to a mo<strong>the</strong>r<br />
under 18 increases <strong>the</strong> risk of infant mortality by<br />
60% and <strong>the</strong> children who survive are more likely<br />
to suffer from low birth weight, undernutrition and<br />
delayed cognitive development (Lawn et al., 2006;<br />
UNICEF, 2008b; WHO, 2005).<br />
Empowerment through education is one of <strong>the</strong><br />
strongest antidotes to maternal risk. Women with<br />
higher levels of education are more likely to delay<br />
and space out pregnancies, and to seek health<br />
care support. In South and West Asia, almost half<br />
of women with no education give birth without<br />
having received antenatal care, compared with<br />
nearly 10% for women with secondary education<br />
(Figure <strong>2.</strong>3). The ‘education advantage’ is even<br />
more pronounced when it comes to having a<br />
skilled birth attendant present during delivery.<br />
In Burkina Faso, mo<strong>the</strong>rs with primary education<br />
are twice as likely to have a skilled attendant<br />
present as those with no education, and women<br />
with secondary education are almost four times<br />
as likely. While <strong>the</strong> association between education<br />
and improved maternal and child indicators is<br />
not evidence of causation, <strong>the</strong> strength of <strong>the</strong><br />
association points to <strong>the</strong> importance of <strong>the</strong><br />
two-way link between investment in health<br />
and investment in education.<br />
Rapid progress is possible<br />
Slow progress <strong>towards</strong> international <strong>goals</strong> in<br />
areas such as maternal health, child nutrition<br />
and survival is sometimes viewed as evidence<br />
of <strong>the</strong> cost and complexity of effective measures.<br />
That assessment is flawed. Without understating<br />
<strong>the</strong> extent of <strong>the</strong> challenges, <strong>the</strong>re is compelling<br />
evidence that rapid progress is possible.<br />
Cost-effective measures that work include<br />
complementary feeding and vitamin<br />
supplementation, a continuum of care during<br />
pregnancy and childbirth, immunization and wider<br />
strategies to tackle killer diseases such as malaria<br />
and pneumonia (Black et al., 2008). To make such<br />
Figure <strong>2.</strong>3: Educated mo<strong>the</strong>rs have better access to antenatal care<br />
Children under age 3 born without antenatal care, by maternal education,<br />
South and West Asia and sub-Saharan Africa, circa 2005<br />
% of children under 3 born<br />
without antenatal care<br />
50<br />
40<br />
30<br />
20<br />
10<br />
0<br />
South and West Asia<br />
Sub-Saharan Africa<br />
Notes: Figures presented are population weighted averages. The sample of countries used to estimate<br />
<strong>the</strong> South and West Asia average represents more than 90% of <strong>the</strong> total population of <strong>the</strong> region and<br />
<strong>the</strong> sample used to estimate <strong>the</strong> sub-Saharan Africa average more than 80%.<br />
Source: Macro International Inc. (2009).<br />
interventions available, countries need affordable<br />
and accessible health systems, allied to wider<br />
measures for targeting vulnerable groups and<br />
combating malnutrition. Bad news tends to<br />
dominate <strong>the</strong> headlines, but <strong>the</strong>re is positive<br />
news too:<br />
Scaling up maternal and child health services.<br />
Experience from Bangladesh and Nepal shows<br />
that maternal and child survival can be improved<br />
in low-income settings by increasing access to<br />
skilled attendants, antenatal care and family<br />
planning advice (DFID, 2008b). In <strong>the</strong> United<br />
Republic of Tanzania, health spending has been<br />
increased and focused on diseases that affect<br />
<strong>the</strong> poorest districts. Coverage of key maternal<br />
and child health services has expanded, with<br />
a marked increase in <strong>the</strong> recruitment of<br />
community-based midwives and health workers.<br />
Child nutrition is improving, as reflected in a 40%<br />
decline in child mortality between 2000 and 2004<br />
(Masanja et al., 2008).<br />
Achieving results through aid. The GAVI Alliance<br />
(formerly Global Alliance for Vaccines and<br />
Immunisation), formed in 2000, has supported<br />
<strong>the</strong> immunization of 213 million children, saving<br />
an estimated 3.4 million lives. From 2000 to 2006,<br />
deaths from measles in Africa fell by 90% (GAVI<br />
Alliance, 2009a). International partnerships on<br />
HIV and AIDS have increased <strong>the</strong> share of HIVpositive<br />
pregnant women receiving antiretroviral<br />
<strong>the</strong>rapy from 15% to 33%, helping prevent<br />
transmission to children (Global Fund, 2008a).<br />
No education<br />
Primary<br />
Secondary or higher<br />
Regional average<br />
The links between<br />
maternal health<br />
and education are<br />
often overlooked<br />
47
0<br />
1<br />
0<br />
CHAPTER 2<br />
2<br />
Education for All Global Monitoring Report<br />
Removing cost barriers to vital maternal and<br />
child health services. Inability to pay is a major<br />
factor limiting access to basic maternal and<br />
child health services (Gilson and McIntyre, 2005;<br />
Pearson, 2004). Recent experience from<br />
countries including Ghana, Nepal, Senegal,<br />
Uganda and Zambia provides evidence that<br />
eliminating charges for basic health services<br />
is often followed by a rapid rise in <strong>the</strong> uptake<br />
of services, especially by <strong>the</strong> poor (Deininger<br />
and Mpuga, 2005; Yates, 2009) (Box <strong>2.</strong>2).<br />
Box <strong>2.</strong>2: Removing cost barriers to maternal and child health services<br />
The removal of cost barriers has played a critical role in opening up<br />
opportunities for education. Yet cost barriers to maternal and child health<br />
care remain largely intact, with damaging consequences for health and<br />
education. The inability of poor households to afford health costs often<br />
leads to fatal delays in treatment or to <strong>the</strong>ir wholesale exclusion from<br />
formal health care. Research in countries as diverse as Chad, India and<br />
Sudan points to cost as a major factor restricting <strong>the</strong> use by poor women<br />
of maternal and child health services.<br />
As in education, <strong>the</strong> scale of <strong>the</strong> barriers that fees create for <strong>the</strong> very poor<br />
is often revealed when fees are removed. When Uganda withdrew health<br />
fees in 2001, <strong>the</strong> number of outpatients visiting hospitals went <strong>the</strong> same<br />
way as school enrolments after fees were withdrawn several years earlier:<br />
attendance rates doubled in less than a year, with <strong>the</strong> poorest groups<br />
recording <strong>the</strong> highest increases. After Burundi removed all health fees for<br />
pregnant women and children in 2006, average monthly births in hospitals<br />
promptly rose by 61%. In Nepal, <strong>the</strong> removal of fees, allied to increased<br />
investment in <strong>the</strong> recruitment and training of community health workers,<br />
has also increased access to care.<br />
Many governments across Africa and beyond are reconsidering health fees.<br />
There is compelling evidence that charging for basic services is ineffective,<br />
inefficient — fees generate only 5% to 6% of health sector revenue — and<br />
inequitable. In <strong>the</strong> past two years, Burundi, Ghana, Kenya, Lesotho, Liberia,<br />
<strong>the</strong> Niger, Senegal and Zambia have abolished fees in key areas. Most major<br />
development agencies, including <strong>the</strong> WHO and <strong>the</strong> World Bank, have also<br />
adopted clear positions against fees. Meanwhile, some donors have provided<br />
additional aid to countries that have removed fees, including France (for <strong>the</strong><br />
Niger) and <strong>the</strong> United Kingdom (for Burundi, Ghana, Nepal and Zambia) .<br />
Eliminating user fees on maternal and child health care should be seen as<br />
an urgent priority. However, it is not a stand-alone strategy. Rapid increases<br />
in demand for already overstretched services can lead to deterioration in<br />
quality and long queues for treatment — outcomes that undermined <strong>the</strong><br />
benefits of free maternal health care in Ghana. As in <strong>the</strong> education sector,<br />
making access more affordable should be seen as one element in a broader<br />
package of policy reforms. Increased investment to streng<strong>the</strong>n health<br />
systems, greater equity in public spending and improved governance are all<br />
important. And <strong>the</strong>re is no substitute for recruiting and training more health<br />
workers. The shortage of trained health workers is estimated at over<br />
1 million in sub-Saharan Africa alone.<br />
Sources: Yates (2009); Nabyonga et al. (2005); Batungwanayo and Reyntjens (2006);<br />
Cohen and Dupas (2007); Gilson and McIntyre (2005); Witter et al. (2009).<br />
Putting nutrition at <strong>the</strong> centre of <strong>the</strong> poverty<br />
reduction agenda. Over <strong>the</strong> past two decades<br />
Viet Nam has achieved some of <strong>the</strong> world’s most<br />
rapid reductions in child malnutrition. Its<br />
National Target Programme has focused on<br />
<strong>the</strong> 2,374 communes with <strong>the</strong> highest rates of<br />
poverty and child malnutrition. Supplementary<br />
feeding programmes and maternal and child<br />
health care have figured prominently. National<br />
Institute of Nutrition surveys indicate that<br />
stunting rates fell by one-quarter from 1999<br />
to 2005 (Khan et al., 2008). In Brazil, <strong>the</strong> Zero<br />
Hunger programme, a concerted drive to combat<br />
malnutrition, contributed to a fall in malnutrition<br />
rates in <strong>the</strong> north-east, <strong>the</strong> poorest region, from<br />
18% to 16% in <strong>the</strong> decade to 2005 (Ruel, 2008).<br />
Implementing effective social protection.<br />
Programmes that provide parents with income,<br />
services and incentives can help combat early<br />
childhood deprivation. Large-scale programmes<br />
such as Bolsa Familia in Brazil and<br />
Oportunidades in Mexico directly link cash<br />
transfers to participation in child nutrition<br />
programmes – and both have reduced stunting<br />
and improved cognitive development (Fiszbein<br />
et al., 2009) (Box <strong>2.</strong>3).<br />
The artificial separation of health and education<br />
in public policy is particularly damaging for early<br />
childhood provision. Education planners often<br />
measure progress in primary education by<br />
numbers entering classrooms, pupil/teacher ratios<br />
and <strong>the</strong> quality of school infrastructure. There is<br />
a widespread view that children’s nutritional and<br />
health status before school age is a health policy<br />
matter. This silo mentality produces a distorted<br />
picture of policy priorities. Millions of children enter<br />
school having suffered irreparable damage to <strong>the</strong>ir<br />
learning potential as a result of malnutrition and<br />
micronutrient deficiencies. Poor maternal health<br />
and risks during pregnancy and childbirth are<br />
important contributory factors. The upshot of public<br />
policy failure in <strong>the</strong> areas of nutrition and maternal<br />
and child health care is not just unnecessary<br />
human suffering, but also <strong>the</strong> erosion of benefits<br />
associated with investment in education and<br />
progress in getting children into school.<br />
Early childhood education<br />
programmes — a mixed record<br />
Learning starts in <strong>the</strong> home, as children manipulate<br />
objects and materials, explore <strong>the</strong> world around<br />
<strong>the</strong>m and develop language. During <strong>the</strong> crucial<br />
48
PROGRESS TOWARDS THE <strong>EFA</strong> GOALS<br />
Early childhood care and education<br />
formative years, children develop <strong>the</strong> cognitive and<br />
wider skills that will prepare <strong>the</strong>m for school. Pupils<br />
from disadvantaged backgrounds often enter school<br />
carrying a legacy of disadvantage in many areas,<br />
including lower levels of communication, language<br />
and literacy skills. The effects of growing up in a<br />
disadvantaged home are seldom reversed later in<br />
life – in fact, <strong>the</strong> gaps widen as children progress<br />
through <strong>the</strong>ir school years (UNESCO, 2005).<br />
Narrowing <strong>the</strong> opportunity divide<br />
An early start in education is particularly important<br />
for children from disadvantaged families. Poverty,<br />
low levels of parental education or speaking a<br />
minority language at home are among <strong>the</strong> most<br />
powerful transmitters of disadvantage across<br />
generations. Good-quality early childhood provision<br />
can cut <strong>the</strong> transmission lines.<br />
By <strong>the</strong> time children enter school, disparities in<br />
language skills linked to income and o<strong>the</strong>r factors<br />
are often so marked that children can never catch<br />
up. Evidence from <strong>the</strong> United States demonstrates<br />
that test scores at <strong>the</strong> age of 18 are predictable by<br />
age 5 (Heckman, 2008). Research in Ecuador<br />
indicates that differences in vocabulary test scores<br />
between children from different wealth groups are<br />
limited at age 3 but that by age 5 <strong>the</strong> gap is far too<br />
wide to be closed in later school years (Paxson and<br />
Schady, 2005b) (Figure <strong>2.</strong>4). In <strong>the</strong> United Kingdom,<br />
longitudinal studies show that test scores at<br />
22 months are a strong predictor for educational<br />
qualifications at 22 years (Feinstein, 2003).<br />
Moreover, studies have shown that children from<br />
low socio-economic backgrounds but with high<br />
cognitive ability scores at 22 months are overtaken<br />
by children with lower scores from more affluent<br />
families between <strong>the</strong> ages of 5 and 10 years.<br />
Income differences are not <strong>the</strong> only source of<br />
advantage and disadvantage. Parental education,<br />
ethnicity and home language all exercise a strong<br />
influence on early childhood test scores and<br />
subsequent educational achievement (Brooks-Gunn<br />
and Markman, 2005; EACEA, 2009; Leseman and<br />
van Tuijil, 2005). The issue of language is especially<br />
salient. There is strong evidence from <strong>the</strong><br />
Organisation for Economic Co-operation and<br />
Development (OECD) that having a home language<br />
that is different from <strong>the</strong> language used in school<br />
significantly decreases achievement for immigrant<br />
children in both primary and secondary school<br />
(Christensen and Stanat, 2007; Schnepf, 2004).<br />
Remedial action often meets with limited success.<br />
In Norway, 20% of migrant students placed in<br />
Box <strong>2.</strong>3: Cash transfer in Nicaragua — overcoming cognitive deficits<br />
In many developing countries, serious delays in children’s cognitive<br />
development damage <strong>the</strong>ir prospects in school and <strong>the</strong>ir productivity<br />
as adults. Understanding <strong>the</strong> causes of cognitive deficits and developing<br />
ways to reduce <strong>the</strong>m are critical policy priorities.<br />
The Atención a Crisis programme in Nicaragua demonstrates <strong>the</strong> potential<br />
benefits of early intervention. Significant cash payments, representing on<br />
average about 15% of household income, were made every two months to<br />
women in poor rural households. To be eligible, parents had to take children<br />
of pre-school age for regular visits to health centres, where <strong>the</strong>y were<br />
weighed and received vaccinations and food supplements.<br />
This pilot programme, carried out during 2005 and 2006, included<br />
a careful evaluation. Results indicated that <strong>the</strong> programme improved<br />
several dimensions of child development:<br />
After only nine months in <strong>the</strong> programme, children aged 3 to 4 years<br />
had made up 1.5 months’ delayed personal-social and language<br />
development on one set of test scores, rising to <strong>2.</strong>4 months for<br />
children aged 5 to 6 years.<br />
Participating households were found to have higher values for signs<br />
of parental stimulation, including <strong>the</strong> availability of books, paper<br />
and pencils, and <strong>the</strong> likelihood of parents reading to children.<br />
Overall food expenditures increased among treated households,<br />
especially on nutrient-rich foods.<br />
Wide-ranging preventive health benefits were identified. Participating<br />
children were more likely to have had a growth check-up, received<br />
vitamin and iron supplements, and to have been treated with de-worming<br />
drugs. The reported health status of mo<strong>the</strong>rs had also improved.<br />
Source: Macours et al. (2008).<br />
special language training groups on entering<br />
school never leave <strong>the</strong>m and in Switzerland most<br />
migrant children not deemed equipped to enter<br />
mainstream classes are still in such groups after<br />
two years (Field et al., 2007). Moreover, evidence<br />
from several countries shows that catching up<br />
through special classes often requires students<br />
to miss <strong>the</strong> normal curriculum (Karsten, 2006).<br />
Early childhood education can play an important role<br />
in offsetting social, economic and language-based<br />
disadvantage. Evidence from around <strong>the</strong> world<br />
indicates that high-quality early care is good<br />
for all children, but particularly for those from<br />
disadvantaged backgrounds. The following<br />
are among <strong>the</strong> findings to emerge from a range<br />
of rigorous evaluations:<br />
The Head Start Impact Study in <strong>the</strong> United States<br />
randomly evaluated about 5,000 3- and 4-yearolds.<br />
It found small to moderate statistically<br />
High-quality early<br />
care is particularly<br />
important for<br />
children from<br />
disadvantaged<br />
backgrounds<br />
49
0<br />
1<br />
0<br />
CHAPTER 2<br />
2<br />
Education for All Global Monitoring Report<br />
Figure <strong>2.</strong>4: Wealth-based gaps in learning begin early and widen over time<br />
Test scores across ages for <strong>the</strong> poorest and <strong>the</strong> fourth deciles in Ecuador, 2003–2004<br />
Standardized test scores<br />
110<br />
100<br />
90<br />
80<br />
70<br />
60<br />
50<br />
36 38 40 42 44 46 48 50 52 54 56 58 60 62 64 66 68 70<br />
3-year-olds 4-year-olds 5-year-olds<br />
Age in months<br />
4th decile<br />
1st (poorest) decile<br />
Notes: The test scores used are from <strong>the</strong> Test de Vocabulario en Imágenes Peabody, <strong>the</strong> Spanish version<br />
of <strong>the</strong> Peabody Picture Vocabulary Test. The figure presented here, a smoo<strong>the</strong>d version of <strong>the</strong> original figure<br />
(which appears in <strong>the</strong> source document), has also been reproduced elsewhere (e.g. Fiszbein et al., 2009,<br />
and World Bank, 2006j).<br />
Source: Paxson and Schady (2005b).<br />
significant increases in four key cognitive scores,<br />
including pre-reading, pre-writing, literacy skills<br />
and vocabulary. While Head Start children scored<br />
below average for all children, reflecting racial<br />
and social background factors, <strong>the</strong> programme<br />
halved <strong>the</strong> achievement gap that would have been<br />
expected in its absence (US Department of Health<br />
and Human Services, 2005). 2<br />
While <strong>the</strong>se findings relate to developed countries,<br />
<strong>the</strong>re is also evidence from developing countries<br />
that effective early childhood care and education<br />
can both raise learning achievements and narrow<br />
disparities. That evidence was extensively reviewed<br />
in <strong>the</strong> <strong>EFA</strong> Global Monitoring Report 2007. While<br />
<strong>the</strong> precise channels of influence are a subject<br />
of debate, good-quality early childhood provision<br />
clearly has <strong>the</strong> potential to weaken <strong>the</strong> influence<br />
of parental factors on later education achievement.<br />
Pre-primary education —<br />
slow and unequal expansion<br />
‘Pre-primary’ is an umbrella term covering a<br />
wide range of providers and programmes, mostly<br />
for children aged 3 and above. Countries differ<br />
enormously in <strong>the</strong> mix of public and private<br />
provision, and in financing arrangements and<br />
governance. As in o<strong>the</strong>r areas of education, data on<br />
coverage say little about quality, but high-quality<br />
programmes tend to start early, be based in<br />
centres, have a critical mass of trained teachers<br />
and involve parents (UNICEF, 2008b).<br />
Participation in pre-primary education has been<br />
steadily increasing. Some 140 million children were<br />
enrolled in pre-school programmes worldwide<br />
in 2007, up from 113 million in 1999. The gross<br />
enrolment ratio (GER) climbed from 33% to 41%<br />
over <strong>the</strong> same period (Table <strong>2.</strong>1). Increases have<br />
been most pronounced in sub-Saharan Africa, and<br />
South and West Asia, albeit from a low base. One<br />
in seven children in sub-Saharan Africa is enrolled<br />
in an early childhood programme, compared wih<br />
one in three for all developing countries.<br />
<strong>2.</strong> In 2005-2006, 24% of<br />
children from <strong>the</strong> poorest<br />
20% of United States<br />
households were in<br />
centre-based Head Start<br />
programmes, compared<br />
with 1% of children from<br />
<strong>the</strong> wealthiest 20%.<br />
Evaluations of earlier pilot<br />
childcare programmes –<br />
such as <strong>the</strong> North<br />
Carolina Abecedarian<br />
Project and Perry<br />
Preschool Program –<br />
have also recorded wideranging<br />
benefits<br />
associated with preschool,<br />
extending from<br />
primary education to<br />
college attendance,<br />
employment, wages and<br />
crime reduction<br />
(Campbell et al., 2008;<br />
Karoly et al., 2005;<br />
UNESCO, 2008a;<br />
Schweinhart et al., 2005).<br />
Observed effects were<br />
strongest for poor<br />
children and children<br />
whose parents had little<br />
education.<br />
Attending <strong>the</strong> French pre-primary education<br />
system (école maternelle) increases class<br />
retention of low-income and immigrant children<br />
in primary school by 9% to 17%, with wider<br />
reported benefits for literacy and numeracy<br />
(Nusche, 2009).<br />
Early childhood care can help overcome<br />
language-based disadvantage and <strong>the</strong> problems<br />
faced by children of migrants (Cunha et al., 2005).<br />
In <strong>the</strong> Ne<strong>the</strong>rlands, children of Turkish and<br />
Moroccan immigrants who spent two years in<br />
kindergarten halved <strong>the</strong> average test score gap<br />
from <strong>the</strong> national average (Leseman, 2002).<br />
In New Zealand, 12-year-olds who had participated<br />
in high-quality early education performed<br />
better in reading and ma<strong>the</strong>matics, after<br />
controlling for household income (UNICEF, 2008b).<br />
Looking beyond <strong>the</strong> regional data reveals a diverse<br />
array of country experiences. Among <strong>the</strong> countries<br />
for which data are available, seventeen states in<br />
sub-Saharan Africa have coverage rates of less<br />
than 10%. In <strong>the</strong> Arab States, levels of pre-primary<br />
coverage are far lower than average income might<br />
seem to indicate: out of nineteen countries with<br />
data for 2007, fourteen have GERs below 50%. Egypt<br />
and Saudi Arabia have lower levels of coverage than<br />
some far poorer countries, including Nepal and <strong>the</strong><br />
United Republic of Tanzania. Indeed, sub-Saharan<br />
Africa has increased pre-primary enrolment at<br />
three times <strong>the</strong> rate of <strong>the</strong> Arab States, with GERs<br />
rising by more than 20% since 1999 in several<br />
countries, including Burundi, Liberia and Senegal<br />
(Annex, Statistical Table 3A). The Arab States region<br />
also remains <strong>the</strong> only one with significant gender<br />
disparity at early childhood level: just nine girls are<br />
enrolled for every ten boys.<br />
50
PROGRESS TOWARDS THE <strong>EFA</strong> GOALS<br />
Early childhood care and education<br />
Developed countries vary considerably in <strong>the</strong>ir<br />
blend of crèches, pre-primary schools, centrebased<br />
day care and home support. They also differ<br />
in <strong>the</strong> balance between public and private financing<br />
and in <strong>the</strong> age groups that programmes reach.<br />
Some countries, notably in <strong>the</strong> Nordic area, have<br />
high rates of coverage for children under 3, though<br />
most early childhood programmes in OECD<br />
countries cover ages 4 to 6. The duration of preprimary<br />
education varies from one to four years.<br />
In Sweden, full-time free early childhood education<br />
is available to all children, from age 3, for eleven<br />
months of <strong>the</strong> year; in <strong>the</strong> United Kingdom, free<br />
provision is available part time for 3- and 4-yearolds<br />
(EACEA, 2009). Most European Union countries<br />
provide two years of free pre-school. 3 By contrast,<br />
in <strong>the</strong> United States, <strong>the</strong>re is no statutory right to<br />
pre-school before age 5, though about 60% of<br />
children in <strong>the</strong> pre-school age group were enrolled<br />
in 2007.<br />
Differences within countries are often as marked<br />
as differences across borders. This is especially<br />
true of countries that combine high levels of<br />
decentralization with subnational autonomy. The<br />
United States provides a striking example. Virtually<br />
every 4-year-old in Oklahoma can start school at<br />
age 4. In eight o<strong>the</strong>r states – including Florida,<br />
South Carolina and Texas – more than half of<br />
4-year-olds attend a public pre-school programme.<br />
At <strong>the</strong> o<strong>the</strong>r end of <strong>the</strong> range, twelve states have<br />
no regular state pre-school education programme<br />
and in eight states less than 20% of children are<br />
enrolled (Barnett et al., 2008). There are also<br />
marked differences in <strong>the</strong> quality of provision<br />
(Ackerman et al., 2009). Ten benchmarks have<br />
been established for assessing quality standards. 4<br />
However, programmes in Florida are required to<br />
meet only four benchmarks and Texas sets no<br />
limits on class size or staff/child ratios. Spending<br />
levels per child also vary markedly: five states<br />
spend more than US$8,000 per pupil while ano<strong>the</strong>r<br />
five spend less than US$3,000 (Barnett et al., 2008).<br />
Reaching <strong>the</strong> vulnerable and disadvantaged<br />
Goal 1 of <strong>the</strong> Dakar Framework for Action commits<br />
governments to expanding early childhood care<br />
and education ‘especially for <strong>the</strong> most vulnerable<br />
and disadvantaged’. This is for good reason.<br />
Children from disadvantaged households have <strong>the</strong><br />
most to gain from early childhood care – and <strong>the</strong><br />
most to lose from being excluded. Unfortunately,<br />
cross-country evidence strongly suggests that<br />
those who need it most receive it least.<br />
Household poverty and low levels of parental<br />
education are two of <strong>the</strong> most pronounced barriers<br />
to early childhood programmes. Evidence from a<br />
survey of fifty-six developing countries shows that<br />
being born into a poor household or having a<br />
Children from<br />
disadvantaged<br />
households have<br />
<strong>the</strong> most to gain<br />
from early<br />
childhood care<br />
Table <strong>2.</strong>1: Pre-primary enrolment and gross enrolment ratios by region, 1999 and 2007<br />
World<br />
Developing countries<br />
Developed countries<br />
Countries in transition<br />
Sub-Saharan Africa<br />
Arab States<br />
Central Asia<br />
East Asia and <strong>the</strong> Pacific<br />
East Asia<br />
Pacific<br />
South and West Asia<br />
Latin America and <strong>the</strong> Caribbean<br />
Caribbean<br />
Latin America<br />
North America and Western Europe<br />
Central and Eastern Europe<br />
Source: Annex, Statistical Table 3B.<br />
Total enrolment<br />
Gross enrolment ratios<br />
Change<br />
Change<br />
School year ending in<br />
between 1999<br />
School year ending in<br />
between 1999<br />
1999<br />
2007 and 2007 1999 2007 and 2007<br />
(millions) (%) (%)<br />
(%)<br />
113 139 24 33 41 26<br />
80 106 32 27 36 32<br />
25 26 4 73 80 10<br />
7 8 7 45 63 39<br />
5 10 82 10 15 53<br />
2 3 26 15 19 25<br />
1 1 13 19 28 44<br />
37 39 4 40 47 18<br />
37 38 4 40 47 19<br />
0.4 0.5 12 61 67 11<br />
21 36 69 21 36 71<br />
16 20 22 56 65 17<br />
0.7 0.8 16 65 74 13<br />
16 19 22 55 65 17<br />
19 20 6 75 82 9<br />
9 10 5 50 64 30<br />
3. In <strong>the</strong> European Union,<br />
about 87% of 4-year-olds<br />
are in school (EACEA, 2009).<br />
4. The standards include<br />
teacher and assistant teacher<br />
degrees and specialized<br />
training, in-service training<br />
provision, class size,<br />
staff/child ratios, support<br />
services, meals and<br />
monitoring. Just two states<br />
– Alabama and South Carolina –<br />
meet all ten benchmarks.<br />
51
1<br />
0<br />
0<br />
CHAPTER 2<br />
2<br />
Education for All Global Monitoring Report<br />
In Chile,<br />
a programme<br />
aimed<br />
at achieving<br />
early childhood<br />
care for<br />
all 4-year-olds<br />
has targeted<br />
<strong>the</strong> poorest<br />
households<br />
Bolivia<br />
Nicaragua<br />
Haiti<br />
Côte d’Ivoire<br />
Madagascar<br />
Kenya<br />
Botswana<br />
Viet Nam<br />
Lesotho<br />
Philippines<br />
Zambia<br />
Niger<br />
Togo<br />
Rwanda<br />
Mongolia<br />
Uganda<br />
Egypt<br />
mo<strong>the</strong>r with no education carries a large handicap<br />
when it comes to early childhood care, regardless<br />
of age, gender or place of residence (Figures <strong>2.</strong>5<br />
and <strong>2.</strong>6). Living in one of Zambia’s poorest<br />
households cuts <strong>the</strong> chance of participating in<br />
early childhood care by a factor of 12 compared<br />
with children in <strong>the</strong> wealthiest households, and<br />
<strong>the</strong> factor rises to 25 in Uganda and 28 in Egypt<br />
(Nonoyama-Tarumi et al., 2008). Such figures<br />
demonstrate <strong>the</strong> degree to which early childhood<br />
provision is reinforcing inequalities associated<br />
with <strong>the</strong> home environment.<br />
Why do children from disadvantaged households<br />
face <strong>the</strong> highest barriers to entry? In some cases,<br />
it is because facilities are too far from <strong>the</strong>ir homes.<br />
In o<strong>the</strong>rs, facilities are accessible but unaffordable<br />
– a problem that has held back efforts to expand<br />
coverage in Egypt (UNESCO, 2008a). However,<br />
several countries have succeeded in expanding<br />
access. In Chile, a programme aimed at achieving<br />
early childhood care for all 4-year-olds has<br />
targeted <strong>the</strong> poorest income groups (Box <strong>2.</strong>4).<br />
Figure <strong>2.</strong>5: Children from rich families are more likely<br />
to participate in early childhood programmes<br />
Likelihood of 3- and 4-year-olds participating in early learning<br />
programmes, children from <strong>the</strong> richest 20% compared with children<br />
from <strong>the</strong> poorest 20%<br />
Egyptian children from<br />
<strong>the</strong> richest families are<br />
more than 25 times<br />
more likely than those<br />
from <strong>the</strong> poorest<br />
to participate in early<br />
childhood programmes<br />
0 5 10 15 20 25 30<br />
Odds ratios for <strong>the</strong> likelihood of participation<br />
in early childhood programmes<br />
Notes: Using odds ratios (see glossary), this figure compares <strong>the</strong> likelihood<br />
of young children participating in early learning programmes, depending on<br />
<strong>the</strong> wealth status of <strong>the</strong>ir families. Specifically, odds ratios provide an estimate<br />
of <strong>the</strong> differences in probability of attending early childhood programmes between<br />
one reference group (<strong>the</strong> poorest 20%) and ano<strong>the</strong>r (<strong>the</strong> richest 20%), and <strong>the</strong>y are<br />
estimated from a logistic regression with five dependent variables: gender, age,<br />
place of residence, mo<strong>the</strong>r’s level of education and household wealth.<br />
Source: Nonoyama-Tarumi et al. (2008).<br />
Rich countries have also struggled to meet equity<br />
<strong>goals</strong>. There is extensive evidence from <strong>the</strong><br />
European Union that low-income families and<br />
immigrants have less access to good-quality early<br />
childhood care (Arnold and Doctoroff, 2003;<br />
Nusche, 2009; Sylva et al., 2007).<br />
Evidence from <strong>the</strong> United States also documents<br />
large disparities (Barnett et al., 2008). Families<br />
with incomes just above <strong>the</strong> poverty line face<br />
some of <strong>the</strong> greatest difficulties in gaining access,<br />
demonstrating <strong>the</strong> importance of targeting<br />
households at this level. Maternal education also<br />
has a marked bearing on United States pre-school<br />
participation: attendance rates of 4-year-olds are<br />
55% for children of mo<strong>the</strong>rs who have dropped<br />
out of secondary school but 87% for children of<br />
mo<strong>the</strong>rs with a college education (Barnett et al.,<br />
2008; Barnett and Yarosz, 2007).<br />
On a more positive note, several governments are<br />
scaling up early childhood care as part of wider<br />
anti-poverty initiatives. In <strong>the</strong> United Kingdom,<br />
Sure Start, a flagship strategy introduced in 1997<br />
to tackle child poverty, social exclusion and<br />
educational disadvantage, now reaches <strong>2.</strong>4 million<br />
families (Every Child Matters, 2009).<br />
Figure <strong>2.</strong>6: Children of educated mo<strong>the</strong>rs are more likely<br />
to attend pre-school programmes<br />
Likelihood of 3- and 4-year-olds participating in early learning<br />
programmes, children of mo<strong>the</strong>rs with secondary education<br />
or higher compared with children of mo<strong>the</strong>rs with no education<br />
Zambia<br />
Egypt<br />
Dominican Rep.<br />
India<br />
Lesotho<br />
Madagascar<br />
Côte d’Ivoire<br />
Cameroon<br />
Viet Nam<br />
Chad<br />
Niger<br />
Burundi<br />
Children in Burundi<br />
with educated mo<strong>the</strong>rs<br />
are ten times more likely<br />
to participate in early<br />
childhood programmes<br />
0 2 4 6 8 10 12<br />
Odds ratios for <strong>the</strong> likelihood of participation<br />
in early childhood programmes<br />
Notes: This figure compares <strong>the</strong> likelihood of young children participating in<br />
early learning programmes, based on <strong>the</strong> mo<strong>the</strong>r’s education level. The odds<br />
ratios are calculated in <strong>the</strong> same way as those in Figure <strong>2.</strong>5 for different<br />
reference groups: one consists of children with a mo<strong>the</strong>r with no education<br />
and ano<strong>the</strong>r of children with a mo<strong>the</strong>r having secondary education or higher.<br />
Source: Nonoyama-Tarumi et al. (2008).<br />
52
PROGRESS TOWARDS THE <strong>EFA</strong> GOALS<br />
Early childhood care and education<br />
Box <strong>2.</strong>4: Expansion of early childhood education in Chile<br />
Chile has some of <strong>the</strong> deepest and most persistent<br />
education inequalities in Latin America. Recent<br />
reforms are attempting to streng<strong>the</strong>n equity by<br />
expanding and improving early childhood care.<br />
After her election in 2006, President Michelle<br />
Bachelet initiated a major overhaul of early childhood<br />
care, including raising public spending (Larrañaga,<br />
2009; OECD, 2009e). The most ambitious measure<br />
involves building 3,000 new childcare facilities and<br />
establishing a national child development initiative,<br />
Chile Crece Contigo, for all children under 5, as part<br />
of <strong>the</strong> health care system.<br />
Chile Crece Contigo, a result of collaboration by<br />
government, child development experts and o<strong>the</strong>r<br />
interested parties (Frenz, 2007), aims to meet <strong>the</strong><br />
needs of vulnerable families and children during<br />
<strong>the</strong> critical phases of early childhood development.<br />
Families have access to a wide range of social and<br />
health services through primary care centres. Their<br />
progress is monitored via information technology.<br />
Implementation is managed by nine national<br />
ministries and coordinated through regional,<br />
provincial and local governments.<br />
A concerted effort has been made to reach children<br />
from <strong>the</strong> poorest 40% of households. In that income<br />
bracket, young children with mo<strong>the</strong>rs at work, in<br />
school or seeking employment are eligible for free<br />
child care in <strong>the</strong> sala cuna (under 2) or <strong>the</strong> jardín<br />
infantil (ages 2 and 3).<br />
Central to <strong>the</strong> strategy is commitment to quality.<br />
Efforts have been made from <strong>the</strong> outset to measure<br />
and assess <strong>the</strong> development of vocabulary, language<br />
and wider skills through Un Buen Comienzo, a<br />
programme that runs in sixty schools in thirteen<br />
communes of Santiago. Using rigorous evaluation,<br />
Un Buen Comienzo seeks to reduce <strong>the</strong> vocabulary<br />
gap between children in low-income families and<br />
o<strong>the</strong>r children, improve pre-school attendance and<br />
reduce later reading difficulties. Teacher development,<br />
parental literacy and engagement, and child health<br />
are emphasized.<br />
Sources: Frenz (2007); OECD (2009e).<br />
Ano<strong>the</strong>r striking example comes from New<br />
Zealand. Since 2007, all 3- and 4-year-olds in <strong>the</strong><br />
country have been entitled to twenty hours a week<br />
of free early childhood education (Froese, 2008;<br />
May, 2008). Efforts are being made to improve <strong>the</strong><br />
quality of early childhood education available to<br />
Māori children. Curricula and teaching materials<br />
have been modified through partnerships with<br />
Māori groups. Scholarships and incentives have<br />
been expanded to attract Māori-language speakers<br />
into early childhood teaching. In <strong>the</strong> five years to<br />
2007, <strong>the</strong> number of Māori-speaking educators<br />
tripled and <strong>the</strong> share of Māori primary school<br />
entrants having been to pre-school rose from 86%<br />
to 91% (New Zealand Ministry of Education, 2009).<br />
Conclusion<br />
The Dakar Framework for Action does not set<br />
a quantitative goal for early childhood care<br />
and education, so what targets – if any – should<br />
governments set? And what role should<br />
governments play in paying for and providing care?<br />
There are no universal answers to <strong>the</strong>se questions.<br />
As <strong>the</strong> <strong>EFA</strong> Global Monitoring Report 2007<br />
documented, many countries have set unrealistic<br />
targets. Countries struggling to get children into<br />
and through basic education have to weigh<br />
arguments for universal early childhood coverage<br />
against real resource constraints. At <strong>the</strong> same time,<br />
governments need to recognize <strong>the</strong> potential<br />
efficiency and equity gains from investing in early<br />
childhood care. As one Nobel Prize-winning<br />
economist has written: ‘Early interventions targeted<br />
<strong>towards</strong> disadvantaged children have much higher<br />
returns than later interventions. … At current levels<br />
of resources, society over-invests in remedial skill<br />
investments at later ages and under-invests in <strong>the</strong><br />
early years’ (Heckman, 2006, p.1902).<br />
While that reflection is based on evidence from <strong>the</strong><br />
United States, it is likely to have a wider application.<br />
The lesson to be drawn is that public investment<br />
should be geared <strong>towards</strong> narrowing disparities,<br />
targeting marginalized groups and providing goodquality<br />
services that are accessible to <strong>the</strong> poor.<br />
Governments<br />
need to recognize<br />
<strong>the</strong> potential<br />
efficiency and<br />
equity gains from<br />
investing in early<br />
childhood care<br />
53
0<br />
1<br />
2<br />
0<br />
CHAPTER 2<br />
Education for All Global Monitoring Report<br />
Despite<br />
encouraging<br />
progress, many<br />
of <strong>the</strong> poorest<br />
countries are<br />
struggling to<br />
reach universal<br />
primary<br />
education<br />
Universal primary<br />
education<br />
Goal <strong>2.</strong> Ensuring that by 2015 all children,<br />
particularly girls, children in difficult<br />
circumstances and those belonging to ethnic<br />
minorities, have access to and complete, free and<br />
compulsory primary education of good quality.<br />
The past decade has seen rapid progress <strong>towards</strong><br />
universal primary education. Some of <strong>the</strong> world’s<br />
poorest countries have dramatically increased<br />
enrolment, narrowed gender gaps and extended<br />
opportunities for disadvantaged groups. School<br />
completion rates are also rising. These<br />
achievements provide a marked contrast to <strong>the</strong><br />
‘lost decade’ of <strong>the</strong> 1990s. But <strong>the</strong>re are limits<br />
to <strong>the</strong> good news. In <strong>the</strong> midst of an increasingly<br />
knowledge-based global economy, millions of<br />
children are still out of school and countless<br />
millions more start school but drop out before<br />
completing primary education. And <strong>the</strong>re is now<br />
a real danger that <strong>the</strong> global economic crisis<br />
will stall, and perhaps even reverse, <strong>the</strong> gains<br />
registered over <strong>the</strong> past decade (see <strong>Chapter</strong> 1).<br />
The post-Dakar record has to be assessed<br />
against <strong>the</strong> ambition set out in Goal 2 of <strong>the</strong> Dakar<br />
Framework for Action: universal primary education<br />
by 2015. Is <strong>the</strong> goal still attainable? The answer<br />
will depend on decisions taken over <strong>the</strong> next two<br />
years by national governments and aid donors.<br />
The window of opportunity for ensuring that all<br />
primary school age children currently out of<br />
school complete a full cycle of primary education<br />
is rapidly closing. Getting all children into school<br />
by 2015 is still feasible, but <strong>the</strong> goal will not be<br />
achieved with a business-as-usual approach.<br />
The World Education Forum (Dakar, 2000) gave<br />
new impetus to education, both nationally and<br />
internationally. Yet <strong>the</strong> hard fact remains that <strong>the</strong><br />
world will fall short of <strong>the</strong> targets set and that far<br />
more could have been achieved. Many developing<br />
countries could have done much more to<br />
accelerate progress, notably through policies to<br />
overcome inequalities in education. Meanwhile,<br />
donors have a mixed record of delivery on <strong>the</strong>ir<br />
collective commitment to back national<br />
programmes with increased financial support –<br />
an issue addressed in more detail in <strong>Chapter</strong> 4.<br />
This section documents progress <strong>towards</strong><br />
universal primary education. Looking behind <strong>the</strong><br />
national data, it provides an in-depth look at some<br />
of <strong>the</strong> crucial challenges facing governments in<br />
<strong>the</strong> countdown to 2015. The following are among<br />
<strong>the</strong> key messages to emerge:<br />
Out-of-school numbers are dropping for primary<br />
school age children, but getting all children into<br />
school will require a far stronger focus on <strong>the</strong><br />
marginalized. When <strong>the</strong> Dakar forum was held,<br />
over 100 million children of primary school age<br />
were out of school. By 2007, <strong>the</strong> figure had<br />
fallen to 72 million. This headline figure bears<br />
testimony to national governments’ efforts.<br />
The bad news is that, on current trends, some<br />
56 million children could still be out of school<br />
in 2015. Changing this scenario will require<br />
a far stronger commitment by governments<br />
to reach girls and o<strong>the</strong>r marginalized groups.<br />
It will also require a sharper focus on countries<br />
affected by conflict or engaged in post-conflict<br />
reconstruction.<br />
<strong>Progress</strong> <strong>towards</strong> universal primary enrolment<br />
has been partial and mixed. Despite<br />
encouraging progress, many of <strong>the</strong> poorest<br />
countries are struggling to reach universal<br />
enrolment. Less attention has been paid to<br />
higher-income countries with significant outof-school<br />
populations, such as <strong>the</strong> Philippines<br />
and Turkey. Such countries will have to target<br />
marginalization far more systematically to<br />
deliver on <strong>the</strong> Dakar commitments. New<br />
research indicates that official enrolment data<br />
may overstate <strong>the</strong> numbers of children in school<br />
at <strong>the</strong> appropriate age, suggesting that more<br />
needs to be done to address <strong>the</strong> problem of<br />
late entry and dropout. Household survey data<br />
for a number of countries indicate overestimates<br />
of 10% or more in school attendance rates.<br />
Gender barriers remain intact. There has<br />
been progress <strong>towards</strong> greater gender parity<br />
in school enrolment. Even so, being born<br />
a girl carries with it a significant education<br />
disadvantage in many countries. That<br />
disadvantage is reflected in <strong>the</strong> fact that girls<br />
still account for 54% of <strong>the</strong> out-of-school<br />
population. Moreover, out-of-school girls are<br />
far more likely than boys never to go to school.<br />
In twenty-eight countries, <strong>the</strong>re are fewer than<br />
nine girls in primary school for every ten boys.<br />
Poverty fur<strong>the</strong>r reinforces gender disparity.<br />
54
PROGRESS TOWARDS THE <strong>EFA</strong> GOALS<br />
Universal primary education<br />
Getting children into primary school is just<br />
a first step. Universal primary education<br />
involves entering school at an appropriate<br />
age, progressing through <strong>the</strong> system and<br />
completing a full cycle. Unfortunately, millions<br />
of children enter school late, drop out early<br />
and never complete a full cycle. More<br />
integrated approaches to monitoring are<br />
required to measure <strong>the</strong> real state of progress<br />
<strong>towards</strong> universal primary education.<br />
Out-of-school adolescents are often<br />
overlooked. Monitoring progress <strong>towards</strong><br />
international development <strong>goals</strong> in education<br />
focuses on <strong>the</strong> primary school age group.<br />
The situation of adolescents has been subject<br />
to less scrutiny. There are some 71 million<br />
children of lower secondary school age<br />
currently out of school. Many have not<br />
completed a full primary cycle and face<br />
<strong>the</strong> prospect of social and economic<br />
marginalization. Counting adolescents<br />
doubles <strong>the</strong> global headline figure for<br />
out-of-school children.<br />
The section is divided into three parts. Part 1<br />
looks at progress <strong>towards</strong> one of <strong>the</strong> most<br />
important requirements for achieving universal<br />
primary education: getting all children into school.<br />
It looks beyond <strong>the</strong> headline numbers to explore<br />
<strong>the</strong> characteristics of <strong>the</strong> out-of-school<br />
population. Removing <strong>the</strong> barriers that keep<br />
children out of school is <strong>the</strong> first step <strong>towards</strong><br />
achieving universal primary enrolment – ensuring<br />
that <strong>the</strong> entire primary school age group is in<br />
school by 2015. Part 2 looks at enrolment trends.<br />
Part 3 examines <strong>the</strong> problem of retention and<br />
progression through primary school, and <strong>the</strong><br />
transition to secondary education.<br />
Numbers of out-of-school children<br />
are declining, but not fast enough<br />
Malina is a 12-year-old living in a rural area of<br />
Rattanak Kiri, a remote hill district in Cambodia.<br />
She is a member of a minority ethnic group<br />
and has never been to school.<br />
Lucy, 12, lives in <strong>the</strong> slum of Kibera in <strong>the</strong> Kenyan<br />
capital, Nairobi. When she was 8, she enrolled in<br />
primary school, but in <strong>the</strong> second grade she<br />
dropped out. She wants to go back to school but<br />
has to take care of her bro<strong>the</strong>r, and her mo<strong>the</strong>r<br />
cannot afford <strong>the</strong> fees, uniforms and books.<br />
Victor is 14 years old. He lives on <strong>the</strong> streets of<br />
Manila and makes a living by selling newspapers<br />
at road junctions. He went to primary school for<br />
four years, but left before completing it and has<br />
no prospect of returning.<br />
Maria, 15, is in grade 4 of her local primary<br />
school in Panama, having started late, repeated<br />
two grades and dropped out for a year when<br />
she was 1<strong>2.</strong><br />
Compared with <strong>the</strong> 1990s, <strong>the</strong> first decade of <strong>the</strong><br />
twenty-first century has been one of rapid progress<br />
<strong>towards</strong> universal primary education. Out-of-school<br />
numbers are falling and more children are<br />
completing primary school. Yet <strong>the</strong> sheer size of <strong>the</strong><br />
out-of-school population remains an indictment of<br />
national governments and <strong>the</strong> entire international<br />
community. Denying children an opportunity to put<br />
even a first step on <strong>the</strong> education ladder sets <strong>the</strong>m<br />
on a course for a lifetime of disadvantage. It violates<br />
<strong>the</strong>ir basic human right to an education. It also<br />
wastes a precious national resource and potential<br />
driver of economic growth and poverty reduction.<br />
As <strong>the</strong> experiences of <strong>the</strong> children cited above<br />
testify, ‘out of school’ is a simple concept with many<br />
meanings. Some children of late primary school<br />
age and even secondary school age have never<br />
been to school. O<strong>the</strong>rs have started school but<br />
dropped out. Still o<strong>the</strong>rs are in a state of flux,<br />
moving between in-school and out-of-school status.<br />
The out-of-school figures in this section refer only<br />
to children of primary school age who are not in<br />
school. They represent <strong>the</strong> tip of <strong>the</strong> total out-ofschool<br />
iceberg, since <strong>the</strong>y do not cover adolescents<br />
of secondary school age who have not completed<br />
primary school. Even within <strong>the</strong> primary school age<br />
group, data for any one year provide only a static<br />
snapshot of a dynamic and complicated picture.<br />
The snapshot for 2007, <strong>the</strong> latest year for which<br />
data are available, points to continued progress<br />
but still large deficits. There are some remarkable<br />
achievements since 1999:<br />
Out-of-school numbers are falling. Worldwide,<br />
<strong>the</strong> number of children of primary school age<br />
who are out of school has declined by 33 million<br />
since <strong>the</strong> Dakar pledges were made, from<br />
105 million in 1999 to 72 million in 2007.<br />
Seven out of every ten out-of-school children<br />
live in South and West Asia, and sub-Saharan<br />
Africa (Figure <strong>2.</strong>7).<br />
There were<br />
72 million children<br />
out of school<br />
in 2007<br />
55
0<br />
1<br />
CHAPTER 2<br />
0<br />
2<br />
Education for All Global Monitoring Report<br />
An estimated<br />
56 million<br />
children could<br />
still be out of<br />
school in 2015<br />
5. This figure should not<br />
be compared with <strong>the</strong><br />
partial projection in <strong>the</strong><br />
<strong>EFA</strong> Global Monitoring<br />
Report 2009, which<br />
treated a smaller group of<br />
countries using a different<br />
methodology, and did not<br />
include countries such as<br />
<strong>the</strong> Democratic Republic<br />
of <strong>the</strong> Congo and <strong>the</strong><br />
Sudan.<br />
The gender gap is shrinking. The share of girls<br />
in <strong>the</strong> out-of-school population declined from<br />
58% to 54%.<br />
South and West Asia have achieved rapid<br />
progress. The region more than halved its<br />
out-of-school population – a decline of 21 million.<br />
The region also cut <strong>the</strong> share of girls in <strong>the</strong><br />
out-of-school total, from 63% to 58%.<br />
Sub-Saharan Africa has registered strong<br />
progress. During a period in which <strong>the</strong> size of its<br />
school age population increased by 20 million,<br />
sub-Saharan Africa reduced its out-of-school<br />
population by almost 13 million, or 28%. The<br />
strength of <strong>the</strong> region’s progress can be gauged<br />
by a comparison with <strong>the</strong> 1990s. Had <strong>the</strong> region<br />
progressed at <strong>the</strong> same pace as in <strong>the</strong> 1990s,<br />
18 million more children would be out of school.<br />
The limits to progress also have to be<br />
acknowledged. Not only is <strong>the</strong> world off track<br />
for <strong>the</strong> Dakar commitments, but <strong>the</strong>re is cause<br />
for concern over <strong>the</strong> pace of change:<br />
The 2015 target will be missed. If <strong>the</strong> world<br />
were to continue <strong>the</strong> linear trend for 1999–2007,<br />
an estimated 56 million children would still be<br />
out of school in 2015. 5 Slower economic growth,<br />
pressure on education budgets and rising poverty<br />
Figure <strong>2.</strong>7: Numbers of out-of-school children are declining<br />
Out-of-school children by region, 1999 and 2007<br />
Out-of-school children (millions)<br />
120<br />
100<br />
80<br />
60<br />
40<br />
20<br />
105 million<br />
4<br />
8<br />
6<br />
39<br />
45<br />
72 million<br />
3<br />
6<br />
9<br />
18<br />
32<br />
Central Asia<br />
North America and Western Europe<br />
Central and Eastern Europe<br />
Latin America and <strong>the</strong> Caribbean<br />
Arab States<br />
East Asia and <strong>the</strong> Pacific<br />
South and West Asia<br />
Sub-Saharan Africa<br />
associated with <strong>the</strong> global economic crisis could<br />
significantly inflate this figure (Figure <strong>2.</strong>8).<br />
<strong>Progress</strong> has slowed. The post-1999 overview<br />
provides a positive gloss on some disturbing<br />
underlying trends. Two-thirds of <strong>the</strong> total decline<br />
in out-of-school numbers took place during <strong>the</strong><br />
two years to 2004, when <strong>the</strong> numbers dropped<br />
by 22 million. In <strong>the</strong> three years to 2007, <strong>the</strong><br />
out-of-school population fell by just 8 million.<br />
The slowdown illustrates one of <strong>the</strong> central<br />
challenges now facing governments: <strong>the</strong> closer<br />
countries get to universal primary education,<br />
<strong>the</strong> harder it becomes to reach children still out<br />
of school. That is why sustained progress will<br />
require a stronger focus on marginalization.<br />
South and West Asia dominated <strong>the</strong> reduction.<br />
Much of <strong>the</strong> decline took place in India, which<br />
reported a fall of almost 15 million in out-ofschool<br />
numbers in <strong>the</strong> two years after <strong>the</strong> 2001<br />
launch of <strong>the</strong> Sarva Shiksha Abhiyan (universal<br />
primary education) programme. 6<br />
The deficit in sub-Saharan Africa remains large.<br />
Fully one-quarter of sub-Saharan Africa’s<br />
primary school age children were out of school in<br />
2007 – and <strong>the</strong> region accounted for nearly 45%<br />
of <strong>the</strong> global out-of-school population. Half of <strong>the</strong><br />
twenty countries with more than 500,000 children<br />
out of school were in sub-Saharan Africa (see<br />
Figure <strong>2.</strong>12 below). Nigeria alone contributed<br />
over 10% of <strong>the</strong> global total. <strong>Progress</strong> in <strong>the</strong><br />
region has been uneven. Some countries with<br />
large out-of-school populations in 1999 have<br />
made major advances; examples include<br />
Ethiopia, Kenya, Mozambique, <strong>the</strong> United<br />
Republic of Tanzania and Zambia. Ethiopia and<br />
<strong>the</strong> United Republic of Tanzania each reduced<br />
out-of-school numbers by over 3 million between<br />
1999 and 2007. Countries making only limited<br />
progress include Liberia, Malawi and Nigeria.<br />
Conflict remains a major barrier. Children living<br />
in countries enduring or recovering from conflict<br />
are less likely to be in school. Many such<br />
countries lack publicly available data and so<br />
receive less prominence in international debates<br />
than <strong>the</strong>y merit. But a lack of reliable data should<br />
not deflect attention from <strong>the</strong> scale of <strong>the</strong><br />
0<br />
1999 2007<br />
Source: Annex, Statistical Table 5.<br />
6. The key aim of <strong>the</strong> programme is to universalize elementary<br />
education by 2010. Commitments include constructing and improving<br />
infrastructure in deprived areas, along with measures targeted <strong>towards</strong><br />
areas with large marginalized populations (scheduled castes, scheduled<br />
tribes, Muslims) or low female literacy (Ayyar, 2008; Govinda, 2009);<br />
see also <strong>Chapter</strong> 3.<br />
56
PROGRESS TOWARDS THE <strong>EFA</strong> GOALS<br />
Universal primary education<br />
Figure <strong>2.</strong>8: Missing <strong>the</strong> target — out-of-school trends projected to 2015<br />
Projected numbers of out-of-school children to 2015<br />
120<br />
100<br />
105 million<br />
Rest of <strong>the</strong> world<br />
Out-of-school children (millions)<br />
80<br />
60<br />
40<br />
South and West Asia<br />
39 million<br />
72 million<br />
56 million<br />
20<br />
Sub-Saharan Africa<br />
45 million<br />
8 million<br />
23 million<br />
0<br />
1999 2000 2001 2002 2003 2004 2005 2006 2007 2008 2009 2010 2011 2012 2013 2014 2015<br />
Note: Projections based on regional compound growth rates for 1999–2007.<br />
Source: UIS database (data for 1999–2007).<br />
problem. Best estimates suggest that more<br />
than 25 million out-of-school children live in<br />
low-income countries affected by conflict –<br />
around 35% of <strong>the</strong> global total. 7 Finding ways<br />
to reach children in conflict-affected areas<br />
of countries such as Afghanistan, <strong>the</strong> Central<br />
African Republic, <strong>the</strong> Democratic Republic<br />
of <strong>the</strong> Congo and <strong>the</strong> Sudan is one of <strong>the</strong> most<br />
urgent of all <strong>EFA</strong> challenges. Attaching more<br />
weight to education in post-conflict recovery<br />
is also vital. While Liberia now has peace and<br />
stability, 447,000 of its children were out of<br />
school in 2008 – an increase of almost 180,000<br />
over 1999.<br />
Numbers are probably underestimated.<br />
Estimating <strong>the</strong> number of children from <strong>the</strong><br />
relevant age group who are out of primary<br />
school is an inexact science. Administrative<br />
data that schools report to ministries of<br />
education are an important resource and<br />
national reporting systems are becoming more<br />
effective. However, uncertainties over<br />
demographic profiles (and hence <strong>the</strong> number<br />
of children in each age group) can cloud <strong>the</strong><br />
issue. Household surveys are ano<strong>the</strong>r source<br />
of information, usually obtained through<br />
parental reporting on whe<strong>the</strong>r <strong>the</strong>ir children<br />
attend school. There are often significant<br />
inconsistencies between <strong>the</strong>se two data sources.<br />
For twenty-nine countries in sub-Saharan Africa,<br />
and South and West Asia examined in this<br />
Report, household surveys show around 50%<br />
fewer children in school – 22 million in total –<br />
than administrative data indicate. This is<br />
equivalent to an increase of 30% in <strong>the</strong> global<br />
out-of-school estimate. Such findings illustrate<br />
how different measurement tools can generate<br />
different results. They also demonstrate <strong>the</strong><br />
importance of national governments,<br />
international agencies and researchers<br />
working toge<strong>the</strong>r to build a more complete<br />
picture of <strong>the</strong> out-of-school population (Box <strong>2.</strong>5).<br />
Who and where are <strong>the</strong> out-of-school<br />
children — and what are <strong>the</strong>ir chances<br />
of entering school?<br />
Being out of school is not a fixed condition. The<br />
category covers children who have dropped out of<br />
school temporarily or permanently, those who have<br />
never been to school but might start late and those<br />
who will never go to school. Data constraints make<br />
it difficult to unravel <strong>the</strong> precise characteristics of<br />
<strong>the</strong> out-of-school population. However, a model<br />
developed by <strong>the</strong> UNESCO Institute for Statistics<br />
(UIS) makes it possible to predict, on <strong>the</strong> basis of<br />
past evidence, what share of out-of-school children<br />
is likely to enrol in <strong>the</strong> future (UIS, 2009a).<br />
Household survey<br />
data suggest an<br />
increase of 30%<br />
in <strong>the</strong> global<br />
out-of-school<br />
estimate<br />
7. The countries included are<br />
ones that experienced armed<br />
conflicts resulting in at least<br />
twenty-five battle-related<br />
deaths per year over at least<br />
three years between 1999<br />
and 2007 or more than 1,000<br />
battle-related deaths in at<br />
least one year during <strong>the</strong><br />
same period. Of <strong>the</strong>se, only<br />
countries categorized as<br />
least developed countries<br />
by <strong>the</strong> United Nations or<br />
low-income countries by<br />
<strong>the</strong> World Bank in 2007 were<br />
included. The proportion<br />
of children out of school<br />
according to this definition<br />
is lower than <strong>the</strong> frequently<br />
quoted figure of more than<br />
half. The higher figure is<br />
based on calculations using<br />
a different methodology,<br />
which includes some<br />
countries identified as<br />
‘fragile’ but not in conflict, as<br />
well as some middle-income<br />
conflict-affected countries<br />
(Save <strong>the</strong> Children, 2009a).<br />
57
0<br />
1<br />
0<br />
CHAPTER 2<br />
2<br />
Education for All Global Monitoring Report<br />
Box <strong>2.</strong>5: Children count — but counting children in school is difficult<br />
Data on enrolment by age are often treated uncritically as<br />
an accurate record of how many primary school age children<br />
are actually in primary school. The information passes from<br />
schools to education ministries and <strong>the</strong>n to <strong>the</strong> UNESCO<br />
Institute for Statistics (UIS), which compiles <strong>the</strong> international<br />
data used to compare countries, monitor progress and inform<br />
international meetings. But is <strong>the</strong> information accurate?<br />
Research by <strong>the</strong> UIS compares enrolment figures generated by<br />
governments with data reported in Demographic and Health<br />
Surveys of households in twenty-nine countries (Figure <strong>2.</strong>9).<br />
The analysis found that, when compared with household<br />
survey data, school registers tend to count more children<br />
within <strong>the</strong> official primary school age range. Correcting that<br />
bias would have <strong>the</strong> effect of reducing <strong>the</strong> net enrolment<br />
ratio — by significant margins in some countries. In <strong>the</strong> United<br />
Republic of Tanzania, <strong>the</strong> discrepancy was equivalent to<br />
twenty-five percentage points. It was over ten percentage<br />
points in ten of <strong>the</strong> twenty-nine countries covered. For nine<br />
o<strong>the</strong>r countries <strong>the</strong> bias was in <strong>the</strong> o<strong>the</strong>r direction. The study<br />
found that <strong>the</strong> main factor behind <strong>the</strong> differences was not<br />
<strong>the</strong> over-reporting of student numbers, but <strong>the</strong> misreporting<br />
of age. Household surveys actually report a greater number<br />
of total students attending than administrative data when<br />
all students, regardless of <strong>the</strong>ir age, are counted.<br />
Age-specific reporting is <strong>the</strong> main source of discrepancy.<br />
Consider <strong>the</strong> case of Senegal — a country that illustrates<br />
<strong>the</strong> broader pattern (Figure <strong>2.</strong>10). For <strong>the</strong> 5 to 11 age group,<br />
administrative data reports an enrolment ratio consistently<br />
higher than <strong>the</strong> attendance rate for <strong>the</strong> same age group<br />
recorded in household survey data. The discrepancy is very<br />
large. For age 8, <strong>the</strong> net enrolment ratio is reported to<br />
be 77%, compared with 58% for <strong>the</strong> net attendance rate.<br />
At about age 11, <strong>the</strong> reporting lines cross: at older ages,<br />
household survey data register higher levels of attendance<br />
than net enrolment would imply.<br />
The consistent pattern to emerge from <strong>the</strong> UIS study can be<br />
briefly summarized. If <strong>the</strong> information in household surveys is<br />
accurate, net attendance rates covering children in <strong>the</strong> official<br />
primary school age range are lower than reported through<br />
net enrolment ratios based on administrative data. This would<br />
imply that <strong>the</strong>re are more over-age children in school, and<br />
more primary school age children out of school, than indicated<br />
by official data.<br />
Simple comparisons between administrative and household<br />
survey data do not, however, provide a solid foundation for<br />
such conclusions to be drawn. There are many possible factors<br />
behind <strong>the</strong> discrepancies. One is demography. If national<br />
population data over- or under-report <strong>the</strong> size of <strong>the</strong> primary<br />
school age population, net enrolment ratios drawn from<br />
administrative data will mirror <strong>the</strong> inaccuracy.<br />
Uncertainty over <strong>the</strong> denominator (population size) can be<br />
compounded by education reporting systems. Registers may<br />
not provide an accurate picture of <strong>the</strong> age of students, instead<br />
treating <strong>the</strong> class that children are in as a proxy for <strong>the</strong>ir age.<br />
In some cases institutional incentives may play a role: if <strong>the</strong><br />
number of students in <strong>the</strong> appropriate grade for <strong>the</strong>ir age<br />
determines <strong>the</strong> allocation of grants or teachers, schools and<br />
local governments might have a tendency to inflate <strong>the</strong><br />
school register.<br />
Household survey exercises have problems as well. Apart from<br />
standard sampling errors, <strong>the</strong> timing of surveys can have a<br />
bearing on <strong>the</strong> results: for example, <strong>the</strong> data might be affected<br />
by <strong>the</strong> agricultural calendar, drought or major external shocks.<br />
The reference period and phrasing of questions can also cause<br />
complications. Household surveys examined in <strong>the</strong> analysis<br />
presented here ask whe<strong>the</strong>r children attended school at some<br />
point during <strong>the</strong> school year, not whe<strong>the</strong>r <strong>the</strong>y are in school<br />
for <strong>the</strong> entire school year. Surveys can also systematically miss<br />
parts of <strong>the</strong> population that are difficult to reach.<br />
All <strong>the</strong>se considerations caution against drawing sweeping<br />
policy conclusions. The UIS emphasizes that its technical work<br />
comparing household survey and administrative data does not<br />
provide a basis for revising estimates of out-of-school children.<br />
What is clear is that important issues are at stake — and that<br />
more work is needed to clarify <strong>the</strong> real picture with respect<br />
The model explores <strong>the</strong> importance of gender,<br />
income and location in determining whe<strong>the</strong>r or<br />
not children are in school. These categories of<br />
disadvantage interact with each o<strong>the</strong>r and with<br />
wider factors – such as language, ethnicity and<br />
disability – to create multiple barriers to school<br />
entry and survival. <strong>Chapter</strong> 3 explores <strong>the</strong> wider<br />
factors and <strong>the</strong>ir interactions in detail.<br />
Young girls. Disparities between boys and girls<br />
are narrowing, but females still accounted for<br />
54% of <strong>the</strong> global out-of-school population in<br />
2007. Gender parity would cut <strong>the</strong> number of<br />
girls out of school by over 6 million. Gender<br />
disadvantage is most pronounced in <strong>the</strong> Arab<br />
States, Central Asia, and South and West Asia.<br />
In Pakistan, girls accounted for 60% of out-ofschool<br />
children in 2006.<br />
Children from poor households. Parental wealth<br />
strongly influences prospects of being out of school.<br />
Low average income in many of <strong>the</strong> countries with<br />
large out-of-school populations means that poverty<br />
extends far beyond <strong>the</strong> poorest 20%. However,<br />
as evidence from household surveys shows, <strong>the</strong><br />
poorest face distinctive problems. In India, children<br />
58
PROGRESS TOWARDS THE <strong>EFA</strong> GOALS<br />
Universal primary education<br />
Figure <strong>2.</strong>9: Different stories — administrative and household<br />
measurement of children in school can differ greatly<br />
Differences between net enrolment ratio (administrative data)<br />
and net attendance rate (household surveys), selected countries,<br />
latest available year<br />
U. R. Tanzania<br />
Guinea<br />
Mozambique<br />
Benin<br />
Mali<br />
Ethiopia<br />
Uganda<br />
Malawi<br />
India<br />
Zambia<br />
Senegal<br />
Madagascar<br />
Peru<br />
Rwanda<br />
Liberia<br />
Burkina Faso<br />
Niger<br />
Pakistan<br />
Philippines<br />
Zimbabwe<br />
Swaziland<br />
Kenya<br />
Nigeria<br />
Ghana<br />
Cameroon<br />
D. R. Congo<br />
Namibia<br />
Lesotho<br />
Congo<br />
Rates are lower<br />
for household<br />
survey data<br />
Rates are higher<br />
for household<br />
survey data<br />
-30 -20 -10 0 10 20 30 40<br />
% point difference between household survey<br />
and administrative data<br />
Sources: Bruneforth (2009a).<br />
to <strong>the</strong> core issue in universal primary education: namely,<br />
how many children are really out of school. There is strong<br />
evidence that administrative data routinely overestimate<br />
net enrolment by a considerable margin. In a separate review<br />
of <strong>the</strong> twenty-nine countries covered by <strong>the</strong> UIS study,<br />
this Report estimates that, if <strong>the</strong> household survey data<br />
are accurate:<br />
Figure <strong>2.</strong>10: In Senegal, estimates of children in school<br />
by age vary with data sources<br />
Age-specific enrolment and attendance rates, Senegal, 2006<br />
Children in school (%)<br />
90<br />
80<br />
70<br />
60<br />
50<br />
40<br />
30<br />
20<br />
10<br />
0<br />
77%<br />
5 6 7 8 9 10 11 12 13 14 15 16 17 18 19 20 21 22 23 24<br />
Source: Bruneforth (2009a).<br />
58%<br />
<strong>the</strong> out-of-school population in <strong>the</strong>se countries would<br />
be 66 million, ra<strong>the</strong>r than <strong>the</strong> 44 million reported in<br />
administrative data;<br />
<strong>the</strong> out-of-school population in India would be 16 million<br />
higher, more than twice <strong>the</strong> administrative data total;<br />
in sub-Saharan Africa, Ethiopia and <strong>the</strong> United Republic<br />
of Tanzania would each have more than 1.8 million<br />
additional children out of school, Mozambique around<br />
600,000 and Uganda over 800,000.<br />
Source: Bruneforth (2009a).<br />
51%<br />
33%<br />
Age in years<br />
Household survey<br />
Administrative data<br />
from <strong>the</strong> poorest 20% were over three times<br />
more likely to be out of school than children from<br />
<strong>the</strong> richest 20% in 2005 (Bruneforth, 2009b).<br />
Rural children. Living in a rural area often puts<br />
children at greater risk of being out of school. In<br />
Burkina Faso, Cameroon, Ethiopia, Malawi, <strong>the</strong><br />
Niger, Senegal and Zambia, household survey data<br />
suggest that rural children are more than twice<br />
as likely not to be in school (Bruneforth, 2009b).<br />
Many of those currently not in primary school will<br />
probably never enrol. On <strong>the</strong> basis of past evidence<br />
and <strong>the</strong> UIS model, an estimated 44% of out-ofschool<br />
children are unlikely to make <strong>the</strong> transition<br />
into school (Figure <strong>2.</strong>11). These 31 million children<br />
face <strong>the</strong> most acute disadvantages in education.<br />
The problem is most pronounced in sub-Saharan<br />
Africa, where 59% of <strong>the</strong> out-of-school population<br />
is unlikely to enrol. In South and West Asia, by<br />
contrast, dropout is a more serious problem.<br />
More than 60% of <strong>the</strong> out-of-school population<br />
has dropped out, while one-third is unlikely ever<br />
to enter. Almost half of <strong>the</strong> much smaller out-ofschool<br />
population in <strong>the</strong> Arab States is unlikely to<br />
enter. In East Asia and <strong>the</strong> Pacific, <strong>the</strong> problem is<br />
59
1<br />
0<br />
0<br />
CHAPTER 2<br />
2<br />
Education for All Global Monitoring Report<br />
In sub-Saharan<br />
Africa, almost<br />
12 million girls<br />
are expected<br />
never to enrol<br />
Nigeria<br />
India<br />
Pakistan<br />
Ethiopia<br />
Bangladesh<br />
Niger<br />
Philippines<br />
Burkina Faso<br />
Mozambique<br />
Ghana<br />
Yemen<br />
Brazil<br />
Kenya<br />
Mali<br />
Nepal<br />
Turkey<br />
South Africa<br />
Iraq<br />
Indonesia<br />
Senegal<br />
Figure <strong>2.</strong>11: Children in sub-Saharan Africa<br />
are <strong>the</strong> least likely to enter school<br />
Distribution of out-of-school children by school exposure,<br />
by region, 2007<br />
World<br />
Developing countries<br />
Developed countries<br />
Countries in transition<br />
N. America/W. Europe<br />
East Asia/Pacific<br />
Latin America/Caribbean<br />
South and West Asia<br />
Central Asia<br />
Arab States<br />
Central/East. Europe<br />
Sub-Saharan Africa<br />
Source: UIS (2009a).<br />
0 20 40 60 80 100<br />
% of total number of out-of-school children<br />
Expected never<br />
to enrol<br />
Enrolled but<br />
dropped out<br />
Expected to<br />
enrol late<br />
Figure <strong>2.</strong>12: A child’s prospects of entering and staying in school vary by country<br />
Distribution of out-of-school children by school exposure, selected countries, most recent year<br />
Expected<br />
never to enrol<br />
Enrolled but<br />
dropped out<br />
Expected<br />
to enrol late<br />
Total<br />
0 2 000 4 000 6 000 8 000 10 000<br />
overwhelmingly one of late entry, though close to<br />
one in five out-of-school children is unlikely even<br />
to enter school.<br />
Country profiles mirror <strong>the</strong> regional differences<br />
(Figure <strong>2.</strong>12). In four of <strong>the</strong> ten countries in sub-<br />
Saharan Africa with large out-of-school populations<br />
– Burkina Faso, Mali, <strong>the</strong> Niger and Senegal – more<br />
than 70% of out-of-school children are expected<br />
never to enrol. 8 In Pakistan, almost half of <strong>the</strong><br />
out-of-school population is unlikely to enrol. The<br />
pattern is not restricted to low-income countries.<br />
One of <strong>the</strong> most striking results to emerge is <strong>the</strong><br />
profile of out-of-school children in Turkey, where<br />
seven out of ten are unlikely to enter school.<br />
For countries including Bangladesh, India, Indonesia<br />
and Nepal, <strong>the</strong> big challenge is keeping children<br />
in school once <strong>the</strong>y enrol. Identifying patterns of<br />
exclusion are important for public policy design –<br />
<strong>the</strong> approaches needed to ensure that children not<br />
expected to enrol have a chance to enter school<br />
are likely to differ from those addressing <strong>the</strong><br />
constraints facing children at risk of dropout.<br />
How do <strong>the</strong> three markers for disadvantage –<br />
gender, wealth and location – shape prospects<br />
that out-of-school children will ever enrol?<br />
Young girls face some of <strong>the</strong> highest barriers.<br />
Not only are <strong>the</strong>y less likely than boys to be in<br />
school, but those who are out of school are far<br />
more likely than boys never to enter (Figure <strong>2.</strong>13).<br />
In sub-Saharan Africa, almost 12 million girls are<br />
expected never to enrol, compared with 7 million<br />
boys. Countries in o<strong>the</strong>r regions face similar<br />
problems. In Yemen, nearly 80% of out-of-school<br />
girls are unlikely ever to enrol, compared with 36%<br />
of boys; in Pakistan <strong>the</strong> figures are 62% for girls<br />
and 27% for boys. Gender disadvantages can cut in<br />
<strong>the</strong> o<strong>the</strong>r direction: in Bangladesh, Brazil and South<br />
Africa, it is more likely that boys will never enrol.<br />
However, it is clear that more rapid progress in<br />
getting children into school will require measures<br />
that target <strong>the</strong> social, economic and cultural<br />
barriers facing young girls.<br />
Number of out-of-school children (000)<br />
Notes: Countries included had more than 500,000 children out of school in 2007 or <strong>the</strong> latest year available.<br />
For Iraq, Mozambique and Nigeria <strong>the</strong> breakdown is not available.<br />
Source: Bruneforth (2009b).<br />
Prospects for attending school are also heavily<br />
conditioned by household location and wealth.<br />
Children from rural areas are at a particular<br />
disadvantage (Figure <strong>2.</strong>14). In Burkina Faso, rural<br />
children are almost four times more likely than<br />
8. Nigeria could be in a similar situation, but disaggregated data<br />
are not available.<br />
60
PROGRESS TOWARDS THE <strong>EFA</strong> GOALS<br />
Universal primary education<br />
Figure <strong>2.</strong>13: Left behind: out-of-school girls are less likely<br />
ever to get into school<br />
% of out-of-school children who are expected never to enrol,<br />
by gender, selected countries, 2007<br />
Figure <strong>2.</strong>14: Poor and rural children have much less chance of going to school<br />
in Burkina Faso and Ethiopia<br />
School exposure of out-of-school children by location and wealth, Burkina Faso (2003)<br />
and Ethiopia (2005)<br />
Mali<br />
Niger<br />
Senegal<br />
Burkina Faso<br />
Turkey<br />
Yemen<br />
Ghana<br />
Pakistan<br />
Ethiopia<br />
Bangladesh<br />
India<br />
Nepal<br />
South Africa<br />
Kenya<br />
100<br />
Burkina Faso<br />
100<br />
Ethiopia<br />
% of primary school age children<br />
80<br />
60<br />
40<br />
20<br />
In school<br />
Expected<br />
to enter late<br />
Enrolled but<br />
dropped out<br />
Expected<br />
never to enrol<br />
% of primary school age children<br />
80<br />
60<br />
40<br />
20<br />
Boys<br />
Girls<br />
0<br />
Rural<br />
Urban<br />
0<br />
Poorest 20% Richest 20%<br />
0 20 40 60 80 100<br />
% of out-of-school children expected never to enrol<br />
Source: Bruneforth (2009b).<br />
Notes: Countries included had more than 500,000 children out of school in 2007.<br />
Source: Bruneforth (2009b).<br />
urban children to be out of school – and those not<br />
in classrooms are over four times less likely ever<br />
to go to school. These disparities reflect some of<br />
<strong>the</strong> distinctive problems facing rural communities,<br />
including distance to school, poverty and gender<br />
disadvantages.<br />
Poverty strongly influences prospects for school<br />
entry. Children from <strong>the</strong> poorest 20% of households<br />
dominate <strong>the</strong> out-of-school populations in many<br />
countries and are far less likely than higher-income<br />
children ever to enrol. To take one example, around<br />
three-quarters of children from <strong>the</strong> poorest 20% of<br />
households in Ethiopia are not in school. Of <strong>the</strong>se,<br />
over half are not expected to enter school<br />
(Figure <strong>2.</strong>14). The heightened risk of never going<br />
to school associated with low household wealth<br />
underlines <strong>the</strong> importance of public policies to<br />
ensure that poverty does not automatically lead<br />
to educational disadvantage.<br />
Enrolment of school age children<br />
moving too slowly<br />
Getting children into school is just one of <strong>the</strong><br />
stepping stones <strong>towards</strong> universal primary<br />
education. As many children will drop out before<br />
completing <strong>the</strong> primary cycle as are currently out<br />
of school. The critical challenge is not just getting<br />
children into school but ensuring that, once <strong>the</strong>re,<br />
<strong>the</strong>y complete a good-quality education.<br />
Universal primary education is easily identified<br />
after <strong>the</strong> event. It exists when almost all primary<br />
school age children graduate at roughly <strong>the</strong> official<br />
age. Measuring progress <strong>towards</strong> this goal is<br />
more challenging. No single indicator provides<br />
<strong>the</strong> complete picture, but a combination of<br />
measures can help cast light on different parts<br />
of a complicated picture. Overall, <strong>the</strong>re is clear<br />
evidence that school enrolment and completion<br />
are increasing across <strong>the</strong> world, but a narrow<br />
focus on certain indicators may be leading to an<br />
underestimation of <strong>the</strong> distance still to be travelled<br />
to achieve universal primary education.<br />
Net enrolment ratios have been rising<br />
in <strong>the</strong> developing world<br />
One commonly used indicator, <strong>the</strong> net enrolment<br />
ratio, measures <strong>the</strong> proportion of students in <strong>the</strong><br />
official primary school age group who are enrolled<br />
in school. In a system that has achieved universal<br />
primary education, <strong>the</strong> vast majority of children in<br />
<strong>the</strong> official age group will be in primary school.<br />
Universal net enrolment, widely used as a measure<br />
of progress <strong>towards</strong> Goal 2, is a necessary but not<br />
sufficient condition for universal primary<br />
completion. Countries with a net enrolment ratio<br />
close to 100% have most of <strong>the</strong>ir primary school<br />
age children in <strong>the</strong> school system, but <strong>the</strong> measure<br />
does not indicate where children are in <strong>the</strong> cycle.<br />
Some children may have dropped out and returned<br />
to early grades, while o<strong>the</strong>rs may be repeating<br />
grades having failed school tests.<br />
The critical<br />
challenge is<br />
to ensure all<br />
children complete<br />
a good-quality<br />
education<br />
61
0<br />
0<br />
1<br />
CHAPTER 2<br />
2<br />
Education for All Global Monitoring Report<br />
Since 1999,<br />
sub-Saharan<br />
Africa and South<br />
and West Asia<br />
have increased<br />
net enrolment<br />
ratios at five<br />
times and three<br />
times <strong>the</strong> rate<br />
of <strong>the</strong> 1990s,<br />
respectively<br />
For all its limitations, <strong>the</strong> net enrolment ratio is<br />
useful in providing an average picture of progress<br />
over time. That picture has been positive since<br />
<strong>the</strong> Dakar forum. Most developing countries that<br />
started <strong>the</strong> current decade a long way from<br />
universal primary enrolment have made significant<br />
strides (Table <strong>2.</strong>2). Since 1999, sub-Saharan Africa<br />
and South and West Asia have increased net<br />
enrolment ratios at five times and three times<br />
<strong>the</strong> rate of <strong>the</strong> 1990s, respectively, reaching 73%<br />
and 86% in 2007. However, regional aggregates<br />
inevitably mask large intraregional differences.<br />
Sub-Saharan Africa has a particularly wide range<br />
of net enrolment ratios, from 31% in Liberia to 98%<br />
in Madagascar and <strong>the</strong> United Republic of Tanzania.<br />
In <strong>the</strong> Arab States, <strong>the</strong> spread extends from less<br />
than 45% in Djibouti to 75% in Yemen and over 95%<br />
in Bahrain and Egypt (Annex, Statistical Table 5).<br />
<strong>Progress</strong> on enrolment has been uneven<br />
Global progress <strong>towards</strong> universal net enrolment<br />
masks a more complex picture. Countries are<br />
moving forwards at different rates, some are not<br />
moving – and o<strong>the</strong>rs are moving backwards.<br />
Figure <strong>2.</strong>15 provides a summary progress report.<br />
Some countries have achieved extraordinary<br />
advances. The United Republic of Tanzania raised<br />
its net enrolment ratio from around 50% in 1999<br />
to 98% in 2006. Madagascar, Nicaragua and Zambia<br />
have also broken through <strong>the</strong> 90% threshold<br />
<strong>towards</strong> universal primary enrolment. Benin started<br />
out in 1999 with one of <strong>the</strong> world’s lowest net<br />
enrolment ratios and could now be on track for<br />
universal primary enrolment by 2015. As <strong>the</strong><br />
education system expands, however, <strong>the</strong> challenge<br />
of extending opportunities to populations that are<br />
hard to reach will intensify (Box <strong>2.</strong>6). Some of <strong>the</strong><br />
countries fur<strong>the</strong>st from breaking through <strong>the</strong> 90%<br />
barrier <strong>towards</strong> universal net enrolment have<br />
none<strong>the</strong>less moved a long way, including Burkina<br />
Faso, Ethiopia and <strong>the</strong> Niger.<br />
Past net enrolment trends provide a limited<br />
indicator of <strong>the</strong> potential for countries to achieve<br />
universal primary completion. As Figure <strong>2.</strong>15<br />
demonstrates, very rapid progress on net<br />
enrolment is possible. However, countries with<br />
current net enrolment ratios of less than 75% face<br />
very steep challenges. Ensuring that all primary<br />
school age children progress through <strong>the</strong><br />
education system is even more challenging,<br />
especially when schools are dealing with a large<br />
backlog of over-age children.<br />
Several countries in sub-Saharan Africa have<br />
tailored <strong>the</strong>ir ambitions to current circumstances.<br />
Burkina Faso’s original goal of attaining universal<br />
Table <strong>2.</strong>2: Primary enrolment by region, 1999 and 2007<br />
Total enrolment<br />
Net enrolment ratios Gender parity in primary 1<br />
World<br />
Developing countries<br />
Developed countries<br />
Countries in transition<br />
Sub-Saharan Africa<br />
Arab States<br />
Central Asia<br />
East Asia and <strong>the</strong> Pacific<br />
East Asia<br />
Pacific<br />
South and West Asia<br />
Latin America and <strong>the</strong> Caribbean<br />
Caribbean<br />
Latin America<br />
North America and Western Europe<br />
Central and Eastern Europe<br />
School year ending in School year ending in School year ending in<br />
1999<br />
2007<br />
1999 2007 1999<br />
2007<br />
(millions)<br />
(%) (F/M)<br />
646 694 82 87 0.92 0.96<br />
559 615 80 86 0.91 0.95<br />
70 66 97 96 1.00 1.00<br />
16 13 88 91 0.99 0.99<br />
82 124 56 73 0.85 0.90<br />
35 41 78 84 0.87 0.90<br />
7 6 88 92 0.99 0.98<br />
218 191 96 94 0.99 0.99<br />
214 188 96 94 0.99 0.99<br />
3 3 90 84 0.97 0.97<br />
155 192 74 86 0.84 0.95<br />
70 68 92 93 0.97 0.97<br />
3 2 75 72 0.98 0.99<br />
68 66 93 94 0.97 0.96<br />
53 51 97 95 1.01 1.00<br />
26 21 91 92 0.96 0.98<br />
1. Gender parity in primary education is measured by <strong>the</strong> gender parity index of gross enrolment ratios. See annex for details.<br />
Source: Annex, Statistical Table 5.<br />
62
PROGRESS TOWARDS THE <strong>EFA</strong> GOALS<br />
Universal primary education<br />
Figure <strong>2.</strong>15: Most countries improved <strong>the</strong>ir primary school enrolment between 1999 and 2007<br />
Change in net enrolment ratios in primary education, 1999–2007<br />
100<br />
90<br />
Net enrolment ratios<br />
have progressed<br />
since 1999<br />
U. R. Tanzania<br />
Bhutan<br />
Kenya<br />
Madagascar<br />
Zambia<br />
Morocco<br />
S. Tome/Principe<br />
Nicaragua<br />
Guatemala<br />
Iran, Isl. Rep.<br />
Venezuela, B. R.<br />
Swaziland<br />
Cambodia<br />
Zimbabwe<br />
Lao PDR<br />
Botswana<br />
Brazil<br />
Mongolia<br />
Latvia<br />
Colombia<br />
Vanuatu Malawi<br />
Hungary South Africa<br />
Cape Verde<br />
Dominican Rep.<br />
Egypt<br />
80<br />
Benin<br />
Mauritania<br />
Nepal<br />
Net enrolment ratios in primary eudcation in 2007 (%)<br />
70<br />
60<br />
50<br />
Ethiopia<br />
Burkina Faso<br />
Guinea<br />
Mozambique<br />
Yemen<br />
Ghana<br />
Senegal Lesotho<br />
Mali<br />
Nigeria<br />
Gambia<br />
Togo<br />
Oman<br />
Cook Islands<br />
Palestinian A. T.<br />
Equat. Guinea<br />
Niger<br />
Djibouti<br />
40<br />
Eritrea<br />
30<br />
Liberia<br />
Net enrolment ratios<br />
have deteriorated<br />
since 1999<br />
20<br />
20 30 40 50 60 70 80 90 100<br />
Source: Annex, Statistical Table 5.<br />
Net enrolment ratios in primary education in 1999 (%)<br />
primary enrolment by 2015 has been revised<br />
downwards in national plans to 70% (Bennell, 2009).<br />
Eritrea’s current education strategy neatly<br />
summarizes <strong>the</strong> dilemma facing planners:<br />
‘achievement of universal primary education by<br />
<strong>the</strong> global target date of 2015 would be extremely<br />
difficult. Even if <strong>the</strong> financial resources were readily<br />
available, it would be physically almost impossible<br />
to provide <strong>the</strong> necessary infrastructure and<br />
associated inputs (teachers, administrators, etc.)<br />
during <strong>the</strong> next eleven years to cater for all<br />
children of primary school age. … In view of this,<br />
it is projected that <strong>the</strong> net primary school<br />
enrolment ratio would reach 82% by 2015 and<br />
that UPE would be achieved by 2019’ (Eritrea<br />
Ministry of National Development, 2005, p.10).<br />
63
0<br />
0<br />
1<br />
CHAPTER 2<br />
2<br />
Education for All Global Monitoring Report<br />
Twenty-eight<br />
countries have<br />
still not achieved<br />
<strong>the</strong> 2005 goal<br />
of gender parity<br />
in primary<br />
schooling<br />
Box <strong>2.</strong>6: Benin — on <strong>the</strong> right track, but tackling marginalization is a priority<br />
Benin has been among <strong>the</strong> world’s fastest moving<br />
countries on primary enrolment, with <strong>the</strong> net<br />
enrolment ratio rising from 50% in 1999 to 80%<br />
in 2007. The gender gap also narrowed, from just<br />
67 girls for every 100 boys in school in 1999 to<br />
83 girls in 2006. On current trends, Benin could<br />
achieve universal primary enrolment by 2015.<br />
Maintaining <strong>the</strong> trends will be difficult, however.<br />
As in o<strong>the</strong>r countries, rapid progress in scaling up<br />
enrolment has brought new policy challenges:<br />
Raising completion rates. Achieving Benin’s goal<br />
of 100% primary school completion by 2015 will<br />
require far-reaching measures to ensure that<br />
children enrol on time and complete a full primary<br />
cycle. Over-age entry remains a significant problem.<br />
The gross intake rate into <strong>the</strong> first grade is 115%,<br />
while in 2005 <strong>the</strong> net intake rate was less than<br />
50%. The disparity points to a concentration of<br />
children over 6 years of age in <strong>the</strong> first grade.<br />
Getting children into school on time is important<br />
for increasing completion. Fewer than 20% of those<br />
who start school complete it at <strong>the</strong> correct age.<br />
Addressing population pressures. With a population<br />
growth rate of 3.2% and almost half of <strong>the</strong><br />
population under 15 years, Benin’s education system<br />
will need to expand just to stay in <strong>the</strong> same<br />
position.<br />
Reducing regional disparities. There are marked<br />
inequalities across Benin. The gross intake rate<br />
for <strong>the</strong> last grade of primary is only 36% in Alibori<br />
Province (one of <strong>the</strong> poorest regions, with<br />
particularly high levels of severe malnutrition for<br />
children under 5) compared with a national average<br />
of 66%. Reaching vulnerable communities is vital<br />
to sustained progress.<br />
Tackling poverty. More than half of Benin’s rural<br />
population lives in extreme poverty. Children from<br />
<strong>the</strong> wealthiest quintile are at least twice as likely to<br />
complete <strong>the</strong> primary cycle as those in <strong>the</strong> poorest<br />
quintile. This has <strong>the</strong> effect of skewing education<br />
financing <strong>towards</strong> children from <strong>the</strong> richest 20% of<br />
households, who receive 57% of public expenditure<br />
on education compared with just 5% for <strong>the</strong> poorest.<br />
The government has taken steps in its ten-year<br />
education plan (2006–2015) to redress imbalances,<br />
including affirmative action for girls and<br />
disadvantaged groups and regions — and strong<br />
budget commitments. Education spending accounted<br />
for 3.9% of GNP and 18% of budget spending in 2006.<br />
Just over half of <strong>the</strong> education budget is directed to<br />
primary schooling. To ensure that Benin can go <strong>the</strong><br />
final step <strong>towards</strong> universal primary education,<br />
international aid donors need to back up this national<br />
financing commitment.<br />
Sources: World Bank (2009g); Benin Government (2008).<br />
Does <strong>the</strong> scaling down of ambitions mark<br />
an unwarranted retreat from <strong>the</strong> political<br />
commitments made at Dakar? Each country has<br />
to assess what is achievable in <strong>the</strong> light of where<br />
it currently stands, and <strong>the</strong> human and financial<br />
resources it has available. However, <strong>the</strong>re is<br />
strong evidence from several countries that<br />
political commitment allied to strong aid<br />
partnerships can generate rapid progress.<br />
Gender parity — some progress<br />
but a long way to go<br />
The expansion of primary education has gone<br />
hand in hand with progress <strong>towards</strong> greater<br />
gender parity, but <strong>the</strong>re are marked differences<br />
across and within regions, as witnessed by <strong>the</strong><br />
gender parity index (GPI).<br />
Twenty-eight countries had GPIs of less than 0.90 in<br />
2007; of <strong>the</strong>se, eighteen are in sub-Saharan Africa.<br />
These countries have not yet achieved <strong>the</strong> goal of<br />
gender parity in primary schooling, set for 2005.<br />
There are also marked gender disparities in <strong>the</strong><br />
Arab States, though <strong>the</strong> largest gap is found in a<br />
South Asian country: Afghanistan, with just 63 girls<br />
enrolled in school for every 100 boys. Large gender<br />
disparities are inconsistent with sustained rapid<br />
progress <strong>towards</strong> universal primary enrolment.<br />
In countries at low levels of enrolment, such as<br />
Burkina Faso, Ethiopia and Yemen, moves <strong>towards</strong><br />
gender parity from a low starting point have helped<br />
generate large increases in primary enrolment.<br />
The experience of Yemen demonstrates that rapid<br />
progress <strong>towards</strong> gender parity from a low base<br />
is possible and that sustained progress requires<br />
a strong political commitment to equity (Box <strong>2.</strong>7).<br />
Gender parity is usually inversely related to<br />
enrolment: <strong>the</strong> lower <strong>the</strong> enrolment, <strong>the</strong> greater<br />
<strong>the</strong> gender disparity (Figure <strong>2.</strong>16). An exception<br />
is Senegal; while <strong>the</strong> country still has low net<br />
enrolment (72% in 2007), in <strong>the</strong> space of one<br />
primary school generation, <strong>the</strong> country has moved<br />
from a gender parity index of 86 girls per 100 boys<br />
64
PROGRESS TOWARDS THE <strong>EFA</strong> GOALS<br />
Universal primary education<br />
Figure <strong>2.</strong>16: The relationship between enrolment and gender parity varies across countries<br />
Net enrolment ratios and gender parity in primary education, 2007<br />
100<br />
Gender<br />
parity<br />
Net enrolment ratios (%)<br />
90<br />
80<br />
70<br />
60<br />
Higher enrolment<br />
C. A. R.<br />
Yemen<br />
Mali<br />
Iraq<br />
Benin<br />
Pakistan<br />
Togo<br />
Mozambique<br />
Guinea<br />
Nigeria<br />
Ethiopia<br />
Burkina Faso<br />
Morocco<br />
Lao PDR<br />
Cambodia<br />
India<br />
Swaziland<br />
Cape Verde<br />
Dominican Rep.<br />
Burundi<br />
Grenada<br />
Antigua/Barbuda<br />
Equat. Guinea<br />
Timor-Leste<br />
Congo<br />
Ghana<br />
Senegal<br />
Oman<br />
Nepal<br />
Malawi<br />
Mauritania<br />
Turks/Caicos Is<br />
Nauru<br />
Gambia<br />
Bangladesh<br />
50<br />
Niger<br />
Djibouti<br />
40<br />
Eritrea<br />
30<br />
Liberia<br />
Girls<br />
disadvantaged<br />
Boys<br />
disadvantaged<br />
20<br />
0.60 0.70 0.80 0.90 1.00 1.10<br />
Gender parity index<br />
Note: Gender parity in primary education is measured by <strong>the</strong> gender parity index of gross enrolment ratios. See annex for details.<br />
Source: Annex, Statistical Table 5.<br />
in 1999 to an equal number of girls and boys in<br />
2007. However, not all progress <strong>towards</strong> gender<br />
parity has positive origins. In Equatorial Guinea,<br />
Liberia and Togo, greater parity has been driven not<br />
by expansion of <strong>the</strong> education system but by <strong>the</strong> fact<br />
that boys’ enrolment has declined (Figure <strong>2.</strong>17).<br />
With some of <strong>the</strong> world’s largest gender gaps,<br />
several countries in West Africa have adopted<br />
policies aimed at streng<strong>the</strong>ning parity as part of<br />
<strong>the</strong> wider strategy for achieving universal primary<br />
education. Some of <strong>the</strong>se policies focus on<br />
removing one of <strong>the</strong> greatest obstacles to gender<br />
equity: attitudes on girls’ and women’s place in<br />
society. Working through village heads and religious<br />
leaders, governments have mounted campaigns<br />
to communicate to parents <strong>the</strong> importance of<br />
educating daughters. O<strong>the</strong>r strategies include<br />
paying financial incentives, providing water and<br />
sanitation in schools (including separate latrines<br />
for boys and girls), recruiting female teachers and<br />
providing incentives for <strong>the</strong>ir deployment to rural<br />
areas, and giving teachers gender sensitization<br />
training (UNESCO-IIEP, 2009). In remote rural<br />
areas, distance to school is often a major security<br />
concern for parents of young girls. Governments<br />
Senegal reached<br />
gender parity<br />
in 2007 in <strong>the</strong><br />
space of one<br />
primary school<br />
generation<br />
65
0<br />
0<br />
1<br />
CHAPTER 2<br />
2<br />
Education for All Global Monitoring Report<br />
Figure <strong>2.</strong>17: The gender gap is narrowing, but sometimes because enrolment<br />
is declining<br />
Changes in net enrolment ratios and gender parity index of gross enrolment ratios<br />
in primary education, 1999–2007, selected countries<br />
Net enrolment ratios (%)<br />
100<br />
90<br />
80<br />
70<br />
60<br />
50<br />
40<br />
30<br />
20<br />
Yemen<br />
Ethiopia<br />
Equat. Guinea<br />
Togo<br />
Lesotho<br />
0.5 0.6 0.7 0.8 0.9 1.0 1.1<br />
1999<br />
1999<br />
Benin<br />
Mali<br />
Liberia<br />
Burkina<br />
Faso<br />
Niger<br />
Gender parity index<br />
Senegal<br />
Gender<br />
parity<br />
2007 The country has improved both participation and gender parity<br />
2007 The country has improved gender parity but participation has deteriorated<br />
Note: Gender parity in primary education is measured by <strong>the</strong> gender parity index of gross enrolment ratios.<br />
See annex for details.<br />
Source: Annex, Statistical Table 5.<br />
have responded by attempting to bring classrooms<br />
closer to communities, often by building satellite<br />
schools (see <strong>Chapter</strong> 3).<br />
Box <strong>2.</strong>7: Yemen — making progress <strong>towards</strong><br />
In Yemen, one of <strong>the</strong> world’s poorest countries,<br />
enrolment increased from <strong>2.</strong>3 million in 1999 to<br />
3.2 million in 2005 and gender disparities shrank.<br />
These achievements are all <strong>the</strong> more remarkable<br />
given Yemen’s deep poverty, rapid population<br />
growth and dispersed rural population.<br />
Girls have benefited from both <strong>the</strong> overall expansion<br />
of education and targeted interventions. Improvement<br />
in enrolment in recent years can be traced to policy<br />
measures introduced in <strong>the</strong> late 1990s, including <strong>the</strong><br />
use of low-cost standardized school designs and<br />
consultation with communities on school location.<br />
Basic education (grades 1 to 9) has been compulsory<br />
and free in principle since <strong>the</strong> early 1990s, though<br />
learners continued to pay for uniforms and textbooks.<br />
In 2006/2007 <strong>the</strong> Ministry of Education made<br />
uniforms optional and eliminated textbook fees for<br />
girls in grades 1 to 6 and for boys in grades 1 to 3.<br />
It has also taken measures to get more female<br />
teachers in rural schools.<br />
Fur<strong>the</strong>r progress will require policy measures that<br />
weaken <strong>the</strong> interaction between gender inequality<br />
and poverty. School attendance is lowest, and <strong>the</strong><br />
gender gap widest, among <strong>the</strong> poor and in rural areas<br />
(Figure <strong>2.</strong>18). Of <strong>the</strong> more than 900,000 primary<br />
school age children out of school in 2005, 70% were<br />
girls and 88% lived in rural areas. Household survey<br />
data show that only 28% of girls and 46% of boys in<br />
Getting girls into<br />
school demands<br />
concerted action<br />
to change<br />
attitudes and<br />
household labour<br />
practices<br />
Aid donors can play an important role in supporting<br />
efforts to overcome gender disparity. In Chad, a<br />
USAID-funded programme is addressing financial<br />
and cultural barriers to girls’ schooling by providing<br />
scholarships and backing community sensitization<br />
campaigns. Recognizing that attitudes cannot be<br />
changed through top-down directives, <strong>the</strong><br />
programme supports local agents for change,<br />
working through mo<strong>the</strong>rs’ associations, religious<br />
figures, local government and village leaders, and<br />
school officials to promote girls’ education. The role<br />
of imams in asserting <strong>the</strong> consistency of gender<br />
equality in education with <strong>the</strong> precepts of Islam has<br />
been particularly important (Zekas et al., 2009).<br />
Initiatives such as <strong>the</strong>se have helped make people<br />
more aware that girls have a right to be educated.<br />
They also contributed to Chad’s progress between<br />
1999 and 2007 in narrowing <strong>the</strong> gender gap from<br />
58 girls per 100 boys to 70, with greater gender<br />
parity helping drive an overall increase in<br />
enrolment.<br />
For many countries, sustained progress <strong>towards</strong><br />
gender parity will require advances on two fronts.<br />
Getting girls into school demands concerted action<br />
to change attitudes and household labour practices.<br />
Keeping <strong>the</strong>m in school once <strong>the</strong>y reach puberty<br />
poses ano<strong>the</strong>r layer of challenges, especially in<br />
countries where early marriage is common and<br />
where girls’ disadvantage interacts with o<strong>the</strong>r<br />
aspects of marginalization, such as poverty or<br />
ethnicity. Countries including Bangladesh and<br />
Cambodia have demonstrated that financial<br />
incentives can both increase <strong>the</strong> likelihood of girls<br />
entering lower secondary school and raise demand<br />
for primary schooling (Filmer and Schady, 2006;<br />
Fiszbein et al., 2009). However, public policy<br />
interventions are required in many o<strong>the</strong>r areas in<br />
education and beyond.<br />
In West Africa, some of <strong>the</strong> world’s poorest<br />
countries with low enrolment ratios have shown<br />
that political leadership and practical measures<br />
can override gender discrimination in <strong>the</strong> household<br />
66
PROGRESS TOWARDS THE <strong>EFA</strong> GOALS<br />
Universal primary education<br />
universal primary education and gender parity<br />
<strong>the</strong> poorest quintile attended school. Such evidence<br />
points to parental attitudes and household labour<br />
practices that attach less weight to girls’ education<br />
than that of boys.<br />
Figure <strong>2.</strong>18: In Yemen, girls’ enrolment is lowest in <strong>the</strong> poorest<br />
and rural areas<br />
Primary net attendance rates in Yemen, by gender, wealth and location, 2005<br />
Child labour patterns are also structured by gender<br />
disparities. Poverty drives both boys and girls into<br />
employment, ei<strong>the</strong>r because of household cash needs<br />
or because parents cannot afford education fees.<br />
Children of both sexes also spend time on household<br />
chores. Around one-fifth of boys and one-quarter of<br />
girls are involved in child labour. However, while 70%<br />
of male child labourers attend school, only 52% of<br />
females do. The disparity reflects longer work hours<br />
among girls, a division of labour that leaves girls with<br />
greater responsibility for household labour and a<br />
greater weight attached to boys’ education.<br />
The complex array of factors keeping children out<br />
of school in Yemen points to a need for a twin-track<br />
response. Education policies can broaden school<br />
infrastructure to reach more children and address<br />
gender inequality through financial incentives,<br />
recruitment of female teachers and o<strong>the</strong>r<br />
interventions. At <strong>the</strong> same time, wider strategies are<br />
needed to tackle rural poverty, curtail child labour and<br />
challenge attitudes that devalue <strong>the</strong> education of girls.<br />
Net attendance rates in primary education (%)<br />
80<br />
70<br />
60<br />
50<br />
40<br />
30<br />
20<br />
10<br />
0<br />
Boys<br />
Poorest<br />
20%<br />
Source: UNESCO-DME (2009).<br />
Q2 Q3 Q4 Richest<br />
20%<br />
Girls<br />
By wealth quintile<br />
National average<br />
By location<br />
Rural<br />
Urban<br />
Sources: Al-Mekhlafy (2008); Guarcello et al. (2006);<br />
Integrated Regional Information Networks (2006, 2007);<br />
Kefaya (2007); Ochse (2008).<br />
and beyond. By <strong>the</strong> same token, failure to narrow<br />
gender gaps points to failure in <strong>the</strong>se areas. With<br />
a higher income and comparable net enrolment<br />
ratio, Pakistan lags far behind Senegal on gender<br />
parity. Pakistan’s primary net enrolment ratio<br />
in 2006 was 73% for boys but only 57% for girls.<br />
If Pakistan were to match Senegal’s performance,<br />
it would have 1.1 million more girls in school.<br />
Pakistan’s persistent gender disparities, which<br />
may be exacerbated by political movements<br />
hostile to girls’ education, are holding back<br />
overall progress in enrolment (Box <strong>2.</strong>8). The<br />
threat to gender equity is even more marked in<br />
neighbouring Afghanistan, where schools and<br />
teachers have been targeted with a view to driving<br />
girls out of school (see <strong>Chapter</strong> 3).<br />
Gender disparity is not unidirectional. In a small<br />
number of developing countries, girls’ enrolment<br />
outstrips that of boys. This may happen where<br />
demand for boys’ labour is higher. To take one<br />
example, poor rural families in Lesotho, particularly<br />
those in highland areas, often rely on boys to herd<br />
cattle, with <strong>the</strong> result that dropout rates are high<br />
after grade 3 (World Bank, 2005e). The positive<br />
news is that <strong>the</strong> pace of increase in enrolment has<br />
been faster for boys in recent years and gender<br />
parity has now been achieved.<br />
Some countries are slipping or stagnating<br />
Positive global trends on net primary enrolment<br />
inevitably obscure negative national trends.<br />
Several countries with a long way to travel before<br />
<strong>the</strong>y achieve universal primary enrolment are<br />
not making progress – and some are registering<br />
reversals.<br />
Figure <strong>2.</strong>15 shows that some countries with low net<br />
enrolment ratios and large out-of-school populations<br />
– notably Nigeria – are moving in <strong>the</strong> right direction,<br />
but at a snail’s pace. More disconcertingly, around<br />
twenty-five developing countries with data for both<br />
1999 and 2007 experienced stagnating or declining<br />
net enrolment ratios. 9<br />
Between 1999<br />
and 2007, around<br />
twenty-five<br />
developing<br />
countries have<br />
experienced<br />
stagnating<br />
or declining net<br />
enrolment rates<br />
9. This trend is even more<br />
apparent in 2006–2007, with<br />
forty countries that have yet<br />
to achieve universal primary<br />
education not moving.<br />
67
1<br />
2<br />
0<br />
0<br />
CHAPTER 2<br />
Education for All Global Monitoring Report<br />
In Pakistan,<br />
only around<br />
one-third of poor<br />
girls are in school<br />
Box <strong>2.</strong>8: Pakistan — gender disparities hold back progress<br />
Pakistan is off track for achieving universal primary<br />
education by 2015. The country accounts for a<br />
significant share of <strong>the</strong> global out-of-school problem.<br />
Failure to tackle gender disadvantages that intersect<br />
with poverty and regional differences is at <strong>the</strong> heart<br />
of <strong>the</strong> problem.<br />
Deep disparities based on location and wealth are<br />
a feature of education in Pakistan. In <strong>the</strong> richest<br />
households, over 85% of children go to primary<br />
school, with little difference between boys and girls.<br />
Attendance rates for children from poor households<br />
are far lower, especially for females: only around onethird<br />
of poor girls are in school. Similarly, attendance<br />
is higher and <strong>the</strong> gender gap smaller in urban areas<br />
than in rural ones, and in <strong>the</strong> relatively wealthy Punjab<br />
province than in Balochistan and Sindh (Figure <strong>2.</strong>19).<br />
The North West Frontier Province stands out as<br />
having above average attendance for boys but well<br />
below average attendance for girls. There is growing<br />
concern that this gender gap could be widening<br />
fur<strong>the</strong>r. In <strong>the</strong> Taliban-occupied parts of <strong>the</strong> province,<br />
91 girls’ schools have been destroyed and<br />
25 damaged, with some boys’ schools also suffering.<br />
The factors behind Pakistan’s deep gender disparities<br />
have been extensively researched. Distance to school<br />
matters far more for girls than boys, reflecting<br />
security concerns and household labour demands.<br />
Figure <strong>2.</strong>19: Pakistan’s primary school attendance is marked by gender,<br />
regional and wealth inequalities<br />
Primary net attendance rates in Pakistan by gender, wealth, location and region, 2007<br />
Net attendance rates in primary education (%)<br />
90<br />
80<br />
70<br />
60<br />
50<br />
40<br />
30<br />
By wealth quintile By location By region<br />
Poorest<br />
20%<br />
Richest<br />
20%<br />
Rural<br />
Urban<br />
Balochistan Sindh<br />
Girls’ enrolment drops off sharply with each<br />
500-metre increase in distance from <strong>the</strong> closest<br />
school admitting girls and this ‘distance penalty’<br />
accounts for 60% of <strong>the</strong> gender gap in enrolments.<br />
Cost factors can also disadvantage girls because<br />
households tend to spend more on boys.<br />
The presence of a government school in <strong>the</strong><br />
community has a significant positive effect on girls’<br />
enrolment. As <strong>the</strong>re has been a marked trend <strong>towards</strong><br />
sex-segregated primary education, <strong>the</strong> absence in<br />
some areas of all-girl government schools has<br />
emerged as a major constraint on girls’ schooling.<br />
Insufficient recruitment of female teachers is ano<strong>the</strong>r<br />
constraint. Rural parents strongly prefer to have girls<br />
educated by women, but <strong>the</strong> legacy of low investment<br />
in girls’ education means few local women have<br />
appropriate qualifications. It is also difficult to attract<br />
qualified female teachers to rural areas from o<strong>the</strong>r<br />
parts of <strong>the</strong> country.<br />
Education policy documents increasingly recognize<br />
that more weight has to be attached to gender equity,<br />
but it is far from clear that <strong>the</strong> current policy<br />
framework provides concrete measures for translating<br />
statements into action. Policies indicate community<br />
needs as criteria for <strong>the</strong> location of new government<br />
primary schools, for example; however, research<br />
suggests that community economic status and <strong>the</strong><br />
extent of gender disparity have had little influence<br />
over <strong>the</strong> placement of new<br />
government schools.<br />
NWFP*<br />
Punjab<br />
Overall levels of public<br />
financing remain low,<br />
education is weakly integrated<br />
into national poverty<br />
reduction strategies and <strong>the</strong>re<br />
have been limited attempts to<br />
introduce <strong>the</strong> type of<br />
incentives for girls’ education<br />
that have been successful in<br />
Bangladesh, which has moved<br />
far ahead of Pakistan in terms<br />
of enrolment and gender<br />
parity.<br />
Sources: Aly and National Education<br />
Policy Review Team (2007); Andrabi<br />
et al. (2008); Lloyd et al. (2007);<br />
O’Malley (2009); Pakistan Ministry<br />
of Education (2003).<br />
Boys<br />
Girls<br />
National average<br />
* NWFP: North West Frontier Province.<br />
Source: UNESCO-DME (2009).<br />
68
PROGRESS TOWARDS THE <strong>EFA</strong> GOALS<br />
Universal primary education<br />
Adding in countries that lack enrolment data for<br />
both 1999 and 2007 would yield significantly more<br />
than twenty-five lagging countries. For example,<br />
for <strong>the</strong> Central African Republic and Pakistan,<br />
which had net enrolment ratios below 70% in 2007<br />
and no data for 1999, <strong>the</strong>re is strong evidence that<br />
progress has been limited. O<strong>the</strong>r countries have<br />
no data available on net enrolment for ei<strong>the</strong>r 1999<br />
or 2007, including Afghanistan, <strong>the</strong> Democratic<br />
Republic of <strong>the</strong> Congo, Haiti, Sierra Leone, Somalia<br />
and <strong>the</strong> Sudan. Here, too, <strong>the</strong>re is strong evidence<br />
to suggest that progress <strong>towards</strong> universal net<br />
enrolment, if any, has often been very slow, from a<br />
low base. Côte d’Ivoire, with a gross enrolment ratio<br />
of 72%, and <strong>the</strong> Sudan at 66% in 2007 are clearly<br />
off track. 10 Although Afghanistan’s gross enrolment<br />
ratio has increased significantly (from 28% in 1999<br />
to 103% in 2007), in part due to <strong>the</strong> opening up<br />
of opportunities for girls’ education, <strong>the</strong>re is still<br />
a long way to go before all children enter and<br />
complete <strong>the</strong> cycle on time. 11<br />
Many countries experiencing slow progress or<br />
reversals are ei<strong>the</strong>r in <strong>the</strong> midst of or recovering<br />
from conflict. Developments in Liberia have been<br />
particularly disconcerting. After a brutal civil war,<br />
<strong>the</strong> country has now enjoyed several years of<br />
peace and has an elected president, Ellen Sirleaf-<br />
Johnson, with a strong commitment to education.<br />
However, its net enrolment ratio slipped from 42%<br />
in 1999 to 31% in 2008. The government plan for<br />
education acknowledges that ‘realistically, Liberia<br />
will likely need more years beyond 2015 to achieve<br />
<strong>the</strong> UPE <strong>goals</strong>’ (Liberia Ministry of Education,<br />
2007b). How many more years will depend partly<br />
on national efforts and partly on <strong>the</strong> degree to<br />
which aid donors find innovative ways of supporting<br />
those efforts (Box <strong>2.</strong>9; see also <strong>Chapter</strong> 4). The<br />
large recorded decline in enrolment in <strong>the</strong><br />
Palestinian Autonomous Territories would also<br />
appear to be linked to <strong>the</strong> combined effects of<br />
civil conflict, military incursions, and restrictions<br />
on <strong>the</strong> movement of goods and people.<br />
Eritrea is a fur<strong>the</strong>r cause for concern. After<br />
significant progress increasing enrolment from<br />
1999 to 2006, <strong>the</strong> country experienced a reversal<br />
in 2007. 12 Military tensions appear to be a<br />
contributory factor. Since <strong>the</strong> end of <strong>the</strong> 1990s,<br />
spending on education has more than halved as<br />
a share of GNP, from 5.3% in 1999 to <strong>2.</strong>4% in 2006.<br />
Meanwhile, military spending has been extremely<br />
high, 13 crowding out urgently needed spending<br />
on education infrastructure.<br />
Box <strong>2.</strong>9: Liberia — slipping back in a post-conflict country<br />
Autocratic rule, coups and fourteen years of civil war took a devastating<br />
toll on Liberia’s education system. Schools were destroyed, public services<br />
collapsed, investment fell and parental fears over security led to children<br />
being withdrawn from school. The election of President Ellen Sirleaf-Johnson<br />
in 2006 created renewed hope, but recovery is proving arduous.<br />
Liberia is one of <strong>the</strong> world’s poorest countries: three-quarters of <strong>the</strong><br />
population survives on less than US$1.25 a day. Education infrastructure is<br />
dilapidated and <strong>the</strong>re are chronic shortages of trained teachers and teaching<br />
materials. As well as dealing with children who have enrolled since <strong>the</strong> end<br />
of <strong>the</strong> conflict, <strong>the</strong> education system must cope with population growth<br />
and <strong>the</strong> many displaced Liberian families returning from abroad.<br />
Data limitations make it difficult to chart developments, but fragile gains in<br />
enrolment at <strong>the</strong> end of <strong>the</strong> 1990s are thought to have been reversed during<br />
a renewal of violence from 2001 to 2003, with enrolment dropping by about<br />
half for girls and one-third for boys because of insecurity and poverty.<br />
In 2007, <strong>the</strong> Ministry of Education set out a strategy for moving from<br />
short-term emergency planning to long-term strategic planning. The<br />
strategy envisages streng<strong>the</strong>ning quality and equity, in part by providing<br />
a regulatory umbrella that covers <strong>the</strong> diversity of education providers.<br />
In 2008, some 30% of primary enrolment was in private and mission schools,<br />
<strong>the</strong> rest in government and community-funded schools. The equity challenge<br />
is particularly daunting, given <strong>the</strong> large inequalities based on wealth, region<br />
and gender.<br />
Liberia’s experience raises wider concerns about <strong>the</strong> failure of aid systems.<br />
In countries recovering from conflict, <strong>the</strong> resources available to government<br />
are limited, so aid has a vital role to play. Aid donors were slow to support<br />
reconstruction in Liberia, despite <strong>the</strong> endorsement of <strong>the</strong> country’s economic<br />
plan by <strong>the</strong> Fast Track Initiative. <strong>Chapter</strong> 4 explores <strong>the</strong> failure of current aid<br />
systems to respond to <strong>the</strong> needs of countries such as Liberia.<br />
Sources: Center for Global Development (2009); Liberia Ministry of Education (2007a);<br />
USAID (2007).<br />
Going <strong>the</strong> final mile — some countries<br />
with high net enrolment face problems<br />
Most of <strong>the</strong> countries facing difficulties in<br />
achieving universal net enrolment by 2015 have<br />
two characteristics in common. They started with<br />
low initial enrolment ratios and <strong>the</strong>y are very poor.<br />
There are exceptions to <strong>the</strong> rule. While enrolment<br />
ratios tend to rise with wealth, <strong>the</strong>re are large<br />
variations around <strong>the</strong> average – and some relatively<br />
wealthy countries perform worse than might be<br />
expected. Moreover, some countries are in grave<br />
danger of failing to achieve universal net enrolment<br />
by 2015 despite having started at very high levels<br />
of school participation.<br />
Figure <strong>2.</strong>20 demonstrates that wealth matters<br />
for education coverage. It charts <strong>the</strong> relationship<br />
between average income and net enrolment ratios,<br />
10. Because <strong>the</strong> gross<br />
enrolment ratio measures<br />
<strong>the</strong> enrolment of all children<br />
irrespective of <strong>the</strong>ir age<br />
relative to <strong>the</strong> primary school<br />
age group, <strong>the</strong> net enrolment<br />
ratio would be far lower.<br />
11. In 2007, <strong>the</strong> net intake<br />
rate into <strong>the</strong> primary system<br />
in Afghanistan was just 55%.<br />
1<strong>2.</strong> The net enrolment ratio<br />
rose from 33% in 1999 to<br />
47% in 2006, but fell back<br />
to 41% in 2007.<br />
13. Military expenditure is<br />
around one-quarter of GDP,<br />
according to <strong>the</strong> 2007/2008<br />
budget (UNDP, 2007).<br />
69
0<br />
0<br />
1<br />
CHAPTER 2<br />
2<br />
Education for All Global Monitoring Report<br />
Figure <strong>2.</strong>20: Most out-of-school children are in poorer countries, but some wealthier countries are underperforming<br />
Primary net enrolment ratios, GNP per capita and out-of-school children headcount in low and middle income countries, 2007<br />
Net enrolment ratios in primary education (%)<br />
100<br />
80<br />
40<br />
20<br />
Ethiopia<br />
Mali<br />
60<br />
Burkina Faso<br />
C. A. R.<br />
U. R. Tanzania<br />
Tajikistan<br />
Bangladesh<br />
Liberia<br />
Niger<br />
Eritrea<br />
Ghana<br />
Nigeria<br />
India<br />
Yemen<br />
Djibouti<br />
Indonesia<br />
Pakistan<br />
Philippines<br />
0<br />
0 2 000 4 000 6 000 8 000 10 000 12 000 14 000<br />
Notes: Bubble size represents <strong>the</strong> number of out-of-school children. Countries in red have more than 500,000 children out of school.<br />
Source: Annex, Statistical Tables 1 and 5.<br />
Egypt<br />
Dominican Rep.<br />
GNP per capita (PPP US$ 2007)<br />
Thailand<br />
Colombia<br />
Brazil<br />
South Africa<br />
Iran, Isl. Rep.<br />
Turkey<br />
5 million out-of-school children<br />
1 million out-of-school children<br />
500,000 out-of-school children<br />
The Philippines<br />
and Turkey<br />
perform less<br />
strongly than<br />
<strong>the</strong>ir national<br />
wealth predicts<br />
14. See <strong>Chapter</strong> 3<br />
for a fuller analysis<br />
of <strong>the</strong> reasons for<br />
<strong>the</strong> challenges facing<br />
<strong>the</strong> Philippines.<br />
while at <strong>the</strong> same time capturing <strong>the</strong> size of out-ofschool<br />
populations. There are many reasons for <strong>the</strong><br />
underlying positive relationship between enrolment<br />
and income. As countries grow wealthier, <strong>the</strong>y and<br />
<strong>the</strong>ir citizens can spend more on education – and as<br />
economies grow <strong>the</strong>y tend to generate demand for<br />
skilled labour. Of greater interest than <strong>the</strong> wellestablished<br />
average association is variation around<br />
<strong>the</strong> mean. At <strong>the</strong> lower end of <strong>the</strong> enrolment<br />
spectrum, countries such as Nigeria and Pakistan<br />
are outperformed by poorer countries such as<br />
Bangladesh and Ethiopia. At <strong>the</strong> higher end,<br />
countries including <strong>the</strong> Philippines, South Africa<br />
and Turkey perform less strongly than expected.<br />
The Philippines provides a particularly striking<br />
example of underperformance. 14 With an average<br />
income four times that of <strong>the</strong> United Republic of<br />
Tanzania or Zambia, it has a lower net enrolment<br />
ratio. The unfavourable comparisons do not end<br />
<strong>the</strong>re. Whereas <strong>the</strong> United Republic of Tanzania<br />
and Zambia have been steadily increasing net<br />
enrolment ratios, <strong>the</strong> Philippines has stagnated.<br />
Given <strong>the</strong> country’s starting point in 1999, achieving<br />
universal primary education by 2015 should have<br />
been a formality. There is now a real danger that,<br />
in <strong>the</strong> absence of decisive political leadership, <strong>the</strong><br />
country will miss <strong>the</strong> goal. In 2007, out-of-school<br />
numbers for children aged 6 to 11 broke through<br />
<strong>the</strong> 1 million mark and <strong>the</strong>re were over 100,000<br />
more children out of school <strong>the</strong>n than in 1999.<br />
Around one-quarter of those entering school drop<br />
out before grade 5. O<strong>the</strong>r countries experiencing<br />
stagnation or slippage from high levels of net<br />
enrolment include Turkey, whose net enrolment<br />
ratio has remained unchanged since <strong>the</strong> beginning<br />
of <strong>the</strong> decade (UIS database).<br />
Why have countries that were so close to universal<br />
net enrolment at <strong>the</strong> end of <strong>the</strong> 1990s failed to go<br />
<strong>the</strong> extra mile? One factor is <strong>the</strong> difficulty in<br />
extending opportunities to certain regions and parts<br />
70
PROGRESS TOWARDS THE <strong>EFA</strong> GOALS<br />
Universal primary education<br />
of society. Both <strong>the</strong> Philippines and Turkey face<br />
problems of deeply entrenched marginalization.<br />
In <strong>the</strong> Philippines, marginalization is strongly<br />
associated with poverty and location, with <strong>the</strong><br />
Autonomous Region in Muslim Mindanao and some<br />
outlying islands falling far behind. In Turkey,<br />
disadvantage is heavily concentrated among young<br />
girls in eastern regions who do not have Turkish as<br />
<strong>the</strong>ir mo<strong>the</strong>r tongue (Box <strong>2.</strong>10). <strong>Chapter</strong> 3 explores<br />
<strong>the</strong> problem of reaching marginalized people in<br />
more detail, but it is evident in <strong>the</strong> cases of <strong>the</strong><br />
Philippines and Turkey that current policies are<br />
not breaking down inherited disadvantage. One<br />
contributory factor is <strong>the</strong> low share of national<br />
income invested in education. Turkey invested<br />
around 4% of GNP in 2004, compared with 6%<br />
to 7% in Morocco and Tunisia. The figure was<br />
just <strong>2.</strong>3% in <strong>the</strong> Philippines in 2005, compared<br />
with an East Asian regional average of 3.6%. 15<br />
15. The regional figure<br />
is <strong>the</strong> median for those<br />
countries with available data.<br />
Box <strong>2.</strong>10: Turkey — marginalization keeps universal primary education out of reach<br />
Turkey’s advance <strong>towards</strong> universal primary education<br />
has stalled within touching distance of <strong>the</strong> goal. Much<br />
has been achieved over <strong>the</strong> past decade. But far more has<br />
to be done to break down inequalities based on gender,<br />
region and wealth.<br />
The country’s basic education law requires every child<br />
to undergo eight years of schooling and <strong>the</strong>re is a single<br />
curriculum for all 6- to 14-year-olds. Primary school<br />
enrolment increased rapidly during <strong>the</strong> second half of<br />
<strong>the</strong> 1990s as a series of programmes expanded school<br />
construction, streng<strong>the</strong>ned teacher training, increased<br />
textbook supplies and provided transport for children<br />
in remote villages.<br />
Since 2000, however, progress has slowed. Enrolment ratios<br />
have stagnated at around 90% since 2002 — far below <strong>the</strong><br />
level predicted on <strong>the</strong> basis of Turkey’s average income.<br />
Some 640,000 children of primary school age were out of<br />
school in 2007. Around 60% were girls, pointing to deeply<br />
entrenched gender inequalities. High levels of exclusion in<br />
<strong>the</strong> early years are holding back progress at higher levels,<br />
with adverse consequences for future economic growth,<br />
employment and social development. Education quality is<br />
ano<strong>the</strong>r serious source of concern: Turkey figures among <strong>the</strong><br />
worst performers on <strong>the</strong> learning achievement tests of <strong>the</strong><br />
OECD Programme for International Student Assessment (PISA).<br />
Turkey’s experience powerfully demonstrates <strong>the</strong> difficulties<br />
governments face as <strong>the</strong>y attempt to reach <strong>the</strong> most<br />
marginalized. One study using Turkey’s most recent<br />
Demographic and Health Survey highlights deep, overlapping<br />
and mutually reinforcing inequalities in opportunity for<br />
education, with gender disparities magnifying o<strong>the</strong>r gaps:<br />
Gender. Between ages 8 and 12, 7% of girls never make<br />
it to school, compared with 2% of boys. By age 15, female<br />
enrolment is almost twenty percentage points below<br />
male enrolment.<br />
Region. The eastern region lags far behind <strong>the</strong> rest<br />
of <strong>the</strong> country, mainly because of gender disparity.<br />
Enrolment ratios for girls in eastern Turkey, expressed<br />
as a share of <strong>the</strong> level for boys, peak at 85% at age 9<br />
and have dropped below 40% by age 15.<br />
Rural location. Being born in a rural area is<br />
disadvantageous for girls across <strong>the</strong> country. Outside of<br />
<strong>the</strong> eastern region, that disadvantage kicks in from age 13.<br />
In <strong>the</strong> eastern region it starts early: by age 15, fewer than<br />
20% of rural girls are enrolled.<br />
Household wealth and o<strong>the</strong>r factors. Children in households<br />
that are poor and whose parents have limited formal<br />
education are less likely to progress through <strong>the</strong> school<br />
system. Children in <strong>the</strong> wealthiest 20% of households are<br />
five times more likely to reach higher education than<br />
<strong>the</strong>ir counterparts in <strong>the</strong> poorest 20%. The strength of<br />
<strong>the</strong> negative correlation between household circumstance<br />
and education in Turkey is magnified by gender effects.<br />
For example, at age 16 boys of mo<strong>the</strong>rs with no education<br />
are twice as likely as girls to be in school.<br />
Such findings powerfully illustrate <strong>the</strong> distance Turkey still<br />
has to travel to make <strong>the</strong> right to education a reality for<br />
all of its citizens. As <strong>the</strong> authors of <strong>the</strong> research put it, <strong>the</strong><br />
opportunity profiles that emerge from household surveys<br />
show that ‘school enrolment in Turkey is evidently not<br />
independent from circumstances at birth’.<br />
Patterns of inequality in education raise concerns<br />
for <strong>the</strong> future course of Turkey’s social and economic<br />
development. High levels of education inequality are holding<br />
back efforts to streng<strong>the</strong>n economic growth, expand<br />
employment and create a more equal society. Migration<br />
from eastern to western regions, usually from rural to urban<br />
settlements, spreads <strong>the</strong> legacy of education disadvantage<br />
across <strong>the</strong> country. Large numbers of rural migrants to<br />
Turkish cities settle in squatter areas called gecekondular<br />
districts, which are centres of social marginalization and<br />
educational disadvantage.<br />
The scale of inequality also highlights <strong>the</strong> importance<br />
of equity in public spending. It is critical to streng<strong>the</strong>n<br />
strategies and incentives for reaching rural girls, especially<br />
— though not exclusively — in <strong>the</strong> eastern region. Addressing<br />
<strong>the</strong> disadvantages faced by children of parents who do not<br />
speak Turkish as a home language is ano<strong>the</strong>r priority area.<br />
Sources: Duman (2008); Ferreira and Gignoux (2008a); Otaran et al. (2003).<br />
71
0<br />
1<br />
0<br />
CHAPTER 2<br />
2<br />
Education for All Global Monitoring Report<br />
In half <strong>the</strong><br />
countries<br />
in South<br />
and West Asia,<br />
and sub-Saharan<br />
Africa, almost<br />
one child in three<br />
drops out<br />
16. These figures are<br />
regional medians for <strong>the</strong><br />
countries that have <strong>the</strong><br />
relevant data available.<br />
From enrolment to completion<br />
and beyond — a difficult journey<br />
that is hard to measure<br />
Universal primary education is an apparently<br />
simple goal that raises disarmingly complex<br />
questions over measurement. Going back to first<br />
principles, that goal is about all children entering<br />
school at an appropriate age, progressing<br />
smoothly through <strong>the</strong> system and completing<br />
a full cycle.<br />
For millions of children entering primary school,<br />
<strong>the</strong> journey through <strong>the</strong> system is often delayed,<br />
hazardous and short-lived. In half <strong>the</strong> countries<br />
in South and West Asia, and sub-Saharan Africa,<br />
almost one child in three enrolling in school drops<br />
out before completion. Even that figure, stark as it<br />
is, understates <strong>the</strong> problem: many children do not<br />
get past <strong>the</strong> first hurdle. In 2006, 13% of pupils in<br />
South and West Asia and 9% in sub-Saharan Africa<br />
dropped out before completing <strong>the</strong> first grade<br />
(see annex, Statistical Table 7). 16 Malawi and<br />
Uganda have relatively high net enrolment ratios,<br />
yet between one-quarter and one-third of pupils<br />
drop out during <strong>the</strong> first grade, in some cases<br />
Figure <strong>2.</strong>21: Children’s precarious pathway from school entry to completion<br />
Net enrolment ratios and gross intake rates to last grade, selected countries, 2007<br />
never to return. Repetition of grades is also<br />
common. In Burundi, nearly one-third of children<br />
in primary school in 2006 were repeating grades.<br />
Charting progress <strong>towards</strong> universal primary<br />
education in school systems marked by high<br />
levels of late entry, dropout and grade repetition<br />
is a challenging exercise. The tool kits used by<br />
governments and <strong>the</strong> international community<br />
comprise a range of instruments for measuring<br />
intake, grade progression and completion. Each<br />
instrument provides important information. Yet<br />
<strong>the</strong>y provide only a partial and in some cases<br />
inconsistent insight to where countries are on<br />
<strong>the</strong> road to universal primary education.<br />
Figure <strong>2.</strong>21 illustrates <strong>the</strong> point. It looks at two<br />
of <strong>the</strong> most widely used measures of progress<br />
<strong>towards</strong> universal primary education. The first is<br />
<strong>the</strong> gross intake rate into <strong>the</strong> last grade of primary<br />
school, which expresses <strong>the</strong> share of children<br />
entering <strong>the</strong> last grade as a proportion of <strong>the</strong><br />
official age group for that grade. It includes overage<br />
children who started school late or repeated<br />
grades. The second measure is <strong>the</strong> net enrolment<br />
ratio, discussed earlier. It provides information on<br />
120<br />
Gross intake rate into last grade of primary is higher<br />
than net enrolment ratio (indicates late entry, high levels<br />
of repetition and/or re-entry following drop out)<br />
100<br />
80<br />
(%)<br />
60<br />
40<br />
20<br />
Gross intake rate into last grade of primary is lower than net enrolment ratio<br />
(indicates high levels of drop out in <strong>the</strong> early grades)<br />
0<br />
Liberia<br />
Eritrea<br />
Congo<br />
Timor-Leste<br />
Gambia<br />
Ghana<br />
Lesotho<br />
Palestinian A. T.<br />
Dominican Rep.<br />
Turkey<br />
Bolivia<br />
Colombia<br />
Egypt<br />
Iran, Isl. Rep.<br />
Tunisia<br />
Thailand<br />
Indonesia<br />
Peru<br />
Ecuador<br />
El Salvador<br />
Zambia<br />
Cambodia<br />
India<br />
Anguilla<br />
Morocco<br />
U. R. Tanzania<br />
Guatemala<br />
South Africa<br />
Nicaragua<br />
Namibia<br />
Lao PDR<br />
Swaziland<br />
Madagascar<br />
Nepal<br />
Benin<br />
Bangladesh<br />
Malawi<br />
Mauritania<br />
Guinea<br />
Togo<br />
Pakistan<br />
Senegal<br />
Burundi<br />
Mozambique<br />
Ethiopia<br />
Mali<br />
Burkina Faso<br />
C. A. R.<br />
Niger<br />
Gross intake rate into last grade of primary<br />
Net enrolment ratio in primary education<br />
Source: Annex, Statistical Table 5 and UIS database.<br />
72
PROGRESS TOWARDS THE <strong>EFA</strong> GOALS<br />
Universal primary education<br />
<strong>the</strong> number of primary school age children in <strong>the</strong><br />
system, but not on where <strong>the</strong>y are in <strong>the</strong> system,<br />
on how many started school over <strong>the</strong> official age or<br />
on <strong>the</strong> level of grade repetition. Both measures<br />
provide important but partial information – and <strong>the</strong><br />
relationship between <strong>the</strong> two is highly variable.<br />
Countries with gross intake rates that are higher<br />
than net enrolment ratios (those on <strong>the</strong> left of <strong>the</strong><br />
figure) are characterized by high levels of over-age<br />
entry to last grade. Those in <strong>the</strong> opposite position –<br />
Burundi is an example – are characterized by low<br />
levels of internal efficiency. But nei<strong>the</strong>r measure<br />
offers more than a partial insight into how near a<br />
country is to achieving universal primary education<br />
or how far it may be from that goal.<br />
Cohort tracking can provide a more integrated<br />
perspective. Figure <strong>2.</strong>22 illustrates one possible<br />
Cohort tracking<br />
provides an<br />
integrated<br />
perspective on<br />
progress <strong>towards</strong><br />
universal primary<br />
education<br />
Figure <strong>2.</strong>22: Children who start primary school have varying chances to complete <strong>the</strong> last grade<br />
Net intake rates into first grade of primary through to net cohort completion rates, selected countries, 2006<br />
100<br />
90<br />
80<br />
Net intake rates<br />
Net cohort survival to grade 5<br />
Net cohort completion rates<br />
70<br />
60<br />
(%)<br />
50<br />
40<br />
30<br />
20<br />
10<br />
0<br />
*<br />
*<br />
Eritrea<br />
Burkina Faso<br />
Botswana<br />
Mauritania<br />
Togo<br />
Niger<br />
Benin<br />
Mozambique<br />
Burundi<br />
Kuwait<br />
Senegal<br />
El Salvador<br />
Malawi<br />
Lao PDR<br />
Nicaragua<br />
Brunei Daruss.<br />
Cape Verde<br />
Guatemala<br />
Georgia<br />
Ukraine<br />
Anguilla<br />
Mongolia<br />
Aruba<br />
Madagascar<br />
Cambodia<br />
Iraq<br />
Morocco<br />
Algeria<br />
Panama<br />
Pakistan<br />
Ecuador<br />
Mauritius<br />
Tajikistan<br />
Net cohort completion rates, <strong>the</strong> example of Nicaragua<br />
100<br />
Primary<br />
school entry<br />
age pupils<br />
Net intake rate<br />
into first grade<br />
of primary (67%)<br />
67<br />
Cohort that<br />
enters at <strong>the</strong><br />
correct age<br />
Survival to grade 5<br />
(47% of <strong>the</strong> cohort<br />
entered)<br />
In Nicaragua, <strong>the</strong> net intake rate into first grade was 67% in 2006. The survival rate to grade 5 was<br />
47% and <strong>the</strong> primary completion rate 40%.These observed rates allow us to estimate <strong>the</strong> prospects<br />
of a cohort of pupils aged 6 (<strong>the</strong> primary school starting age) completing <strong>the</strong> six-year cycle.<br />
If repetition and dropout rates remain unchanged, of 100 pupils aged 6, 67 will enter <strong>the</strong><br />
first grade of primary school at <strong>the</strong> correct age. Of <strong>the</strong>se, 32 will survive until grade 5,<br />
and 27 will graduate from <strong>the</strong> final grade.<br />
32<br />
Net cohort<br />
survival to<br />
grade 5<br />
Primary completion<br />
rate (40% of <strong>the</strong><br />
cohort entered)<br />
27<br />
Net cohort<br />
completion<br />
rate<br />
Notes: The lines for each country illustrate <strong>the</strong> prospects for a cohort of 100 children of primary school entry age completing <strong>the</strong> cycle if <strong>the</strong> education system<br />
remains in its current state (taking account of current rates of repetition and dropout). Ideally, all children should enter school at <strong>the</strong> official starting age.<br />
The net intake rate is <strong>the</strong>refore used as <strong>the</strong> entry point. The net cohort survival rate to grade 5 and <strong>the</strong> net cohort completion rate are obtained by multiplying<br />
<strong>the</strong> net intake rate by, respectively, <strong>the</strong> survival rate to grade 5 and <strong>the</strong> primary cohort completion rate. All countries with available data are included.<br />
* Countries whose primary education cycle is less than five years.<br />
Source: Global Monitoring Report team calculations based on Statistical Tables 4 and 7 (annex).<br />
73
0<br />
1<br />
0<br />
CHAPTER 2<br />
2<br />
Education for All Global Monitoring Report<br />
Nearly 71 million<br />
adolescents<br />
were out of<br />
school in 2007,<br />
54% were girls<br />
approach. Starting from <strong>the</strong> proportion of<br />
children entering school at <strong>the</strong> official age, it<br />
uses administrative data to track <strong>the</strong>ir progress<br />
to grade 5 and, unlike <strong>the</strong> gross intake rate for<br />
<strong>the</strong> last grade, subsequent completion. For<br />
countries seeking to make <strong>the</strong> transition from<br />
school systems characterized by late entry,<br />
grade repetition and low completion to a more<br />
regular cycle consistent with progress <strong>towards</strong><br />
universal primary education, <strong>the</strong> net cohort<br />
completion rate is a potentially useful<br />
measurement tool.<br />
One advantage of cohort tracking is that it provides<br />
a credible measure of distance from universal<br />
primary education. In <strong>the</strong> case of sub-Saharan<br />
Africa, it underlines <strong>the</strong> daunting scale of <strong>the</strong><br />
challenge ahead. While intake rates are going up,<br />
delayed entry is endemic. Half of all countries in<br />
<strong>the</strong> region had 50% or more children entering<br />
school later than <strong>the</strong> official starting age in 2007.<br />
Assuming a five-year school cycle, this implies<br />
that governments in <strong>the</strong> region would have to<br />
double <strong>the</strong> net intake rate by 2010 to make<br />
universal primary entry possible by 2015. For<br />
some countries, <strong>the</strong> challenge is to raise <strong>the</strong> net<br />
intake rate while building on a strong but limited<br />
completion record. In Burkina Faso, most children<br />
entering school at <strong>the</strong> appropriate age progress<br />
through to completion – but <strong>the</strong> net intake rate<br />
in 2006 was just 27%. Conversely, Malawi and<br />
Nicaragua have net intake rates over 60% in 2006<br />
where fewer than half <strong>the</strong> official age entrants<br />
make it through to completion.<br />
Out-of-school adolescents<br />
The focus on out-of-school children of primary<br />
school age has deflected attention from a far wider<br />
problem. Millions in <strong>the</strong> lower secondary school age<br />
group are also out of school, ei<strong>the</strong>r because <strong>the</strong>y<br />
have not completed primary school or could not<br />
make <strong>the</strong> transition to lower secondary school.<br />
Recent data analysis suggests that nearly 71 million<br />
adolescents were out of school in 2007 – almost<br />
one in five of <strong>the</strong> total age group (Table <strong>2.</strong>3). 17<br />
Viewed through this wider lens, <strong>the</strong> out-of-school<br />
problem is twice as large as it is typically reported<br />
to be. The problem is most widespread in sub-<br />
Saharan Africa, with 38% of adolescents out of<br />
school, and South and West Asia with 28%. As with<br />
primary school age children, adolescent girls are<br />
more likely than boys to be out of school. Globally,<br />
54% of out-of-school adolescents in 2007 were<br />
girls. In <strong>the</strong> Arab States <strong>the</strong> figure was 59%<br />
(Bruneforth and Wallet, 2009).<br />
Equally disconcerting is <strong>the</strong> fact that many<br />
adolescents in school are still enrolled at <strong>the</strong><br />
primary level (Figure <strong>2.</strong>23). This is <strong>the</strong> case for<br />
39% of lower secondary school age adolescents<br />
in sub-Saharan Africa, for example.<br />
Table <strong>2.</strong>3: Number and % of children and adolescents of primary, lower secondary or basic education age<br />
not enrolled in primary, secondary or higher education, 2007<br />
17. For <strong>the</strong> purposes of<br />
this analysis, adolescence<br />
is defined in terms of <strong>the</strong><br />
official lower secondary<br />
school age range.<br />
Although <strong>the</strong> range varies<br />
by country, it is typically<br />
shorter than that for<br />
primary school. The lower<br />
secondary cycle is usually<br />
two to four years,<br />
compared with five to<br />
seven years of primary<br />
schooling in most<br />
countries.<br />
World<br />
Developing countries<br />
Developed countries<br />
Countries in transition<br />
Sub-Saharan Africa<br />
Arab States<br />
Central Asia<br />
East Asia and <strong>the</strong> Pacific<br />
South and West Asia<br />
Latin America and <strong>the</strong> Caribbean<br />
North America and Western Europe<br />
Central and Eastern Europe<br />
Source: Bruneforth and Wallet (2009).<br />
Primary education<br />
Total<br />
out-of-school<br />
As % of <strong>the</strong><br />
primary age<br />
group<br />
Total<br />
out-of-school<br />
Lower secondary<br />
education<br />
As % of <strong>the</strong><br />
lower secondary<br />
age group<br />
Total<br />
out-of-school<br />
(000) (000) (000)<br />
Basic education<br />
(primary and lower secondary<br />
combined)<br />
As % of <strong>the</strong><br />
basic education<br />
age group<br />
71 791 11 70 921 18 142 712 14<br />
68 638 12 68 197 21 136 835 15<br />
2 334 4 1 538 4 3 872 4<br />
819 6 1 187 6 2 006 6<br />
32 226 26 21 731 38 53 957 30<br />
5 752 14 4 009 18 9 761 15<br />
271 5 302 4 573 4<br />
9 039 5 10 319 10 19 358 7<br />
18 031 10 29 905 28 47 937 17<br />
2 989 5 1 885 5 4 873 5<br />
1 931 4 1 319 4 3 250 4<br />
1 552 7 1 452 7 3 004 7<br />
74
PROGRESS TOWARDS THE <strong>EFA</strong> GOALS<br />
Universal primary education<br />
The transition from primary school to lower<br />
secondary school is hazardous for many children.<br />
Problems that may be evident at <strong>the</strong> primary level<br />
are often magnified at <strong>the</strong> secondary level. Cost,<br />
distance to school, labour market demand and –<br />
especially for girls – deeply engrained social,<br />
cultural and economic barriers figure prominently<br />
(Otieno and K’Oliech, 2007). Because secondary<br />
schools are often fur<strong>the</strong>r from home, <strong>the</strong><br />
importance of distance as a barrier to entry<br />
increases. This is especially true for poor<br />
households facing labour shortages and for<br />
children in rural areas (Mingat and Ndem, 2008).<br />
In Mauritania and Senegal, <strong>the</strong> average journey<br />
time to <strong>the</strong> closest secondary school is eighty<br />
minutes in rural areas. The average distance to<br />
<strong>the</strong> closest lower secondary school in Senegal<br />
is twenty-five times far<strong>the</strong>r than to <strong>the</strong> nearest<br />
primary school (Glick and Sahn, 2009). Distance<br />
can compound <strong>the</strong> effects of poverty, with poor<br />
households often unable to cover <strong>the</strong> cost ei<strong>the</strong>r<br />
of transport or of boarding school places. Girls<br />
face a distinctive set of barriers: longer distances<br />
may reinforce security concerns and, in some<br />
contexts, early marriage prevents <strong>the</strong>m from<br />
progressing beyond primary school.<br />
The transition to lower secondary school is now<br />
at <strong>the</strong> centre of <strong>the</strong> Education for All agenda in<br />
many countries. In sub-Saharan Africa, universal<br />
basic education is an increasingly prominent policy<br />
goal. For example, Ghana has adopted a basic<br />
education cycle embracing six years of primary<br />
and three years of lower secondary; in Zambia<br />
<strong>the</strong> cycle is seven years of primary and two years<br />
of lower secondary.<br />
There are good reasons for <strong>the</strong> shift in emphasis<br />
<strong>towards</strong> a longer basic education cycle. As more<br />
children get into and progress through primary<br />
school, demand for secondary school places is<br />
growing. There is also evidence of high social and<br />
private returns to education beyond <strong>the</strong> primary<br />
level. Yet governments also face tough choices.<br />
In countries that have been unable to deliver<br />
affordable, good-quality basic education to large<br />
sections of <strong>the</strong> population, <strong>the</strong> shift in emphasis<br />
raises important questions for equity in public<br />
finance. Aid partnerships can help relieve <strong>the</strong><br />
financing constraints. However, it is important for<br />
governments and donors to avoid a premature shift<br />
in policy priorities. With millions of children still<br />
excluded from primary education and <strong>the</strong> world<br />
off track for <strong>the</strong> 2015 <strong>goals</strong>, <strong>the</strong>re is a great deal<br />
of unfinished business awaiting urgent attention.<br />
Figure <strong>2.</strong>23: Many adolescents are out of school,<br />
or still in primary school<br />
Distribution of lower secondary school age children by education level<br />
and % out of school<br />
% of lower secondary school age population<br />
100<br />
80<br />
60<br />
40<br />
20<br />
0<br />
23<br />
39<br />
38<br />
Sub-Saharan<br />
Africa<br />
Conclusion<br />
60<br />
12<br />
28<br />
South/<br />
West Asia<br />
In secondary education<br />
or higher<br />
Source: Bruneforth and Wallet (2009).<br />
Arab<br />
States<br />
East Asia/<br />
Pacific<br />
In primary<br />
education<br />
5<br />
Latin<br />
America/<br />
Caribbean<br />
Out of school<br />
As in previous years, <strong>the</strong> progress report on<br />
universal primary education is a story of ‘glass<br />
half empty, glass half full’. Much has been<br />
achieved – but <strong>the</strong> international community has<br />
a long way to go if it is to deliver on <strong>the</strong> promises<br />
made in Dakar and in <strong>the</strong> Millennium Development<br />
Goals. The slow-down in getting children into<br />
school since 2004 is a particular concern. Ano<strong>the</strong>r<br />
is <strong>the</strong> evidence of a large mismatch between<br />
administrative data on school enrolment and<br />
household survey data on school attendance.<br />
The out-of-school problem may be far bigger<br />
than has previously been assumed, pointing<br />
to a need for an urgent policy response at both<br />
<strong>the</strong> national and international levels.<br />
64<br />
18<br />
18<br />
75<br />
15<br />
10<br />
72<br />
23<br />
60<br />
20<br />
21<br />
Developing<br />
countries<br />
The transition<br />
from primary<br />
school to lower<br />
secondary school<br />
is hazardous for<br />
many children<br />
75
0<br />
1<br />
2<br />
0<br />
CHAPTER 2<br />
Education for All Global Monitoring Report<br />
The global<br />
economic crisis<br />
has pushed<br />
learning and<br />
skills up <strong>the</strong><br />
political agenda<br />
Youth and adult skills —<br />
expanding opportunities<br />
in <strong>the</strong> new global economy<br />
Goal 3. Ensuring that <strong>the</strong> learning needs of<br />
all young people and adults are met through<br />
equitable access to appropriate learning and<br />
life-skills programmes.<br />
The Dakar Framework for Action does not provide<br />
targets for youth and adult skills. Ra<strong>the</strong>r than<br />
agree to quantifiable benchmarks, governments<br />
signed up to a third <strong>EFA</strong> goal that amounts to a<br />
vague aspiration. One consequence has been a<br />
protracted and unresolved debate over what, if<br />
anything, that aspiration means in terms of policy<br />
commitments (King and Palmer, 2008). Unlike o<strong>the</strong>r<br />
parts of <strong>the</strong> Dakar Framework, goal 3 has been <strong>the</strong><br />
subject of quiet neglect. It has been conspicuous by<br />
its absence not just from <strong>the</strong> agendas of high-level<br />
development summits but also from <strong>the</strong> campaigns<br />
of non-government organizations.<br />
That situation is unfortunate. In <strong>the</strong> emerging<br />
knowledge-based global economy of <strong>the</strong> twentyfirst<br />
century, learning and skills play an increasingly<br />
important role in shaping prospects for economic<br />
growth, shared prosperity and poverty reduction<br />
(Sapir, 2005). A country’s most important resource<br />
is not its raw materials or its geographical location<br />
but <strong>the</strong> skills of its people. Countries that fail to<br />
nurture <strong>the</strong>se skills through effective learning<br />
face a bleak future, with human capital deficits<br />
hindering economic growth, employment creation<br />
and social progress (Commission on Growth<br />
and Development, 2008; Kok, 2004; OECD, 2004).<br />
Within countries, unequal access to opportunities<br />
to develop skills will be reflected in deepening<br />
social and economic disparities. Youth<br />
unemployment, one of <strong>the</strong> most serious and<br />
persistent challenges facing governments across<br />
<strong>the</strong> world, is in part a reflection of a misalignment<br />
between skills development and <strong>the</strong> economy.<br />
As one recent report put it: ‘Achieving world<br />
class skills is <strong>the</strong> key to achieving economic<br />
success and social justice in <strong>the</strong> new global<br />
economy’ (Leitch Review of Skills, 2006, p. 9).<br />
Rich and poor countries alike increasingly<br />
recognize that <strong>the</strong>y will pay a high price if <strong>the</strong>y fail<br />
to streng<strong>the</strong>n national skills (DFID, 2007, 2008a).<br />
The global economic crisis has raised <strong>the</strong> stakes,<br />
pushing learning and skills up <strong>the</strong> political<br />
agenda. While all sections of society have been<br />
affected, <strong>the</strong> economic downturn has left its<br />
deepest imprint on vulnerable unskilled workers,<br />
especially <strong>the</strong> young (ILO, 2009a; OECD, 2009d).<br />
Governments across <strong>the</strong> world are grappling with<br />
<strong>the</strong> twin challenges of providing immediate support<br />
to <strong>the</strong> vulnerable during a period of turbulence<br />
while equipping people with <strong>the</strong> skills <strong>the</strong>y need<br />
to re-enter labour markets with higher levels<br />
of productivity.<br />
This section looks at some of <strong>the</strong> lessons to<br />
be drawn from current approaches to skills<br />
development. Narrowing <strong>the</strong> wide-angle lens<br />
of goal 3, <strong>the</strong> focus is on skills and learning<br />
opportunities for young people provided through<br />
technical and vocational education programmes.<br />
These programmes can play an important role<br />
in streng<strong>the</strong>ning <strong>the</strong> transition from school to<br />
<strong>the</strong> world of work, in offering second chances and<br />
in combating marginalization. In many countries,<br />
however, technical and vocational education is<br />
in such bad shape that it merits its reputation<br />
as a form of second-class schooling. There are<br />
no quick fixes for this situation, but four broad<br />
messages emerge from this section:<br />
Give young people <strong>the</strong> training <strong>the</strong>y need.<br />
Governments, trade unions and employers<br />
need to cooperate to devise effective technical<br />
and vocational education that equips young<br />
people with <strong>the</strong> skills <strong>the</strong>y need for success<br />
in employment. Too much vocational education<br />
delivers skills of limited relevance to economic<br />
and social needs, and at high cost, often<br />
bypassing <strong>the</strong> poor and <strong>the</strong> informal sector.<br />
It is often driven by inappropriate curricula<br />
and qualifications, with providers insulated<br />
from employers’ real demands.<br />
Skills need a broad base. Successful transition<br />
from school to work requires <strong>the</strong> development<br />
of broad skills, with an emphasis on problemsolving<br />
and ‘learning to learn’, alongside<br />
more specialized abilities. Early streaming<br />
into specialized vocational education<br />
through academic selection should be avoided.<br />
Governments also need to address <strong>the</strong><br />
widespread perception of technical and<br />
vocational education as a safety net for failing<br />
students or those from poor family backgrounds.<br />
Raising <strong>the</strong> quality and improving <strong>the</strong> relevance<br />
of technical and vocational education is <strong>the</strong><br />
most effective antidote to that perception.<br />
76
PROGRESS TOWARDS THE <strong>EFA</strong> GOALS<br />
Youth and adult skills — expanding opportunities in <strong>the</strong> new global economy<br />
Streng<strong>the</strong>n basic education. Effective and<br />
equitable skills will not be developed in<br />
countries where a majority of <strong>the</strong> population<br />
does not reach secondary school. Streng<strong>the</strong>ning<br />
basic education is a key element in providing<br />
technical and vocational training.<br />
Work <strong>towards</strong> greater equity. In many countries,<br />
technical and vocational education fails to reach<br />
large numbers of marginalized young people,<br />
notably young women. Far more could be done<br />
to broaden vocational education opportunities,<br />
by offering ‘second chance’ programmes and<br />
by better integrating vocational training into<br />
national poverty reduction strategies. Designing<br />
flexible programmes for young people who have<br />
not completed secondary school or gone beyond<br />
primary education can help combat youth<br />
unemployment.<br />
This section is divided into five parts. Part 1 outlines<br />
<strong>the</strong> diverse ways in which countries approach <strong>the</strong><br />
task of supplying technical and vocational education<br />
and provides a bird’s-eye view of global participation<br />
in vocational education at <strong>the</strong> secondary school<br />
level. Part 2 looks at one of <strong>the</strong> most sensitive<br />
barometers of <strong>the</strong> mismatch between training<br />
and <strong>the</strong> economy – youth unemployment. While<br />
<strong>the</strong> global economic crisis is leaving its mark on<br />
people across <strong>the</strong> world, marginalized young<br />
people are often bearing <strong>the</strong> brunt.<br />
Part 3 examines what can happen to technical<br />
and vocational programmes when good intentions<br />
are undermined by lack of finance, poor design<br />
and weak linkage to labour markets. It highlights<br />
<strong>the</strong> particular challenges governments face in <strong>the</strong><br />
Arab States, India and sub-Saharan Africa. Part 4<br />
explores how vocational education can help young<br />
adults avoid marginalization by offering <strong>the</strong>m a<br />
second chance to acquire <strong>the</strong> skills <strong>the</strong>y need. Part 5<br />
considers what kinds of policies lead to effective<br />
technical and vocational education programmes that<br />
facilitate <strong>the</strong> transition from school to employment.<br />
Technical and vocational education<br />
The fundamental purpose of technical and<br />
vocational education is to equip people with<br />
capabilities that can broaden <strong>the</strong>ir opportunities<br />
in life, and to prepare youth and young adults for<br />
<strong>the</strong> transition from school to work. Skill<br />
development in technical and vocational education<br />
matters at many levels. For individuals, <strong>the</strong> skills<br />
carried into <strong>the</strong> labour market have a major<br />
influence on job security and wages. For employers,<br />
skills and learning play a key role in raising<br />
productivity. For society as a whole, raising <strong>the</strong><br />
overall level of skills, ensuring that young people<br />
are not left behind and aligning <strong>the</strong> supply of skilled<br />
labour with <strong>the</strong> demands of industry are critical<br />
to social cohesion. This section focuses principally<br />
on <strong>the</strong> role of vocational education, ra<strong>the</strong>r than<br />
on training provided by companies, in <strong>the</strong><br />
generation of skills and capabilities.<br />
Vocational programmes vary across countries<br />
Technical and vocational education programmes<br />
emerged in developed countries during <strong>the</strong><br />
nineteenth century to support industrial<br />
development. Their subsequent evolution and <strong>the</strong>ir<br />
adoption in developing countries reflect complex<br />
institutional relationships between education<br />
and economic systems.<br />
There are many models of provision. While some<br />
countries provide general education in schools,<br />
with companies or special training institutes<br />
offering vocational options, o<strong>the</strong>r countries offer<br />
distinctive vocational options in secondary school.<br />
Apprenticeship programmes are an important<br />
part of technical and vocational education provision,<br />
though here, too, arrangements vary. Several broad<br />
approaches can be identified:<br />
Dual systems. Some countries combine<br />
school-based and work-based training in dual<br />
systems, integrating apprenticeships into <strong>the</strong><br />
formal education structure. OECD countries<br />
that typically offer this option include Denmark,<br />
Germany, Switzerland and, more recently,<br />
Norway (OECD, 2007a). The well-known German<br />
dual system, which has been widely copied in<br />
developing countries, creates opportunities for<br />
students to combine school-based classes with<br />
in-company training (Barabasch et al., 2009).<br />
Four key stakeholders are involved: <strong>the</strong> federal<br />
government, <strong>the</strong> state government,<br />
representatives of employer organizations<br />
and trade unions (German Federal Ministry<br />
of Education and Research, 2006). Benefits of<br />
<strong>the</strong> German system include firm-based training<br />
that equips students with skills suitable for <strong>the</strong><br />
job market, an assured pool of skilled workers<br />
and private sector contributions to financing.<br />
Vocational training has played an important<br />
role in combating youth unemployment and<br />
reducing wage inequalities. On a less positive<br />
note, early tracking into vocational education<br />
has contributed to deep inequalities in<br />
For individuals,<br />
<strong>the</strong> skills carried<br />
into <strong>the</strong> labour<br />
market have a<br />
major influence<br />
on job security<br />
and wages<br />
77
0<br />
1<br />
0<br />
CHAPTER 2<br />
2<br />
Education for All Global Monitoring Report<br />
In most<br />
countries,<br />
governments,<br />
employers,<br />
trade unions,<br />
civil society<br />
and private<br />
agencies are<br />
involved in TVET<br />
18. ‘Tracking’ refers to<br />
<strong>the</strong> practice of separating<br />
students into different<br />
school types, typically<br />
academic vs. vocational,<br />
at <strong>the</strong> scondary level.<br />
19. Decisions over <strong>the</strong><br />
tracking of students are<br />
often taken as early as<br />
age 10 to 1<strong>2.</strong> The top tier<br />
of schooling – gymnasium<br />
– paves <strong>the</strong> way to<br />
university. Only 18% of<br />
immigrant children make<br />
it to this top track,<br />
compared with 47% of<br />
German students.<br />
Meanwhile, 40% of<br />
immigrant children attend<br />
<strong>the</strong> lowest branch – twice<br />
<strong>the</strong> share for students<br />
from German families.<br />
20. The Industrial and<br />
Vocational Training Board<br />
in Mauritius is one<br />
example. In Chile, <strong>the</strong><br />
Servicio Nacional de<br />
Capacitación y Empleo<br />
(SENCE) has no capacity<br />
for delivering training but<br />
contracts services from<br />
a range of public and<br />
private providers.<br />
educational achievement, with <strong>the</strong> school<br />
system actively reinforcing social and economic<br />
divisions. 18 Germany has some of <strong>the</strong> largest<br />
education disparities between schools and<br />
socio-economic groups in <strong>the</strong> OECD countries,<br />
with <strong>the</strong> children of immigrants far more likely<br />
to be tracked into vocational education. 19<br />
School-based systems. Several countries<br />
have traditionally maintained a division of roles<br />
between school-based general education and<br />
company-based training. In Japan, full-time<br />
vocational schooling is followed by full-time<br />
employment in enterprises linked to <strong>the</strong> school<br />
(OECD, 2009c). As with <strong>the</strong> German dual system,<br />
vocational training in Japan has historically<br />
helped facilitate quick settlement of school<br />
leavers into secure employment. However,<br />
unlike in <strong>the</strong> German system, with its focus<br />
on firm-based training, in Japan students<br />
in vocational tracks typically leave full-time<br />
education to enter companies that provide<br />
training linked to <strong>the</strong>ir schools.<br />
Mixed models. Many countries operate hybrid<br />
programmes, providing vocational education<br />
streams within <strong>the</strong> school system. This is a<br />
characteristic of <strong>the</strong> French model, though<br />
France also operates a small parallel ‘dual<br />
system’ (Grubb, 2006). The United Kingdom<br />
operates several ‘school and work’ programmes<br />
involving apprenticeships and general education<br />
(UK Learning and Skills Council National Office,<br />
2007). However, <strong>the</strong> links between employers<br />
and educators have traditionally been less<br />
institutionalized than in <strong>the</strong> German or<br />
Japanese systems.<br />
In most countries, governments hold primary<br />
responsibility for setting <strong>the</strong> overall direction<br />
of vocational education policy and for overseeing<br />
and regulating standards. A wide range of o<strong>the</strong>r<br />
interested parties is involved, however, including<br />
employers, trade unions, civil society and private<br />
agencies. Many countries have created national<br />
training authorities to oversee and coordinate<br />
activities, with remits that extend from <strong>the</strong> design<br />
of vocational curricula in schools to oversight<br />
of training in specialized institutions and in<br />
companies. Occupational and standard-setting<br />
bodies, along with national qualification<br />
frameworks, seek to establish uniform and<br />
predictable standards, enabling employers<br />
to assess potential employees’ skills.<br />
Beyond <strong>the</strong> school, <strong>the</strong>re is a wide range of training<br />
providers. In some cases, government agencies<br />
play <strong>the</strong> lead role in financing and providing training<br />
through specialized institutes. O<strong>the</strong>r countries,<br />
such as Chile and Mauritius, have split financing<br />
from <strong>the</strong> provision of training and adopted a<br />
competitive model for procuring training services. 20<br />
In some countries, <strong>the</strong> private sector occupies an<br />
important position in both financing and providing<br />
training. The diversity of governance models is<br />
evident in Latin America (CINTERFOR/ILO, 2001;<br />
Gallart, 2008). In Colombia and Costa Rica, which<br />
have highly effective training models, <strong>the</strong> public<br />
sector plays <strong>the</strong> dominant role in finance and<br />
provision. By contrast, Brazil’s Serviço Nacional<br />
de Aprendizagem Industrial (SENAI), one of<br />
<strong>the</strong> most successful vocational systems in<br />
<strong>the</strong> developing world, is administered by <strong>the</strong><br />
Confederação Nacional da Indústria (Box <strong>2.</strong>11).<br />
Vocational education is costly<br />
Evidence from developed and developing countries<br />
suggests that technical and vocational education<br />
is relatively costly to provide. In <strong>the</strong> fourteen OECD<br />
countries for which data are available, expenditure<br />
per student is around 15% more than in general<br />
education (OECD, 2008b). Evidence from sub-<br />
Saharan Africa suggests that vocational education<br />
is up to fourteen times more expensive than general<br />
secondary education (Johanson and Adams, 2004).<br />
Public financing plays <strong>the</strong> central role in paying<br />
for vocational provision through <strong>the</strong> secondary<br />
school system. In dual systems, training costs are<br />
typically shared by governments and employers.<br />
For example, in Germany, companies cover<br />
apprenticeship costs while regional governments<br />
pay for <strong>the</strong> school-based component (Ryan, 2001).<br />
Many governments mobilize private finance for<br />
national training programmes through payroll taxes<br />
levied on companies. Egypt’s Training Finance Fund<br />
is supported through a 1% levy on payroll taxes<br />
(DFID and World Bank, 2005). Twelve countries<br />
in sub-Saharan Africa impose a similar levy, albeit<br />
on a far narrower tax base (Adams, 2007b).<br />
Companies play an important<br />
and expanding role<br />
There is strong evidence that investment in training<br />
for young people in <strong>the</strong> workplace is good for <strong>the</strong><br />
companies involved, for individuals and for national<br />
economies. However, governments have to address<br />
<strong>the</strong> fact that workplace training is not always shared<br />
fairly. Levels of investment in training tend to rise<br />
with <strong>the</strong> size of <strong>the</strong> company and <strong>the</strong> level of<br />
78
PROGRESS TOWARDS THE <strong>EFA</strong> GOALS<br />
Youth and adult skills — expanding opportunities in <strong>the</strong> new global economy<br />
education of <strong>the</strong> workforce. While over 80% of<br />
companies in Kenya and Zambia with more than<br />
150 employers are active trainers, under 5% of<br />
those with fewer than 10 workers fall into this<br />
category (Adams, 2007b; Tan, 2006). Several<br />
countries have adopted innovative approaches<br />
aimed at extending company-based opportunities<br />
for skills development. Singapore’s Skills<br />
Development Fund and Malaysia’s Human<br />
Resources Development Fund are financed by a 1%<br />
levy on wages, with <strong>the</strong> revenue used to subsidize<br />
training for workers in smaller companies. 21<br />
Vocational training<br />
through secondary schools<br />
Technical and vocational education is offered<br />
through a bewildering array of institutional<br />
arrangements, public and private providers, and<br />
financing systems, so cross-country comparisons<br />
have to be treated with caution. The weakness<br />
of many national reporting systems, combined<br />
with a lack of consistency, adds a fur<strong>the</strong>r layer<br />
of complication (UNEVOC and UIS, 2006).<br />
Mapping a diverse sector. Detailed mapping of<br />
technical and vocational education reveals some<br />
broad patterns. The most common format is entry<br />
in middle school or upper secondary school, or<br />
through college courses combining general and<br />
vocational learning. Most courses at this level<br />
orient students <strong>towards</strong> labour markets, though<br />
some offer a route into tertiary or general<br />
education. Some developed countries, including<br />
France and Germany, introduce ‘pre-vocational’<br />
courses in lower secondary, often targeting <strong>the</strong>m<br />
at what are deemed <strong>the</strong> less academic students.<br />
In many developing countries, early tracking is<br />
<strong>the</strong> rule ra<strong>the</strong>r than <strong>the</strong> exception. In <strong>the</strong> United<br />
Republic of Tanzania, two out of three vocational<br />
students are tracked after primary school, with<br />
<strong>the</strong> remainder entering specialized technical<br />
schools after completing general education<br />
(Kahyarara and Teal, 2006).<br />
Participation in technical and vocational education<br />
has increased alongside <strong>the</strong> general expansion of<br />
secondary education, but <strong>the</strong> degree to which<br />
secondary education has been ‘vocationalized’ varies<br />
markedly (Lauglo and Maclean, 2005). In 2007, 16%<br />
of secondary school students in developed countries<br />
were in technical and vocational education,<br />
compared with 9% in developing countries. 22<br />
Technical and vocational shares were lowest in<br />
secondary enrolment in sub-Saharan Africa (6%),<br />
and South and West Asia (2%). (Table <strong>2.</strong>4)<br />
Box <strong>2.</strong>11: Private vocational training in Brazil:<br />
widespread and successful<br />
The best-known graduate of Brazil’s Serviço Nacional de Aprendizagem<br />
Industrial (SENAI) is President Luiz Inácio Lula da Silva, who trained<br />
<strong>the</strong>re as a mechanic.<br />
SENAI operates one of <strong>the</strong> world’s largest integrated vocational<br />
systems, administered by <strong>the</strong> Confederação Nacional da Indústria<br />
(National Confederation of Industry). Delivering courses through<br />
about 700 training centres in twenty-seven states, it trains <strong>2.</strong>8 million<br />
professionals a year. Working with government agencies, SENAI has<br />
established rigorous, world-class standards for training and certification,<br />
enabling graduates to switch between employers and states.<br />
Financed through a payroll tax on industry, <strong>the</strong> SENAI system is managed<br />
by entrepreneurs. Companies play an important role in identifying<br />
priority areas for training and in <strong>the</strong> design of courses. Administration<br />
also involves national and regional governments, and trade unions.<br />
Source: SENAI (2009).<br />
Behind <strong>the</strong>se regional averages are very large<br />
differences between countries (Annex, Statistical<br />
Table 7). In thirteen of <strong>the</strong> twenty-five countries in<br />
sub-Saharan Africa with data, <strong>the</strong> share of technical<br />
and vocational education in secondary enrolment<br />
was less than 5%. In Latin America, coverage<br />
ranges from less than 5% in Brazil, <strong>the</strong> Dominican<br />
Republic and Nicaragua to over 30% in Argentina<br />
and Honduras. Developed countries, too,<br />
demonstrate wide variation. Reported enrolment in<br />
technical and vocational education at <strong>the</strong> secondary<br />
level ranges from less than 20% in fourteen<br />
countries, including France, Spain and <strong>the</strong> United<br />
Kingdom, to over 45% in <strong>the</strong> Ne<strong>the</strong>rlands.<br />
Secondary school enrolment – unequal<br />
convergence. One way to assess participation in<br />
technical and vocational education is to measure<br />
<strong>the</strong> proportion of secondary school students who<br />
are enrolled in such programmes. But to avoid<br />
getting a distorted picture, <strong>the</strong> fact that countries<br />
vary widely in levels of secondary school<br />
participation must be taken into account. While<br />
developing countries have been increasing<br />
participation in secondary education and beyond,<br />
that process has been highly unequal.<br />
Table <strong>2.</strong>5 shows <strong>the</strong> limits of current progress.<br />
Developed countries have achieved near universal<br />
secondary education and progression into tertiary<br />
education has increased, with <strong>the</strong> gross enrolment<br />
ratio reaching 67% in 2007. Developing regions are<br />
catching up at varying speeds and from different<br />
In <strong>the</strong> United<br />
Republic<br />
of Tanzania,<br />
two out of three<br />
vocational<br />
students<br />
are tracked after<br />
primary school<br />
21. Singapore’s fund reaches<br />
65% of enterprises with<br />
between ten and forty-nine<br />
workers. Malaysia’s includes<br />
a facility for supporting small<br />
enterprises in developing<br />
training plans and offers<br />
incentives for larger firms<br />
with excess training capacity<br />
to offer places to workers<br />
from smaller firms.<br />
2<strong>2.</strong> This uses <strong>the</strong><br />
conventional benchmark of<br />
ISCED 2 and 3 for lower and<br />
upper secondary education<br />
levels.<br />
79
1<br />
0<br />
0<br />
CHAPTER 2<br />
2<br />
Education for All Global Monitoring Report<br />
Table <strong>2.</strong>4: Enrolment in technical and vocational education (TVE) by region, 2007<br />
World<br />
Developing countries<br />
Developed countries<br />
Countries in transition<br />
Sub-Saharan Africa<br />
Arab States<br />
Central Asia<br />
East Asia and <strong>the</strong> Pacific<br />
East Asia<br />
Pacific<br />
South and West Asia<br />
Latin America and <strong>the</strong> Caribbean<br />
Caribbean<br />
Latin America<br />
North America and Western Europe<br />
Central and Eastern Europe<br />
Source: Annex, Statistical Table 8.<br />
World<br />
Total enrolment<br />
in secondary<br />
Total<br />
Female<br />
Total<br />
Female<br />
(000) (%) (000)<br />
(%)<br />
Total enrolment in TVE<br />
% of<br />
school age<br />
population<br />
% of total<br />
enrolment in<br />
secondary<br />
518 721 47 54 024 46 7 10<br />
409 125 47 37 044 47 6 9<br />
83 335 49 13 553 43 16 16<br />
26 261 48 3 428 40 12 13<br />
35 580 44 2 221 39 2 6<br />
27 453 47 3 157 43 7 11<br />
10 891 48 1 271 46 11 12<br />
165 769 48 23 658 49 11 14<br />
162 324 48 22 550 49 11 14<br />
3 445 48 1 109 44 34 32<br />
125 705 44 2 412 27 1 2<br />
58 547 51 6 275 54 9 11<br />
1 294 50 51 49 2 4<br />
57 253 51 6 225 54 10 11<br />
62 401 49 8 645 43 14 14<br />
32 375 48 6 385 39 17 20<br />
Table <strong>2.</strong>5: Gross enrolment ratios in secondary and tertiary education, 1999 and 2007<br />
Total<br />
Gross enrolment ratios<br />
in secondary<br />
(%)<br />
School year ending in<br />
1999<br />
2007<br />
GPI Total<br />
(F/M)<br />
GPI<br />
(F/M)<br />
Gross enrolment ratios<br />
in tertiary<br />
(%)<br />
School year ending in<br />
1999<br />
2007<br />
GPI Total<br />
(F/M)<br />
60 0.92 66 0.95 18 0.96 26 1.08<br />
Total<br />
GPI<br />
(F/M)<br />
Developing countries<br />
Developed countries<br />
Countries in transition<br />
Sub-Saharan Africa<br />
Arab States<br />
Central Asia<br />
East Asia and <strong>the</strong> Pacific<br />
East Asia<br />
Pacific<br />
South and West Asia<br />
Latin America and <strong>the</strong> Caribbean<br />
Caribbean<br />
Latin America<br />
North America and Western Europe<br />
Central and Eastern Europe<br />
52 0.89 61 0.94 11 0.78 18 0.96<br />
100 1.00 100 1.00 55 1.19 67 1.29<br />
91 1.01 90 0.98 39 1.21 58 1.29<br />
24 0.82 34 0.79 4 0.67 6 0.66<br />
60 0.89 65 0.92 19 0.74 22 1.05<br />
85 0.99 95 0.98 18 0.93 24 1.10<br />
65 0.96 78 1.01 14 0.75 26 1.00<br />
64 0.96 77 1.01 13 0.73 25 0.99<br />
111 0.99 105 0.96 47 1.24 53 1.31<br />
45 0.75 52 0.85 7 0.64 11 0.77<br />
80 1.07 89 1.08 21 1.12 34 1.19<br />
53 1.03 58 1.03 6 1.30 7 1.36<br />
81 1.07 90 1.08 22 1.12 35 1.19<br />
100 0.99 100 1.00 61 1.23 70 1.33<br />
87 0.98 88 0.96 38 1.18 62 1.25<br />
Source: Annex, Statistical Tables 8 and 9A.<br />
80
PROGRESS TOWARDS THE <strong>EFA</strong> GOALS<br />
Youth and adult skills — expanding opportunities in <strong>the</strong> new global economy<br />
starting points. Secondary gross enrolment levels<br />
ranged from 34% in sub-Saharan Africa to 65% in<br />
<strong>the</strong> Arab States and 90% in Latin America in 2007.<br />
Tertiary enrolment was just 6% in sub-Saharan<br />
Africa, compared with 22% in <strong>the</strong> Arab States and<br />
35% in Latin America. These regional averages<br />
conceal large intra-regional disparities. While <strong>the</strong><br />
average secondary participation level was 90% in<br />
Latin America and <strong>the</strong> Caribbean, it was less than<br />
70% for some countries in <strong>the</strong> region, including<br />
El Salvador, Guatemala, Honduras and Nicaragua.<br />
Gender disparities in secondary school have an<br />
important bearing on opportunities for technical<br />
and vocational education. The two regions with <strong>the</strong><br />
largest gender disparities are South and West Asia,<br />
and sub-Saharan Africa. While <strong>the</strong> former has<br />
achieved a marked improvement in gender parity<br />
since 1999, <strong>the</strong> latter has moved in <strong>the</strong> opposite<br />
direction: <strong>the</strong> secondary-level GPI for sub-Saharan<br />
Africa has slipped from 0.82 to 0.79. This points to<br />
<strong>the</strong> importance of public policy interventions to<br />
streng<strong>the</strong>n opportunities for young girls to make<br />
<strong>the</strong> transition from primary to secondary school.<br />
In Latin America and <strong>the</strong> Caribbean, where more<br />
girls than boys attend secondary school, <strong>the</strong>re has<br />
been no progress in narrowing <strong>the</strong> gender gap.<br />
Gender inequalities are often more pronounced<br />
in technical and vocational education than in<br />
general education. In South and West Asia, and<br />
sub-Saharan Africa, girls accounted for 44% of<br />
students in secondary school in 2007, but just 27%<br />
and 39%, respectively, in technical and vocational<br />
education. In nine of <strong>the</strong> eleven Arab states for<br />
which data are available, girls accounted for less<br />
than 40% of enrolment. The same is true for twelve<br />
of <strong>the</strong> twenty-five countries in sub-Saharan Africa<br />
with reported data. These disparities tell only a<br />
small part of a far wider story of gender inequality.<br />
In many cases, young girls in technical and<br />
vocational streams are being trained for traditional<br />
female occupations, often in areas characterized<br />
by low pay. Moreover, returns to vocational<br />
education are often lowered by gender<br />
discrimination in employment and wages.<br />
Prospects for successful vocational education<br />
provision are inevitably shaped by <strong>the</strong> wider<br />
learning environment. One of <strong>the</strong> lessons from<br />
successful countries in East Asia and elsewhere<br />
is that high levels of literacy, numeracy and broadbased<br />
general education are <strong>the</strong> real foundation<br />
for acquiring flexible and transferrable vocational<br />
skills. Many countries lack <strong>the</strong> foundation.<br />
Consider <strong>the</strong> prospects for 15-year-olds in different<br />
parts of <strong>the</strong> world (Figure <strong>2.</strong>24). In OECD countries,<br />
85% of 15- to 19-year-olds are in full-time<br />
education and at 15 a student can expect to<br />
continue for seven more years (Kuczera et al., 2008;<br />
OECD, 2008b). This compares with less than one<br />
year in South and West Asia. In sub-Saharan Africa,<br />
<strong>the</strong> average 15-year-old does not attend school.<br />
In countries including Burkina Faso, Ethiopia and<br />
Mozambique, more than 75% of young people who<br />
do not go to school report having no education<br />
(Garcia and Fares, 2008).<br />
Failures in basic education have important<br />
consequences for technical and vocational<br />
education. In sub-Saharan Africa, and South and<br />
West Asia, technical and vocational education<br />
reaches 1% to 2% of <strong>the</strong> total secondary school age<br />
group (Table <strong>2.</strong>4). One reason for this is that, in<br />
many countries in both regions, only a small share<br />
of <strong>the</strong> secondary school age population reaches<br />
<strong>the</strong> middle grades of secondary school.<br />
One important policy conclusion to be drawn from<br />
<strong>the</strong> data in <strong>the</strong>se regions is that no national policy<br />
for developing skills is likely to succeed unless<br />
governments dramatically increase <strong>the</strong> flow of<br />
students into secondary school.<br />
The foundations for learning are established in<br />
primary school and nurtured in <strong>the</strong> early secondary<br />
Figure <strong>2.</strong>24: By age 15, many students in developing<br />
countries are nearing <strong>the</strong> end of <strong>the</strong>ir schooling<br />
School life expectancy from primary to tertiary education,<br />
by region, 2007<br />
World<br />
Developing countries<br />
Countries in transition<br />
Developed countries<br />
Sub-Saharan Africa<br />
South/West Asia<br />
Arab States<br />
East Asia/Pacific<br />
Central Asia<br />
Centr./East. Europe<br />
Latin America/Caribbean<br />
N. America/W. Europe<br />
Age 15*<br />
0 2 4 6 8 10 12 14 16<br />
School life expectancy (years)<br />
* This is a <strong>the</strong>oretical threshold that assumes an intake age of 6 in all regions.<br />
Source: Annex, Statistical Table 4.<br />
In sub-Saharan<br />
Africa, <strong>the</strong> average<br />
15-year-old does<br />
not attend school<br />
81
0<br />
1<br />
2<br />
0<br />
CHAPTER 2<br />
Education for All Global Monitoring Report<br />
Youth aged<br />
15 to 24 make up<br />
one-quarter<br />
of <strong>the</strong> world’s<br />
population<br />
but almost half of<br />
<strong>the</strong> unemployed<br />
school years. People lacking <strong>the</strong>se foundations<br />
are not well placed to develop <strong>the</strong> type of flexible<br />
problem-solving capabilities needed to underpin<br />
more specialized learning. For countries where<br />
much of <strong>the</strong> youth population ei<strong>the</strong>r does not reach<br />
secondary school or lacks basic literacy and<br />
numeracy, technical and vocational education in<br />
secondary school can only have limited success<br />
as a national skills development strategy. It may<br />
make little sense to rapidly scale up investment<br />
in technical and vocational education in countries<br />
enrolling only a small proportion of <strong>the</strong> secondary<br />
school age group. Directing resources <strong>towards</strong><br />
improving access and <strong>the</strong> quality of education in<br />
core subjects is likely to prove far more effective<br />
and equitable (Lauglo and Maclean, 2005).<br />
Youth unemployment reveals<br />
<strong>the</strong> skills gap<br />
The broad aim of technical and vocational<br />
education is to equip young people and adults with<br />
<strong>the</strong> skills and knowledge <strong>the</strong>y need to cross <strong>the</strong><br />
bridge from school to work. The economic crisis<br />
has made that crossing even more hazardous.<br />
Young people who fail to make <strong>the</strong> transition often<br />
face <strong>the</strong> prospect of long-term unemployment and<br />
social marginalization, and run a higher risk of<br />
being drawn into illicit activities (Adams, 2008;<br />
Brewer, 2004).<br />
While <strong>the</strong> picture varies by region, governments’<br />
records in tackling youth unemployment over <strong>the</strong><br />
past decade have been disappointing. With global<br />
unemployment rising sharply in 2009, <strong>the</strong> record<br />
could deteriorate fur<strong>the</strong>r as young people are hit<br />
hardest by <strong>the</strong> job crisis.<br />
Pre-crisis trends were not encouraging<br />
Education and demographic trends, coupled<br />
with rapid economic growth before <strong>the</strong> 2008<br />
economic downturn, might have been expected<br />
to reduce youth unemployment, with <strong>the</strong> average<br />
number of years spent in school increasing and<br />
<strong>the</strong> youth share in <strong>the</strong> working age population<br />
declining in all regions, with <strong>the</strong> notable exception<br />
of sub-Saharan Africa.<br />
Instead, <strong>the</strong> International Labour Organization (ILO)<br />
reported a 13% rise in youth unemployment, from<br />
63 million in 1996 to 71 million in 2007. Labour<br />
market demand is one factor behind this trend.<br />
Economic growth has not generated employment<br />
on <strong>the</strong> scale that might have been anticipated.<br />
At <strong>the</strong> same time, rising youth unemployment<br />
during a period of sustained economic expansion<br />
points to a mismatch between skills acquired in<br />
education and labour market demand. The<br />
upshot is that young people bear <strong>the</strong> brunt of<br />
unemployment. Before <strong>the</strong> crisis, <strong>the</strong> global youth<br />
unemployment rate stood at 12%, or around three<br />
times <strong>the</strong> adult unemployment rate (ILO, 2008a).<br />
In every region, youth unemployment rates are<br />
higher than those for older workers. Youth aged 15<br />
to 24 make up one-quarter of <strong>the</strong> world’s<br />
population but almost half of <strong>the</strong> unemployed.<br />
Young people are now in <strong>the</strong> front line of <strong>the</strong> global<br />
economic downturn. Recent estimates suggest that<br />
world unemployment could be 39 million higher<br />
by <strong>the</strong> end of 2009, compared with 2007, and that<br />
youth unemployment may rise by between 5 million<br />
and 17.7 million. The youth unemployment rate is<br />
projected to increase from around 12% in 2008 to<br />
between 14% and 15% in 2009 (CINTERFOR/ILO,<br />
2009). Employers are more prone to dismiss young<br />
workers – especially unskilled young women –<br />
because youth tend to have <strong>the</strong> least secure<br />
employment conditions and are often not covered<br />
by labour regulations (CINTERFOR/ILO, 2009).<br />
Youth unemployment patterns vary across <strong>the</strong><br />
developing regions (Figure <strong>2.</strong>25). The ILO reports<br />
that <strong>the</strong> Middle East and North Africa have <strong>the</strong><br />
highest unemployment rates, with about one-fifth<br />
of 15- to 24-year-olds unemployed. In Egypt, youth<br />
account for more than 60% of <strong>the</strong> unemployed.<br />
Gender discrimination, both in terms of job<br />
segmentation and wages, is deeply entrenched in<br />
Arab States’ labour markets (Salehi-Isfahani and<br />
Dhillon, 2008). In Egypt, fewer than one-quarter<br />
of women aged 15 to 29 are economically active –<br />
one-third <strong>the</strong> male rate. The transition from school<br />
to work is also more difficult for girls, with fewer<br />
than 25% of young women finding work within<br />
five years (Assad and Barsoum, 2007). Employer<br />
discrimination, early marriage and claims on <strong>the</strong><br />
labour of women at home all reinforce gender<br />
disadvantage in labour markets.<br />
Demography and poverty combine to leave sub-<br />
Saharan Africa facing particularly stark challenges<br />
in youth employment. The region’s share of <strong>the</strong><br />
world’s youth population, currently about 17%, will<br />
be some 25% by 2025. Almost two-thirds of <strong>the</strong><br />
population is under 25. The transition from school<br />
to work is enormously difficult for this growing<br />
population. Every year between 7 million and<br />
10 million young Africans enter labour markets<br />
characterized by high unemployment, low<br />
82
PROGRESS TOWARDS THE <strong>EFA</strong> GOALS<br />
Youth and adult skills — expanding opportunities in <strong>the</strong> new global economy<br />
productivity, chronic insecurity and poverty-level<br />
incomes (Garcia and Fares, 2008).<br />
Figure <strong>2.</strong>25: Gender inequalities reinforce high levels of youth unemployment<br />
Youth unemployment rates by region* and gender, 2007<br />
Unemployment is just one of <strong>the</strong> problems<br />
young people encounter as <strong>the</strong>y seek to enter<br />
<strong>the</strong> workforce. Many face protracted delays in<br />
securing <strong>the</strong>ir first jobs. In much of <strong>the</strong> Middle<br />
East and North Africa, <strong>the</strong> average duration of<br />
unemployment for first-time job seekers is<br />
measured in years ra<strong>the</strong>r than months. In sub-<br />
Saharan African countries including Ethiopia,<br />
Malawi, Mozambique and Zambia, young people<br />
face about five years of reported inactivity before<br />
finding work (Garcia and Fares, 2008).<br />
Youth unemployment rates (%)<br />
35<br />
30<br />
25<br />
20<br />
15<br />
10<br />
Female<br />
Average<br />
Male<br />
Education is not an automatic panacea for<br />
delayed employment. In many Arab states, young<br />
people with secondary and tertiary education face<br />
longer periods of unemployment than <strong>the</strong>ir peers<br />
with only basic education. Similarly, in several<br />
countries of sub-Saharan Africa, including<br />
Burundi, Cameroon, Kenya and Nigeria, youth<br />
with secondary and tertiary education have higher<br />
rates of unemployment than those with lower<br />
levels of attainment (Fares et al., 2005; Garcia<br />
and Fares, 2008).<br />
Comparisons across developing regions have to<br />
be made with caution. Gender parity in reported<br />
youth unemployment in South Asia and sub-<br />
Saharan Africa does not imply gender equity<br />
in labour markets. In both regions, many young<br />
women provide unpaid labour in <strong>the</strong> household<br />
and do not participate in paid employment. 23<br />
Similarly, lower levels of youth unemployment<br />
do not necessarily correspond to higher levels of<br />
decent employment. Poverty forces millions of<br />
people into insecure, low-wage jobs in <strong>the</strong> informal<br />
sector. The ILO estimates that 300 million young<br />
people are ‘working poor’ who live on less than<br />
US$2 a day (CINTERFOR/ILO, 2009).<br />
Developed countries also face acute problems<br />
Economic recession in OECD countries is pushing<br />
unemployment to record levels. In developed<br />
countries as a group, unemployment is projected<br />
to peak at 7.3% in 2010, compared with 5.5% in<br />
2007 (OECD, 2009d). The scenario could worsen<br />
if economic recovery is delayed.<br />
As in developing regions, <strong>the</strong> economic downturn<br />
in rich countries comes against a discouraging<br />
backdrop for youth employment (Figure <strong>2.</strong>26).<br />
Despite strong economic growth from 1997 to 2007,<br />
<strong>the</strong> youth unemployment rate in OECD countries<br />
5<br />
0<br />
World<br />
East Asia<br />
South Asia<br />
Sub-Saharan<br />
Africa<br />
Latin<br />
America/<br />
Caribbean<br />
South-East<br />
Asia and<br />
<strong>the</strong> Pacific<br />
* Regions presented are those used by <strong>the</strong> ILO, which differ to some extent from <strong>the</strong> <strong>EFA</strong> regions.<br />
Sources: ILO (2008b); OECD (2009f).<br />
Figure <strong>2.</strong>26: In most OECD countries, youth face greater<br />
risk of unemployment<br />
Youth and adult unemployment rates, selected OECD countries, 2008<br />
Norway<br />
Denmark<br />
Rep. of Korea<br />
Austria<br />
Australia<br />
Japan<br />
United Kingdom<br />
Sweden<br />
United States<br />
Canada<br />
OECD<br />
Italy<br />
France<br />
Greece<br />
Germany<br />
Turkey<br />
Spain<br />
Youth (15 to 24)<br />
Adult (25 to 54)<br />
0 5 10 15 20 25<br />
Unemployment rates (%)<br />
Source: OECD (2009f).<br />
Middle<br />
East<br />
North Africa<br />
In Burundi,<br />
Cameroon, Kenya<br />
and Nigeria, youth<br />
with secondary<br />
and tertiary<br />
education have<br />
higher rates<br />
of unemployment<br />
than those with<br />
lower levels<br />
of attainment<br />
23. In South Asia, <strong>the</strong> ILO<br />
reports just 22% of female<br />
youth in employment<br />
compared with 58% of<br />
male youth.<br />
83
0<br />
1<br />
2<br />
0<br />
CHAPTER 2<br />
Education for All Global Monitoring Report<br />
Spiralling youth<br />
unemployment<br />
has added<br />
a sense of<br />
urgency<br />
to national<br />
debates over<br />
technical<br />
and vocational<br />
training<br />
fell only a little, from 15% to 13% (CINTERFOR/ILO,<br />
2008). While some countries, including Australia,<br />
Canada, France and Spain, achieved marked<br />
reductions, six o<strong>the</strong>r countries, including <strong>the</strong><br />
United Kingdom, experienced increased youth<br />
unemployment.<br />
Young people with low skills are especially<br />
vulnerable, as was evident even before <strong>the</strong> deep<br />
recession took hold. In <strong>the</strong> OECD, for example,<br />
skilled jobs have been created at five times <strong>the</strong> rate<br />
of unskilled jobs since 2000 (OECD, 2008b). The<br />
skills gap helps explain <strong>the</strong> apparent paradox of high<br />
growth and stagnant youth unemployment in many<br />
countries. In <strong>the</strong> OECD countries as a group, people<br />
with low skills are twice as likely to be unemployed<br />
as those with high skills, increasing to four times as<br />
likely in <strong>the</strong> United States. The rising premium on<br />
skills has increased <strong>the</strong> penalties faced by those in<br />
<strong>the</strong> OECD’s large pockets of educational deprivation.<br />
Spiralling youth unemployment has added a<br />
sense of urgency to national debates over technical<br />
and vocational training. While <strong>the</strong> impact of <strong>the</strong><br />
economic slowdown is being felt across society,<br />
it has fallen most heavily on <strong>the</strong> young and people<br />
with low skills (OECD, 2009d). Young people<br />
typically find it hard to get established in <strong>the</strong> labour<br />
market because of <strong>the</strong>ir lack of experience, which<br />
makes <strong>the</strong>m especially vulnerable in a downturn.<br />
The young in general and those with low levels of<br />
qualification in particular are emerging as prime<br />
victims of <strong>the</strong> slump.<br />
A side effect of <strong>the</strong> downturn is that it has pushed<br />
technical and vocational education and training to<br />
<strong>the</strong> centre of <strong>the</strong> political agenda. In France, where<br />
even before <strong>the</strong> crisis almost one in five young<br />
people was out of work, a quarter of <strong>the</strong>m for more<br />
than one year, <strong>the</strong> government has launched an<br />
emergency youth employment programme focused<br />
on apprenticeships (CINTERFOR/ILO, 2009). In<br />
Japan, though youth unemployment rates are lower<br />
than in France, around one-third of workers aged 15<br />
to 24 are in temporary work with insecure contracts<br />
(OECD, 2009c). Here, too, measures have been<br />
introduced to facilitate school-to-work transition<br />
through firm-based training. Comparable measures<br />
involving incentives for young people to stay in<br />
education, training and apprenticeships are being<br />
used across <strong>the</strong> OECD.<br />
Looking beyond <strong>the</strong> immediate responses, it<br />
is important for governments to use <strong>the</strong> crisis<br />
as an opportunity to put in place <strong>the</strong> long-term<br />
investments and policies – in education and<br />
beyond – that are needed to combat <strong>the</strong><br />
marginalization of young people.<br />
Good intentions, poor results:<br />
problems in <strong>the</strong> developing world<br />
Much can be achieved through good-quality<br />
vocational education and training. But in many<br />
developing countries, vocational programmes<br />
have suffered from a combination of underfinancing,<br />
poor design and weak links to labour markets. In<br />
some regions – notably sub-Saharan Africa and<br />
Latin America – deep cuts in spending during <strong>the</strong><br />
1980s and 1990s fur<strong>the</strong>r compromised quality in<br />
vocational education (Johanson and Adams, 2004).<br />
Public investment has produced disappointing<br />
results, calling into question <strong>the</strong> potential for<br />
vocational education to fuel economic growth<br />
and reduce poverty.<br />
The poor track record is reflected in student and<br />
teacher preferences. In many countries, vocational<br />
options are viewed ei<strong>the</strong>r as a last resort or as a<br />
possible route back into general education, ra<strong>the</strong>r<br />
than as a stepping stone to employment. This is<br />
especially true of sub-Saharan Africa, where <strong>the</strong><br />
reluctance of parents to put <strong>the</strong>ir children into<br />
vocational streams is supported by evidence<br />
confirming that general education generates<br />
far higher returns than do vocational alternatives<br />
(Kahyarara and Teal, 2006). Thailand adopted<br />
<strong>the</strong> German dual system in 2005; successive<br />
governments have attempted to expand vocational<br />
education to combat child labour and <strong>the</strong><br />
marginalization of young people who drop out of<br />
school. However, while secondary school enrolment<br />
has doubled, vocational enrolment has failed to take<br />
off, reflecting concerns of parents and students<br />
about <strong>the</strong> quality of provision and <strong>the</strong> weakness<br />
of links to job markets (World Bank, 2008g).<br />
The Middle East: fragmentation<br />
and weak links to employment<br />
Faced with <strong>the</strong> world’s highest levels of youth<br />
unemployment, governments in <strong>the</strong> Middle East<br />
have identified vocational education as a priority.<br />
Two broad models have emerged. At one extreme,<br />
students in Egypt are tracked early, but vocational<br />
graduates suffer as much unemployment as <strong>the</strong>ir<br />
secondary school counterparts (Kamel, 2006;<br />
Salehi-Isfahani and Dhillon, 2008). In <strong>the</strong> Islamic<br />
Republic of Iran, where tracking into vocational<br />
education starts later, it is seen as a sign of failure,<br />
prompting many students to drop out. (Box <strong>2.</strong>12).<br />
84
PROGRESS TOWARDS THE <strong>EFA</strong> GOALS<br />
Youth and adult skills — expanding opportunities in <strong>the</strong> new global economy<br />
Box <strong>2.</strong>12: Training, skills and youth exclusion in <strong>the</strong> Islamic Republic of Iran<br />
The Islamic Republic of Iran’s experience demonstrates<br />
<strong>the</strong> challenges facing policy-makers across <strong>the</strong> Middle<br />
East. Over <strong>the</strong> past twenty years, <strong>the</strong> country has made<br />
rapid strides in education. Participation at secondary level<br />
has increased, average years in education have nearly<br />
doubled and gender inequalities have narrowed, especially<br />
in urban areas. Vocational education, however, reinforces<br />
a mismatch between skills and jobs that perpetuates high<br />
youth unemployment.<br />
The education system in <strong>the</strong> country is heavily oriented<br />
<strong>towards</strong> <strong>the</strong> university entrance exam, <strong>the</strong> concour,<br />
which parents and students see as a route to secure<br />
employment, usually in <strong>the</strong> public sector. Compulsory<br />
education ends at around age 15, when students are<br />
evaluated and directed on to three separate tracks: <strong>the</strong><br />
academic curriculum (Nazari), technical and vocational<br />
education (Fanni-Herfei) and basic skills through on-<strong>the</strong>job<br />
training (Kardanesh). The aim of <strong>the</strong> latter two is<br />
explicitly to focus on job skills, but <strong>the</strong> system fails on<br />
several fronts.<br />
Tracking brings high levels of attrition. Of <strong>the</strong> female<br />
students who began <strong>the</strong>ir secondary education in<br />
2003/2004, nearly one-third dropped out after tracking<br />
(Figure <strong>2.</strong>27). Most students pursue <strong>the</strong> Nazari track with<br />
a view to passing <strong>the</strong> concour, spurning <strong>the</strong> vocational<br />
tracks because of <strong>the</strong>ir low perceived status and quality.<br />
But of <strong>the</strong> nearly 1.5 million who proceed each year to<br />
<strong>the</strong> concour, 1.2 million fail and leave school lacking<br />
qualifications and job skills.<br />
Iranian policy-makers increasingly recognize <strong>the</strong> problems<br />
with <strong>the</strong> current system. Of particular concern are <strong>the</strong><br />
misalignment of education and labour markets, and <strong>the</strong><br />
poor quality of vocational education, which operates<br />
through a network of highly centralized public training<br />
centres. Many of <strong>the</strong>se lack equipment and well-trained<br />
instructors, and <strong>the</strong>y produce qualifications that<br />
employers see as having limited relevance.<br />
The concour system creates fur<strong>the</strong>r problems. Most of<br />
<strong>the</strong> exams are multiple choice, and teaching methods<br />
emphasize rote learning. Students o<strong>the</strong>r than those<br />
entering elite engineering and medical schools often<br />
emerge ill prepared to enter productive enterprises.<br />
The mismatch between education and employment is<br />
becoming increasingly stark. Steady economic growth<br />
has reduced overall unemployment, but youth<br />
unemployment remains over 20%. Those who completed<br />
upper secondary education have <strong>the</strong> highest level of<br />
unemployment (Figure <strong>2.</strong>28). Measured in terms of<br />
employment, <strong>the</strong> benefits of education are dwindling,<br />
along with <strong>the</strong> skills base of <strong>the</strong> Iranian economy.<br />
Education is only part of <strong>the</strong> story. Labour market rigidity<br />
and discrimination also play a role. Gender barriers to<br />
Figure <strong>2.</strong>27: In <strong>the</strong> Islamic Republic of Iran, vocational tracking<br />
comes with high dropout rates<br />
Cohort tracking at lower secondary level, students entered in 2003<br />
% of <strong>the</strong> cohort<br />
100<br />
80<br />
60<br />
40<br />
20<br />
0<br />
100<br />
Grade 1<br />
(2003)<br />
Attrition<br />
Female<br />
21<br />
13<br />
58<br />
Grade 2<br />
(2004)<br />
Grade 3<br />
(2005)<br />
Kardanesh<br />
(basic skills through<br />
on-<strong>the</strong>-job training)<br />
Source: Salehi-Isfahani and Egel (2007).<br />
8<br />
employment appear to be rising, with unemployment<br />
rates among women aged 20 to 24 now twice <strong>the</strong> level<br />
for men of that age group.<br />
Whatever <strong>the</strong> underlying causes, <strong>the</strong> skills mismatch<br />
is a pressing political concern. The rising proportion of<br />
young people in <strong>the</strong> population means <strong>the</strong> labour force<br />
is expanding by almost 4% a year, or nearly 1.2 million<br />
people. Many of <strong>the</strong>m will face social exclusion if <strong>the</strong><br />
Islamic Republic of Iran fails to create enough jobs and<br />
give its people <strong>the</strong> skills <strong>the</strong>y need to fill <strong>the</strong>m.<br />
100<br />
Sources: Salehi-Isfahani and Egel (2007); Povey (2005).<br />
29<br />
12<br />
7<br />
52<br />
80<br />
60<br />
40<br />
20<br />
0<br />
100<br />
Grade 1<br />
(2003)<br />
Fanni-Herfei<br />
(technical and<br />
vocational education)<br />
Male<br />
35<br />
Grade 2<br />
(2004)<br />
Figure <strong>2.</strong>28: Unemployment increases with level of education,<br />
but Iranian women are especially penalized<br />
Unemployment rates by educational attainment and gender, 2005<br />
Unemployment rates (%)<br />
60<br />
50<br />
40<br />
30<br />
20<br />
10<br />
0<br />
Male<br />
Female<br />
Illiterate Primary Lower<br />
secondary<br />
Source: Salehi-Isfahani and Egel (2007).<br />
% of <strong>the</strong> cohort<br />
Some upper<br />
secondary<br />
Upper<br />
secondary<br />
36<br />
16<br />
13<br />
Tertiary<br />
44<br />
14<br />
12<br />
29<br />
Grade 3<br />
(2005)<br />
Nazari<br />
(<strong>the</strong>oretical/<br />
academic<br />
curriculum)<br />
Total<br />
85
0<br />
1<br />
0<br />
CHAPTER 2<br />
2<br />
Education for All Global Monitoring Report<br />
In <strong>the</strong> Middle<br />
East, millions of<br />
youth leave<br />
school without<br />
employable skills<br />
24. One prominent<br />
example is <strong>the</strong> Mubarak-<br />
Kohl initiative, an<br />
arrangement involving<br />
<strong>the</strong> Ministry of Education,<br />
<strong>the</strong> German technical<br />
cooperation agency GTZ<br />
and business<br />
associations. The<br />
government provides<br />
premises, GTZ supplies<br />
technical experts and<br />
equipment, and business<br />
associations contribute<br />
training opportunities and<br />
allowances. So far,<br />
around 16,000 trainees<br />
have been trained in<br />
1,600 companies through<br />
45 technical secondary<br />
schools.<br />
High youth unemployment in <strong>the</strong> Middle East<br />
is about far more than a failure of vocational<br />
education. Slow economic growth, rigid labour<br />
markets and gender discrimination have all stymied<br />
job creation. In many cases, education systems are<br />
part of <strong>the</strong> employment problem. Courses are<br />
geared <strong>towards</strong> rote learning for university entrance<br />
exams that are seen as a route to public sector<br />
employment. The upshot is that millions of youth<br />
leave school without employable skills and millions<br />
more emerge from university lacking <strong>the</strong> capabilities<br />
needed to compete for entry into private sector<br />
employment (Salehi-Isfahani and Dhillon, 2008).<br />
Most parents and students in <strong>the</strong> Middle East<br />
see vocational education as unattractive because<br />
it receives meagre budget resources, is often<br />
delivered by badly trained teachers lacking in<br />
motivation, bears little relation to <strong>the</strong> skills<br />
employers seek and produces certificates that<br />
are not subject to uniform standards. Part of <strong>the</strong><br />
problem in many countries is that <strong>the</strong> private<br />
sector has a limited voice in setting priorities and<br />
standards (DFID and World Bank, 2005). As a result,<br />
<strong>the</strong> skills delivered through vocational programmes<br />
are often of little relevance. In addition, governance<br />
typically falls to a range of ministries and<br />
government agencies, so it is often fragmented<br />
and poorly coordinated. There are some notable<br />
exceptions. In Egypt, innovative partnerships are<br />
bringing toge<strong>the</strong>r governments, business and<br />
donors. 24 And Morocco has adopted far-reaching<br />
governance reforms aimed at improving quality,<br />
relevance and equity (Box <strong>2.</strong>13).<br />
Box <strong>2.</strong>13: Morocco — streng<strong>the</strong>ning<br />
vocational governance<br />
In Morocco, vocational education has been<br />
overhauled in <strong>the</strong> past decade. It has its own<br />
ministry and a national office for vocational<br />
training and work promotion. Syllabuses are<br />
adapted to trainees’ general education level, with<br />
an emphasis on a combination of specific skills<br />
and broader capabilities. Vocational schools have<br />
achieved good results, with more than half of<br />
graduates finding a job within nine months. The<br />
proportion of female trainees is rising, reaching<br />
44% in 2006. The vocational system is expanding<br />
as <strong>the</strong> government seeks to foster <strong>the</strong> skills<br />
needed by new sectors such as vehicle<br />
manufacture, aeronautics and agro-industry.<br />
Source: African Development Bank/OECD (2008d).<br />
In India, limited reach and duplication<br />
Technical and vocational education systems in many<br />
countries suffer from inadequate reach as well as<br />
limited benefits for participants. In India, only 3% of<br />
rural youth and 6% of urban youth have had any kind<br />
of vocational training (India Ministry of Health and<br />
Family Welfare, 2006; India Planning Commission,<br />
2008). The country’s Industrial Training Institutes<br />
and various craft centres are not accessible to<br />
<strong>the</strong> vast majority of <strong>the</strong> poor. India also has some<br />
of <strong>the</strong> world’s largest reported gender disparities<br />
in technical and vocational education, with girls<br />
accounting for just 7% of enrolment at <strong>the</strong><br />
secondary level and <strong>the</strong>ir courses heavily<br />
concentrated in traditional areas such as nursing<br />
and sewing. In general, <strong>the</strong> benefits of vocational<br />
training are not immediately apparent. Some 60% of<br />
graduates from Industrial Training Institutes are still<br />
unemployed three years later (World Bank, 2006g).<br />
Industrial apprentices are more likely to get work,<br />
but generally not in <strong>the</strong> trade for which <strong>the</strong>y trained.<br />
Governance problems have hampered India’s efforts<br />
to streng<strong>the</strong>n vocational education. Responsibilities<br />
are split among <strong>the</strong> Ministry of Labour, <strong>the</strong> Ministry<br />
of Human Resource Development, o<strong>the</strong>r national<br />
bodies and state authorities. Duplication and<br />
fragmentation are widespread, <strong>the</strong>re is little control<br />
over quality and <strong>the</strong> certification system is poorly<br />
understood by employers. Companies and employer<br />
organizations are only marginally involved, though<br />
efforts are being made to streng<strong>the</strong>n <strong>the</strong>ir<br />
engagement.<br />
Sub-Saharan Africa:<br />
failing to reach <strong>the</strong> marginalized<br />
Governments in sub-Saharan Africa face some<br />
of <strong>the</strong> toughest challenges in reforming technical<br />
and vocational education. Finance is part of <strong>the</strong><br />
problem – institutions across <strong>the</strong> region suffer<br />
from a familiar combination of underinvestment<br />
in equipment, low pay for instructors and problems<br />
recruiting qualified staff. But not all <strong>the</strong> difficulties<br />
can be traced to financial causes.<br />
Many countries track students into vocational<br />
education far too early – often in <strong>the</strong> face of<br />
concerted resistance from parents. Parental<br />
concerns are often well grounded. Evaluations<br />
point to low rates of absorption of graduates<br />
into employment – under half in some countries,<br />
including Madagascar, Mali and <strong>the</strong> United Republic<br />
of Tanzania (Johanson and Adams, 2004). The<br />
resulting unemployment, even in countries where<br />
employers face shortages of skilled secondary<br />
86
PROGRESS TOWARDS THE <strong>EFA</strong> GOALS<br />
Youth and adult skills — expanding opportunities in <strong>the</strong> new global economy<br />
school graduates, points to a mismatch between<br />
learning and labour market needs.<br />
The high cost of vocational education is ano<strong>the</strong>r<br />
factor. Partly because class sizes are much smaller<br />
than in general education and <strong>the</strong> cost of equipment<br />
is higher, vocational education faces far higher per<br />
capita costs – about twelve times <strong>the</strong> average for<br />
primary school and four times that for secondary<br />
school (Atchoarena and Delluc, 2001).<br />
Problems in vocational education are a legacy<br />
of past policy failures and a difficult environment.<br />
The quality of provision suffered enormously with<br />
deep cuts in spending under structural adjustment<br />
programmes in <strong>the</strong> 1980s and 1990s. Wider<br />
problems have also been evident. Vocational<br />
systems were designed to meet <strong>the</strong> needs of formal<br />
sector employers, notably in government (Adams,<br />
2008; Africa Commission, 2008). For at least three<br />
decades, however, formal sector job creation has<br />
stagnated while informal sector employment has<br />
grown in importance. In most countries, informal<br />
employment and self-employment dominate in<br />
both rural and urban areas, typically accounting for<br />
over 80% of total employment. 25 Providing training<br />
to those employed in <strong>the</strong> informal sector involves<br />
reaching people with lower levels of education.<br />
A survey covering Kenya, Senegal, <strong>the</strong> United<br />
Republic of Tanzania, Zambia and Zimbabwe<br />
reported that half of informal sector workers<br />
had only primary education, if any (Haan, 2006;<br />
Liimatainen, 2002).<br />
The need to reduce poverty makes it vital to reach<br />
<strong>the</strong>se people, yet most vocational systems fail to<br />
deliver. Traditional apprenticeships and on-<strong>the</strong>-job<br />
training are by far <strong>the</strong> most important routes to<br />
skills development for <strong>the</strong> vast majority of African<br />
youth (ILO, 2007; Wachira et al., 2008). On one<br />
estimate <strong>the</strong>y account for up to 70% of overall<br />
training (Liimatainen, 2002). The strength of<br />
traditional apprenticeships is that <strong>the</strong>y provide youth<br />
who have low levels of education with practical,<br />
employable skills (Monk et al., 2008). On a more<br />
negative note, apprenticeships tend to be biased<br />
against young women and <strong>the</strong> very poor. They also<br />
perpetuate <strong>the</strong> use of traditional methods, offering<br />
little <strong>the</strong>oretical knowledge (Adams, 2008).<br />
Vocational education could help redress <strong>the</strong> equity<br />
balance by targeting those who face <strong>the</strong> most acute<br />
disadvantages. Unfortunately, evidence from<br />
national evaluations points in <strong>the</strong> opposite direction.<br />
Research in Ghana has highlighted a bias <strong>towards</strong><br />
regions and social groups that are already better off<br />
(Box <strong>2.</strong>14). The broader failure to integrate technical<br />
and vocational education into strategies for reaching<br />
marginalized groups is clear in results from recent<br />
evaluations (based on Garcia and Fares, 2008):<br />
In Burkina Faso, only one-third of interventions<br />
involving technical and vocational education were<br />
oriented <strong>towards</strong> disadvantaged groups, mainly<br />
through micro-credit programmes.<br />
In <strong>the</strong> United Republic of Tanzania, out of<br />
twenty-eight programmes reviewed, only three<br />
targeted <strong>the</strong> poorest youth, one targeted youth<br />
with no education and three targeted rural areas<br />
(where <strong>the</strong> vast majority of <strong>the</strong> poor live).<br />
In a region where 95 million young men and<br />
women have no education and are unemployed,<br />
have low-paying jobs or have withdrawn from <strong>the</strong><br />
labour force, second-chance programmes are<br />
virtually non-existent. A review covering Burkina<br />
Faso, Ethiopia, Uganda and <strong>the</strong> United Republic<br />
of Tanzania concluded that ‘most second-chance<br />
interventions are small in scale, underevaluated<br />
and face severe challenges for sustainability<br />
and scalability (Garcia and Fares, 2008, p. xxx).’<br />
The problems evident in vocational education<br />
in sub-Saharan Africa are widely recognized by<br />
governments, regional organizations and aid donors<br />
(Africa Commission, 2008; COMEDAF II+, 2007).<br />
Across <strong>the</strong> region, vocational education is<br />
undergoing major reform. Several countries<br />
have created or streng<strong>the</strong>ned national training<br />
authorities, reformed qualification systems and<br />
created structures giving <strong>the</strong> private sector a<br />
stronger voice:<br />
In Cameroon, <strong>the</strong> four ministries involved in<br />
vocational education have developed a sectorwide<br />
plan linked to <strong>the</strong> national poverty reduction<br />
strategy (African Development Bank, 2008a).<br />
In Ethiopia, new curricula have been drawn up<br />
and qualification systems restructured to bolster<br />
<strong>the</strong> development of skills that labour markets<br />
need (African Development Bank, 2008b).<br />
In Rwanda, a strategy adopted in 2007 sets<br />
out ambitious <strong>goals</strong> for changing <strong>the</strong> image of<br />
vocational education. A Workforce Development<br />
Authority has been created to oversee coordination<br />
and facilitate private sector involvement (African<br />
Development Bank/OECD, 2008f).<br />
Vocational<br />
education is failing<br />
to target those<br />
who face <strong>the</strong><br />
most acute<br />
disadvantages<br />
25. Reporting conventions<br />
make it difficult to compare<br />
across countries (Adams,<br />
2008). The reported share<br />
of informal employment in<br />
total employment ranges<br />
from over 90% in Mali<br />
(where agriculture is<br />
included) to 22% in <strong>the</strong><br />
United Republic of Tanzania<br />
(where agriculture is<br />
excluded).<br />
87
0<br />
1<br />
0<br />
CHAPTER 2<br />
2<br />
Education for All Global Monitoring Report<br />
In Ghana,<br />
vocational<br />
programmes have<br />
suffered from<br />
fragmented<br />
administration<br />
and poor quality<br />
Box <strong>2.</strong>14: Vocational education in Ghana — limited access and poor quality<br />
Since independence half a century ago, political<br />
leaders in Ghana have seen technical and vocational<br />
education as a means of generating jobs. Yet<br />
vocational programmes have suffered from<br />
fragmented administration, a proliferation of<br />
qualification standards and poor quality.<br />
Public vocational education in Ghana operates<br />
through two tracks. The first, extending from lower<br />
secondary to post-secondary, is administered by <strong>the</strong><br />
Ministry of Education and Social Service and operates<br />
through Technical Training Institutes. The second<br />
track is run by National Vocational Training Institutes<br />
attached to <strong>the</strong> Ministry of Manpower, Youth and<br />
Employment. Several o<strong>the</strong>r ministries, agencies<br />
and private institutions are involved, each offering<br />
its own programmes.<br />
The pipeline into vocational education starts in junior<br />
secondary school, but parents and students tend to<br />
shun vocational streams, with just 5% of students<br />
entering public vocational institutions. The share of<br />
adults aged 20 to 26 years with formal vocational<br />
training stood at just 2% in 2005.<br />
Reviews of Ghana’s vocational system have<br />
consistently highlighted problems of coherence and<br />
coordination. Political oversight has been minimal.<br />
Despite what one report describes as a ‘dizzying<br />
array’ of examinations, programmes have failed<br />
to provide <strong>the</strong> skills employers seek. One reason<br />
is a multiplicity of certification and testing standards<br />
developed without employer advice.<br />
The quality of instruction is far from satisfactory.<br />
Ill-trained instructors, low salaries and outdated<br />
equipment all contribute. While some public<br />
institutions do provide high-quality training, <strong>the</strong>y<br />
remain <strong>the</strong> exception.<br />
There are few evaluations of <strong>the</strong> benefits of<br />
vocational education for Ghana’s youth. The available<br />
evidence suggests that graduates of <strong>the</strong> public<br />
system, including polytechnics, are prone to high<br />
unemployment. This is unsurprising given that<br />
teaching is geared <strong>towards</strong> <strong>the</strong> demands of <strong>the</strong> small<br />
formal sector, ra<strong>the</strong>r than an informal sector that on<br />
one estimate delivers 80% to 90% of skills training.<br />
The cost side of <strong>the</strong> equation is better understood.<br />
Vocational programmes account for about 1% of <strong>the</strong><br />
education budgets. However, recurrent per capita<br />
costs in 2006 were five times higher than in primary<br />
education and almost three times higher than in<br />
senior secondary.<br />
Equity is ano<strong>the</strong>r major concern. While policy<br />
documents emphasize <strong>the</strong> importance of linking<br />
vocational education to <strong>the</strong> national poverty reduction<br />
strategy, marginalized groups are effectively excluded.<br />
Participation rises with income levels, with <strong>the</strong> richest<br />
quintile seven times more likely than <strong>the</strong> poorest<br />
to have received vocational education. Regional<br />
inequality is marked: <strong>the</strong> nor<strong>the</strong>rn region, Ghana’s<br />
poorest, has one of <strong>the</strong> lowest levels of vocational<br />
enrolment. There is a bias <strong>towards</strong> males, especially<br />
in urban areas. And vocational graduates are twenty<br />
times more likely to work in <strong>the</strong> formal sector than<br />
be self-employed as farmers, reflecting a bias<br />
against agriculture.<br />
Ra<strong>the</strong>r than counteracting <strong>the</strong> disadvantages<br />
associated with limited access to education,<br />
apprenticeship programmes have <strong>the</strong> opposite effect —<br />
young people with an incomplete primary education<br />
are half as likely to make it into apprenticeship as<br />
those with a secondary education.<br />
The government has adopted reforms aimed at<br />
establishing a more efficient and equitable system.<br />
The Council for Technical and Vocational Education<br />
and Training was created in 2006 as an autonomous<br />
oversight body, along with <strong>the</strong> Skills Training and<br />
Employment Placement (STEP) programme which<br />
targets low-skilled unemployed youth seeking<br />
apprenticeships. It is too early to evaluate <strong>the</strong><br />
latest reforms.<br />
Sources: Adams et al. (2008); African Development Bank/OECD<br />
(2008c); Akyeampong (2007); Ghana Ministry of Education,<br />
Youth and Sports (2004a, 2004b); Palmer (2007).<br />
There are also signs that vocational education<br />
is re-emerging as a priority in development<br />
assistance. Several countries, notably Germany<br />
and Japan, have been giving precedence to<br />
support for <strong>the</strong> sector.<br />
It is too early to evaluate <strong>the</strong> results of <strong>the</strong><br />
latest wave of reform. In some cases, old<br />
models have proved highly resilient.<br />
Mozambique’s government set out a bold strategy,<br />
<strong>the</strong> Integrated Professional Reform Programme,<br />
aimed at bringing vocational planning under a<br />
single umbrella, with a unified qualification and<br />
accreditation programme (African Development<br />
Bank/OECD, 2008e). Two years before <strong>the</strong> end of<br />
its first phase, however, <strong>the</strong>re has been little<br />
progress in implementing it.<br />
88
PROGRESS TOWARDS THE <strong>EFA</strong> GOALS<br />
Youth and adult skills — expanding opportunities in <strong>the</strong> new global economy<br />
As in o<strong>the</strong>r regions, governments in sub-Saharan<br />
Africa have to strike a delicate balance between<br />
general and technical and vocational education.<br />
The overwhelming priority for <strong>the</strong> region is to<br />
increase enrolment, retention and progression<br />
through basic education into secondary school.<br />
Vocational education has <strong>the</strong> potential to play a<br />
far greater role, however, not least in providing<br />
second-chance opportunities to marginalized youth.<br />
Public investment and international aid should be<br />
directed <strong>towards</strong> creating opportunities for <strong>the</strong><br />
poor, in rural areas and in informal employment,<br />
with private spending and investment by companies<br />
financing training for higher-income groups.<br />
Offering young people<br />
a second chance<br />
Technical and vocational education can extend<br />
opportunities for young people still in school.<br />
But what of <strong>the</strong> millions of young adults who have<br />
never gone to school or have left education with<br />
levels of achievement falling far short of what<br />
<strong>the</strong>y need? Can vocational education offer an<br />
effective ‘second chance’ for avoiding a future of<br />
marginalization? The economic crisis has given that<br />
question renewed relevance because young people<br />
suffer most when labour demand is reduced.<br />
Comparing <strong>the</strong> effectiveness of ‘second-chance’<br />
programmes and wider targeted interventions<br />
for combating marginalization through vocational<br />
education is inherently difficult because underlying<br />
patterns of marginalization vary. In developed<br />
countries, <strong>the</strong> problem is concentrated at <strong>the</strong><br />
upper secondary level. Data from <strong>the</strong> United States<br />
indicate that nearly 6.2 million of <strong>the</strong> country’s<br />
16- to 24-year-olds – 16% of <strong>the</strong> age group –<br />
have left secondary school with no diploma. 26 In<br />
France, about 18% of young people lack minimum<br />
secondary school qualifications (OECD, 2009b).<br />
The yardstick for measuring education<br />
marginalization in developing countries is different.<br />
Millions of young people in Latin America and <strong>the</strong><br />
Arab States, especially those from <strong>the</strong> poorest<br />
households, have just one or two years of<br />
secondary school, or less. In many low-income<br />
countries, only a minority of young people have<br />
been to secondary school at all – and an<br />
incomplete primary education is often <strong>the</strong> norm. 27<br />
Evaluations around <strong>the</strong> world show that<br />
‘second-chance’ programmes can make a<br />
difference. Comprehensive approaches that<br />
provide training as part of a wider package are<br />
more likely to succeed. In <strong>the</strong> United States, <strong>the</strong><br />
Job Corps programme offers 16- to 24-year-olds<br />
education and training alongside a wide range<br />
of support services (Schochet et al., 2003). 28<br />
Modelled partly on <strong>the</strong> Job Corps experience,<br />
<strong>the</strong> Jóvenes programmes in several Latin American<br />
countries, including Argentina, Chile, Peru and<br />
Uruguay, have been particularly successful in<br />
reaching <strong>the</strong> marginalized (Box <strong>2.</strong>15).<br />
Skills for <strong>the</strong> twenty-first century<br />
The Jóvenes programmes are effective because<br />
<strong>the</strong>y provide an integrated framework for reaching<br />
<strong>the</strong> marginalized and linking employment with<br />
skills training. That key principle also underpins<br />
ano<strong>the</strong>r programme in Latin America and<br />
<strong>the</strong> Caribbean, Entra 21, launched in 2001 by<br />
<strong>the</strong> International Youth Foundation to equip<br />
unemployed youth with information technology<br />
skills. An evaluation in six countries points<br />
to encouraging results for both employment<br />
and earnings (Box <strong>2.</strong>16).<br />
Remedial education combined with flexible<br />
courses targeted at marginal populations provides<br />
ano<strong>the</strong>r way to offer <strong>the</strong> young a second chance.<br />
In Bangladesh, a large-scale programme operated<br />
by a non-government organization targets young<br />
people who have dropped out of formal education.<br />
Classes designed to facilitate early catch-up are<br />
followed by vocational programmes developed<br />
with companies (World Bank, 2006j). In Chile,<br />
<strong>the</strong> Califica programme is aimed at youth and<br />
young adults who lack formal secondary education.<br />
It includes a secondary education equivalency<br />
component that enables people over 18 to study<br />
in a certified institution and to gain a certificate<br />
that facilitates access to a wide range of vocational<br />
courses (Gallart, 2008).<br />
Successful second-chance programmes have<br />
to be accessible and affordable to people living<br />
in poverty, be flexible enough to fit in with <strong>the</strong> lives<br />
of <strong>the</strong>ir target population and be seen to deliver<br />
results (Jimenez et al., 2007). One of <strong>the</strong> most<br />
successful models has emerged in Mexico. The<br />
Open Secondary School system, aimed at young<br />
adults who have dropped out of secondary school,<br />
offers second-chance opportunities in thirty-three<br />
subjects covered in grades 10 to 1<strong>2.</strong> There are<br />
no entrance requirements and no time limit<br />
on completion, and students can determine<br />
<strong>the</strong>ir own schedules. The average period for<br />
completion is three to five years, after which<br />
‘Second-chance’<br />
programmes can<br />
help combat youth<br />
marginalization<br />
26. It is estimated that<br />
secondary school dropouts<br />
earn US$485,000 less<br />
on average during <strong>the</strong>ir<br />
lifetime than do secondary<br />
school graduates (Center for<br />
Labor Market Studies, 2007).<br />
27. These issues are taken<br />
up in <strong>Chapter</strong> 3.<br />
28. The evaluation found that<br />
students graduating from<br />
Job Corps programmes<br />
gained an average increase<br />
in income of around 12%<br />
(Schochet et al., 2003).<br />
89
0<br />
0<br />
1<br />
CHAPTER 2<br />
2<br />
Education for All Global Monitoring Report<br />
Box <strong>2.</strong>15: Linking skills and employment — Jóvenes programmes in Latin America<br />
Experience from Jóvenes programmes in Latin<br />
America provides some important insights into<br />
<strong>the</strong> conditions for successful youth training.<br />
Initiated in Chile in 1990, Jóvenes programmes<br />
are now well established across <strong>the</strong> region. They<br />
reach out to young people, combining technical<br />
training and internship with basic life skills<br />
and o<strong>the</strong>r support services. More than 60%<br />
of participants come from low-income families.<br />
The programmes tend to raise <strong>the</strong> probability<br />
of employment and higher wages. In Argentina,<br />
Proyecto Joven increased employment and wages<br />
by about 10% compared with a control group.<br />
Although implementation and management<br />
structures vary, evaluations show that successful<br />
programmes in Argentina, Chile, Peru and<br />
Uruguay share some common elements:<br />
Strong targeting. Programmes are aimed<br />
at youth from low-income families and those<br />
who have low educational attainment and<br />
limited work experience. In some cases,<br />
preference is given to household heads with<br />
children, in order to combat child poverty.<br />
Training is linked with work and wider skills.<br />
Most programmes provide training, work<br />
experience, literacy and numeracy courses, and<br />
a wide range of auxiliary packages, including job<br />
search assistance. The training component is<br />
aimed at helping participants attain semi-skilled<br />
status in trades for which <strong>the</strong>re is demand.<br />
Work experience takes place under <strong>the</strong> auspices<br />
of a company, which assumes a tutoring role<br />
but is not obliged to pay trainees or guarantee<br />
employment. Training and work experience<br />
usually last about six months and include<br />
broader life skills such as communication,<br />
teamwork and self-esteem.<br />
Management and coordination. The state<br />
assumes control of programme design,<br />
supervision and full or partial financing,<br />
but in most countries, training delivery is<br />
decentralized. The private sector provides<br />
a link to <strong>the</strong> job market. In Chile, <strong>the</strong><br />
programme operates through about<br />
1,000 training providers, ranging from<br />
companies to non-government organizations.<br />
Sources: Betcherman et al. (2004, 2007); Gallart (2008);<br />
Godfrey (2007).<br />
Box <strong>2.</strong>16: Entra 21 — tackling marginalization<br />
Unemployed young people whose education has<br />
been disrupted often struggle to break into skilled<br />
jobs. The Entra 21 programme is aimed at<br />
removing barriers to entry through innovative<br />
approaches that give people <strong>the</strong> skills <strong>the</strong>y need<br />
to overcome marginalization.<br />
The programme began in 2001 through<br />
collaboration between <strong>the</strong> International Youth<br />
Foundation and <strong>the</strong> Inter-American Development<br />
Bank, in six Latin American countries: Bolivia,<br />
<strong>the</strong> Dominican Republic, El Salvador, Panama,<br />
Paraguay and Peru. Courses combine technical<br />
training, internship and job placement with life<br />
skills and job-seeking skills. Employers help with<br />
programme design and job placement. An<br />
evaluation of <strong>the</strong> first phase, which covered<br />
20,000 people, found major benefits:<br />
Among those who registered for Entra 21,<br />
69% were nei<strong>the</strong>r studying nor employed;<br />
after completion <strong>the</strong> figure was 24%.<br />
The share of graduates from <strong>the</strong> programme<br />
in formal education was 42% — double <strong>the</strong><br />
share at <strong>the</strong> time of entry to <strong>the</strong> course.<br />
Ano<strong>the</strong>r 21% were working and studying.<br />
While most of <strong>the</strong> jobs documented were<br />
in <strong>the</strong> formal sector (between 75% and 90%,<br />
depending on <strong>the</strong> country), <strong>the</strong>re were several<br />
examples of youth-led microenterprise<br />
development in <strong>the</strong> informal sector, especially<br />
in El Salvador and Peru.<br />
The second phase of <strong>the</strong> programme includes<br />
measures aimed at streng<strong>the</strong>ning <strong>the</strong> focus<br />
on marginalized youth. It targets 45,000 young<br />
people from low-income households and<br />
5,000 facing increased risk as a result of internal<br />
displacement or physical disability.<br />
Source: Lasida and Rodriguez (2006).<br />
90
PROGRESS TOWARDS THE <strong>EFA</strong> GOALS<br />
Youth and adult skills — expanding opportunities in <strong>the</strong> new global economy<br />
students can use <strong>the</strong>ir qualifications to re-enter<br />
<strong>the</strong> education system (Flores-Moreno, 2007).<br />
While such examples demonstrate what is possible,<br />
second-chance education remains a highly<br />
neglected area. Effective government coordination<br />
of <strong>the</strong> wide range of public, private and o<strong>the</strong>r<br />
non-government actors involved is rare, partly<br />
because planning for second-chance programmes<br />
is seldom integrated into mainstream education.<br />
There are o<strong>the</strong>r ways for governments to<br />
enhance skills development and combat youth<br />
unemployment. One of <strong>the</strong> most obvious is to<br />
ensure that more young people complete <strong>the</strong>ir<br />
education and achieve a qualification. In <strong>the</strong> United<br />
States, <strong>the</strong> American Recovery and Reinvestment<br />
Act includes financing provisions: youth who have<br />
not finished secondary school can re-enter<br />
education through a community college, vocational<br />
training or apprenticeship. Several states have<br />
introduced programmes led by experienced<br />
principals and teachers aimed at facilitating<br />
secondary school completion, offering<br />
comprehensive after-school and vacation<br />
teaching (CNN.com/US, 2009).<br />
Governments can also combine education and<br />
employment measures. Providing incentives for<br />
companies to offer apprenticeship and vocational<br />
programmes to unskilled young people is one<br />
option. For example, <strong>the</strong> OECD has argued that<br />
France should gear public assistance and<br />
incentives for apprenticeships <strong>towards</strong> unskilled<br />
young people and set a benchmark that increases<br />
<strong>the</strong> share of unskilled youth starting training from<br />
40% to 50% (OECD, 2009b). In <strong>the</strong> United Kingdom,<br />
which has some of <strong>the</strong> deepest skill-based<br />
inequalities in <strong>the</strong> OECD, post-crisis interventions<br />
have been generating employment and training<br />
for long-term unemployed youth (Box <strong>2.</strong>17).<br />
Programmes that deliver results<br />
How successful are technical and vocational<br />
systems in providing young people with skills,<br />
meeting company demands and tackling <strong>the</strong><br />
problems of youth unemployment, low wages<br />
and insecurity? There are no easy answers to <strong>the</strong>se<br />
questions. Vocational programmes do not operate<br />
in isolation. Macroeconomic conditions, labour<br />
market regulations and investment patterns have<br />
a major bearing on <strong>the</strong>ir effectiveness. Vocational<br />
education has <strong>the</strong> potential to make a difference<br />
in <strong>the</strong> lives of young people. Yet that potential is<br />
Box <strong>2.</strong>17: Skills and employment in <strong>the</strong> United Kingdom<br />
Even before <strong>the</strong> global downturn, job prospects for young Britons<br />
were deteriorating and school-leavers without qualifications faced<br />
severe employment disadvantages. From 2002 to 2007, <strong>the</strong> youth<br />
unemployment rate increased from 11% to 14%. With <strong>the</strong> recession,<br />
it has jumped to 17% — <strong>the</strong> highest level since 1993. Relatively<br />
unskilled youngsters leaving school with poor qualifications are<br />
bearing <strong>the</strong> brunt.<br />
Many of <strong>the</strong> weaknesses in <strong>the</strong> United Kingdom’s vocational training<br />
have deep historical roots. Apprenticeship systems have been based<br />
on voluntary provision by employers, with little government<br />
involvement. Moreover, vocational qualification systems have<br />
suffered from high levels of fragmentation and overspecialization.<br />
Reforms were introduced in 2007 aimed at closing <strong>the</strong> skills gap.<br />
Under new legislation, young people will be required to participate<br />
in education and training until <strong>the</strong>y obtain a qualification or turn 18.<br />
The qualification system is being overhauled and consolidated around<br />
seventeen new diplomas, and is set to become operational in 2015.<br />
These will be composite qualifications combining <strong>the</strong>oretical<br />
and practical learning, and including an apprenticeship element.<br />
In parallel, long-term job seekers aged 18 to 24 are being offered<br />
a range of support and training options.<br />
Responses to <strong>the</strong> financial crisis have built on this framework. Under<br />
<strong>the</strong> 2009 budget, every 18- to 24-year-old unemployed for a year<br />
or more is guaranteed an offer of training or a job, with funding<br />
made available through local authorities and voluntary organizations.<br />
Questions remain about <strong>the</strong> degree to which <strong>the</strong> training offered will<br />
equip young people for employment.<br />
Sources: Children England (2009); OECD (2008c); UK Learning and Skills Council (2008).<br />
weakened in countries relying on top-down,<br />
supply-driven models in which governments<br />
determine priorities. Moving <strong>towards</strong> a demanddriven<br />
approach that responds to <strong>the</strong> needs of<br />
individuals, companies and <strong>the</strong> economy is <strong>the</strong><br />
overriding priority for reform.<br />
Most rigorous evaluations of technical and<br />
vocational education programmes come from<br />
developed countries. Reviews that control for<br />
selection bias broadly suggest that vocational<br />
education improves employment prospects but<br />
does not necessarily lead to higher pay (Adams,<br />
2007a; Bishop and Mañe, 2005; Ryan, 2001).<br />
Evidence from Europe indicates that apprenticeship<br />
systems reduce youth unemployment and raise<br />
entry into higher-wage occupations (Gangl, 2003;<br />
Quintini et al., 2007). Traditional apprenticeship<br />
programmes are marked by strong gender bias,<br />
however. They achieve far less for women in terms<br />
of jobs, careers and wages (Adams, 2007b).<br />
Traditional<br />
apprenticeships<br />
offer far less<br />
for women in<br />
terms of jobs,<br />
careers and wages<br />
91
0<br />
1<br />
0<br />
CHAPTER 2<br />
2<br />
Education for All Global Monitoring Report<br />
There is a<br />
growing sense<br />
in which ‘what<br />
you know’ is less<br />
important than<br />
‘what you are<br />
able to learn’<br />
29. In <strong>the</strong> Republic<br />
of Korea, <strong>the</strong> share<br />
of secondary school<br />
enrolment in technical<br />
and vocational education<br />
dropped steadily from<br />
around 45% in <strong>the</strong><br />
mid-1990s to 29% in 2005.<br />
As policy-makers seek to address <strong>the</strong> twin<br />
challenges posed by rising unemployment and<br />
an increasingly knowledge-based economy,<br />
some important lessons may be drawn from<br />
<strong>the</strong> better-performing programmes – along<br />
with some cautionary notes.<br />
Reinforce <strong>the</strong> links between education and labour<br />
markets. A major strength of <strong>the</strong> dual system in<br />
Germany is <strong>the</strong> direct link it establishes between<br />
school, work experience and practical education<br />
in vocational courses. Companies train students<br />
to acquire skills relevant to <strong>the</strong> needs of <strong>the</strong><br />
enterprise and, through <strong>the</strong> involvement of<br />
government agencies, <strong>the</strong> wider economy. Using<br />
a very different approach, Japan’s system has<br />
provided students with a route into company-based<br />
training and employment. Contrasts with countries<br />
including France and <strong>the</strong> United Kingdom, where<br />
links between education and companies have been<br />
far weaker, are striking. In <strong>the</strong> United States,<br />
Career Academies operate through less formal<br />
contractual arrangements, but establish strong<br />
links between students, companies and educators,<br />
combining practical employment opportunities with<br />
teaching and job counselling. Rigorous evaluation<br />
that controls for selection bias points to strong<br />
benefits, including an average earnings increase<br />
of about 11% (Kemple and Willner, 2008).<br />
Recognize that past achievements are no<br />
guarantee of future success. Rapid economic<br />
change is continually shifting <strong>the</strong> environment<br />
for vocational education. Germany’s dual system<br />
has been coming under pressure as employment<br />
growth slows in metalworking, engineering<br />
and <strong>the</strong> automobile sector. The number of new<br />
apprenticeship places available is in decline<br />
(German Federal Ministry of Education and<br />
Research, 2006). In Japan, <strong>the</strong> ‘lost decade’ of<br />
protracted recession of <strong>the</strong> 1990s led companies<br />
to lower <strong>the</strong>ir commitments to training and<br />
long-term employment. This is reflected in <strong>the</strong><br />
large and growing share of young workers in<br />
insecure or temporary work (OECD, 2009c).<br />
The experience of Germany and Japan serves to<br />
highlight <strong>the</strong> important role of economic growth<br />
and employment creation in creating demand<br />
among employers for technical and vocational<br />
education and training. It also underlines <strong>the</strong><br />
need for state action to renew vocational<br />
programmes in <strong>the</strong> light of changing<br />
circumstances, a task heightened by <strong>the</strong><br />
current economic downturn.<br />
Rethink <strong>the</strong> outmoded separation of technical<br />
and vocational education from general education.<br />
Successful participation in knowledge-based<br />
employment markets characterized by rapid<br />
change requires problem-solving and creative<br />
thinking as well as specific technical skills. There<br />
is a growing sense in which ‘what you know’ is less<br />
important than ‘what you are able to learn’. Rigid<br />
tracking into vocational training, especially at an<br />
early age, diminishes <strong>the</strong> prospect of developing<br />
flexible skills and restricts individuals’ choices.<br />
Vocational students need sufficient academic<br />
education to broaden <strong>the</strong>ir occupational choices<br />
and general students need an opportunity to<br />
develop practical skills. Innovative reformers are<br />
breaking down barriers between vocational and<br />
general education. In <strong>the</strong> Republic of Korea,<br />
academic and vocational students in secondary<br />
school share as much as 75% of a joint curriculum,<br />
creating opportunities for transition in both<br />
directions (Adams, 2007b). The share of students<br />
enrolled in vocational education at <strong>the</strong> secondary<br />
level has been declining as <strong>the</strong> emphasis shifts<br />
to general education to equip students for postsecondary<br />
specialization. 29 Several o<strong>the</strong>r countries,<br />
including Australia and Switzerland, have actively<br />
revised qualification systems to allow for greater<br />
mobility between general and vocational education<br />
(Hoeckel et al., 2008a; Hoeckel et al., 2008b).<br />
Develop capability-based qualification systems,<br />
involving <strong>the</strong> private sector. In job markets shaped<br />
by rapid technological change, young people need<br />
expertise that can be applied to acquiring a wide<br />
range of skills. Many countries are introducing or<br />
streng<strong>the</strong>ning national qualification frameworks,<br />
testing students on <strong>the</strong> basis of broad abilities<br />
and allowing training to be used for transferrable<br />
credits into technical and general education<br />
(Adams, 2007b; Hoeckel et al., 2008b; Young, 2005).<br />
Involving companies in <strong>the</strong> development of<br />
capability-based training is important because<br />
<strong>the</strong>y are well placed to pick up employment<br />
market signals. In Australia, programmes<br />
developed through industry associations and<br />
education authorities have been introduced in <strong>the</strong><br />
final year of secondary school. At <strong>the</strong> same time,<br />
national skills bodies are bringing toge<strong>the</strong>r<br />
employers, teachers and education ministries<br />
to develop and deliver curricula that are relevant<br />
to <strong>the</strong> needs of industry. One of <strong>the</strong> big challenges<br />
is to coordinate <strong>the</strong> diverse array of partners<br />
involved into an administrative framework that<br />
avoids fragmentation and duplication.<br />
92
PROGRESS TOWARDS THE <strong>EFA</strong> GOALS<br />
Youth and adult skills — expanding opportunities in <strong>the</strong> new global economy<br />
Integrate vocational programmes into national<br />
skills strategies. Some of <strong>the</strong> most successful<br />
models demonstrate that long-term planning<br />
of skills development can play a critical role in<br />
raising productivity, generating economic growth<br />
and creating employment. The Republic of Korea<br />
and Singapore both aligned vocational programmes<br />
with <strong>the</strong> needs of high-growth sectors, identifying<br />
skills bottlenecks and, as <strong>the</strong> economy developed,<br />
gradually shifting <strong>the</strong> focus of training from<br />
secondary schools to specialized technical<br />
institutes and higher education (Law, 2008; Lee,<br />
2008). More recently, Viet Nam has invested heavily<br />
in technical and vocational education to improve<br />
skills in light manufacturing. There is scope for<br />
o<strong>the</strong>r developing regions to learn from East Asia,<br />
but <strong>the</strong> conditions for success are difficult to<br />
reproduce (Fredriksen and Tan, 2008). They include<br />
<strong>the</strong> integration of vocational education into an active<br />
policy for industrial development, rapid economic<br />
growth, strong state capacity and – critically –<br />
rapid progress in expanding good-quality primary<br />
and secondary education. Two distinctive features<br />
of <strong>the</strong> vocational success story in East Asia have<br />
been missing from <strong>the</strong> policy environment of many<br />
o<strong>the</strong>r developing countries. The first is rapid<br />
economic growth, which has created demand for<br />
skilled labour and resources for training. Second,<br />
provision of technical and vocational education<br />
in countries such as <strong>the</strong> Republic of Korea and<br />
Singapore has been integrated into broad-based<br />
national strategies for industrial development,<br />
employment creation and raising living standards<br />
through higher levels of skills and productivity<br />
(Lall, 2001) (Box <strong>2.</strong>18).<br />
Conclusion<br />
In recent decades, <strong>the</strong> rapid rise of knowledgebased<br />
economies, along with persistent youth<br />
unemployment and <strong>the</strong> marginalization of young<br />
people lacking skills, has prompted governments<br />
to review and revalue technical and vocational<br />
education. The economic crisis is ano<strong>the</strong>r driver<br />
of change. Emerging reform models are<br />
challenging <strong>the</strong> image of vocational programmes<br />
as second-class education.<br />
Governments face very different types of<br />
challenges. The problems with <strong>the</strong> dual system<br />
in Germany are not those of vocational education<br />
Box <strong>2.</strong>18: Singapore’s ‘jewel in <strong>the</strong> system’<br />
By helping drive economic growth, overcome shortages of skilled labour<br />
and reduce social inequalities, technical and vocational education has<br />
played a central role in turning Singapore into a high-income country<br />
with one of <strong>the</strong> world’s best-performing education systems. The<br />
education minister has described <strong>the</strong> Institute of Technical Education<br />
as ‘a shining jewel in our system’.<br />
The Institute of Technical Education was established in <strong>the</strong> early 1990s<br />
in response to growing concerns over <strong>the</strong> education system’s ability<br />
to meet <strong>the</strong> demands of a more productive economy and <strong>the</strong> needs of<br />
<strong>the</strong> young. It is meant for students who register low scores in general<br />
academic education. Courses are designed by government and industry.<br />
Companies value its graduates highly: over 90% of students were<br />
employed within six months of graduating in 2007. As <strong>the</strong> economy<br />
has evolved, <strong>the</strong> institute has responded with innovative programmes,<br />
including partnering with global industry to set up centres of technology<br />
in niche areas such as industrial automation, offering joint certificates<br />
with companies such as Microsoft and linking with institutes in Germany<br />
to offer diplomas in machine technology.<br />
Perhaps <strong>the</strong> institute’s greatest success has been in combating <strong>the</strong><br />
stigma associated with vocational education. Successive governments<br />
have invested heavily in training teachers, involving <strong>the</strong> private sector<br />
as well, so that <strong>the</strong> institute’s facilities are comparable to those of <strong>the</strong><br />
country’s universities. Qualifications from <strong>the</strong> institute can be used<br />
as a route into tertiary-level technical education through polytechnics,<br />
or back into academic education through universities. The emphasis<br />
on giving confidence to students and tackling <strong>the</strong> perception of technical<br />
and vocational education as a sign of failure helps explain why<br />
Singapore’s model has succeeded where o<strong>the</strong>rs have failed.<br />
Source: Goh and Gopinathan (2008).<br />
in Ethiopia. As in o<strong>the</strong>r areas of education policy,<br />
vocational education is not amenable to quick<br />
fixes through <strong>the</strong> import of successful models<br />
from o<strong>the</strong>r countries. Policies have to be tailored<br />
to reflect governments’ abilities to manage <strong>the</strong>m,<br />
<strong>the</strong> realities of labour markets and education<br />
systems, and institutional history. What is clear<br />
is that no government can afford to ignore <strong>the</strong><br />
importance of skills and learning in supporting<br />
economic growth, combating poverty and<br />
overcoming social marginalization. Goal 3 of<br />
<strong>the</strong> Dakar Framework for Action sets out a<br />
vision for <strong>the</strong> learning and skills agenda. Now<br />
governments and <strong>the</strong> international community<br />
urgently need to develop meaningful benchmarks<br />
for measuring progress and credible policies<br />
for achieving greater equity.<br />
93
0<br />
1<br />
0<br />
CHAPTER 2<br />
2<br />
Education for All Global Monitoring Report<br />
Literacy remains<br />
among <strong>the</strong> most<br />
neglected of all<br />
education <strong>goals</strong><br />
30. The target of achieving<br />
a 50% improvement in<br />
levels of adult literacy<br />
is measured by looking<br />
at <strong>the</strong> illiteracy rate,<br />
reflecting <strong>the</strong> original<br />
formulation of <strong>the</strong> goal as<br />
expressed in Jomtien in<br />
1990. The adult illiteracy<br />
rate is computed by<br />
deducting <strong>the</strong> adult<br />
literacy rate from 100.<br />
Youth and adult literacy<br />
Goal 4: Achieving a 50 per cent improvement<br />
in levels of adult literacy by 2015, especially<br />
for women, and equitable access to basic<br />
and continuing education for all adults.<br />
Youth and adult illiteracy is <strong>the</strong> price people<br />
and countries are paying for <strong>the</strong> past failures of<br />
education systems. When people emerge from <strong>the</strong>ir<br />
school years lacking basic reading, writing and<br />
numeracy skills, <strong>the</strong>y face a lifetime of disadvantage<br />
as illiteracy diminishes <strong>the</strong>ir social and economic<br />
prospects and damages self-esteem. But <strong>the</strong><br />
consequences of illiteracy extend beyond <strong>the</strong><br />
individual. When people lack literacy, society as<br />
a whole suffers from lost opportunities for higher<br />
productivity, shared prosperity and political<br />
participation (Fasih, 2008; Kinsella and He, 2009;<br />
UIS, 2008a; UNESCO, 2005). Beyond <strong>the</strong> individual<br />
and social costs, illiteracy is a violation of human<br />
rights and a global blight on <strong>the</strong> human condition<br />
(Maddox, 2008; Oxenham, 2008). Eradicating it<br />
is one of <strong>the</strong> most urgent development challenges<br />
of <strong>the</strong> twenty-first century.<br />
The international community has failed to rise<br />
to <strong>the</strong> challenge. At <strong>the</strong> World Education Forum<br />
in Dakar in 2000, governments pledged to achieve a<br />
50% improvement in levels of adult literacy by 2015.<br />
The pledge was ambitious, but <strong>the</strong> target was<br />
achievable. Unfortunately, <strong>the</strong> goal will be missed<br />
by a large margin. In a world with 759 million<br />
illiterate young people and adults, <strong>the</strong>re has been<br />
a conspicuous lack of urgency and commitment<br />
to literacy on <strong>the</strong> part of political leaders. The many<br />
exceptions to <strong>the</strong> rule serve to demonstrate that<br />
far more could have been achieved – and that far<br />
more can be done to get closer to <strong>the</strong> 2015 target.<br />
Among <strong>the</strong> key messages of this section:<br />
Literacy remains among <strong>the</strong> most neglected<br />
of all education <strong>goals</strong>. <strong>Progress</strong> <strong>towards</strong> <strong>the</strong><br />
2015 target of halving illiteracy 30 has been far<br />
too slow and uneven. With half <strong>the</strong> period for<br />
achieving <strong>the</strong> target having elapsed, <strong>the</strong> regions<br />
far<strong>the</strong>st behind have travelled between a half and<br />
two-thirds of <strong>the</strong> distance required. On current<br />
trends, <strong>the</strong>re will be 710 million illiterate adults<br />
worldwide in 2015. The evidence from monitoring<br />
is clear: unless far more is done to accelerate<br />
progress, <strong>the</strong> 2015 targets will not be reached.<br />
More rapid progress remains possible. Several<br />
countries have demonstrated through successful<br />
policies that more rapid advance <strong>towards</strong> adult<br />
literacy is possible. The National Literacy Mission<br />
in India and <strong>the</strong> Literate Brazil Programme<br />
(Programa Brasil Alfabetizado) both reflect a<br />
stronger commitment to literacy by political<br />
leaders. Several countries have developed highly<br />
innovative programmes through partnerships<br />
linking communities to governments and<br />
non-government groups. Better financing and<br />
a renewed effort to reach older adults are<br />
critical to accelerated progress.<br />
Far more has to be done to overcome <strong>the</strong> legacy<br />
of disadvantage in literacy. While gender gaps<br />
are narrowing, <strong>the</strong>y remain very large – women<br />
still account for nearly two-thirds of <strong>the</strong> world’s<br />
adult illiterates. Failure to tackle gender<br />
disparities and wider inequalities based on<br />
wealth, region, ethnicity and language are<br />
holding back progress.<br />
This section is divided into two parts. Part 1<br />
provides a global overview of literacy and a post-<br />
Dakar progress report. It also looks ahead to 2015,<br />
providing a projection of where current trends will<br />
leave <strong>the</strong> world in relation to <strong>the</strong> goal of achieving<br />
a 50% improvement in levels of adult literacy.<br />
Part 2 looks at some of <strong>the</strong> countries that are<br />
making progress and identifies approaches that<br />
are making a difference.<br />
<strong>Progress</strong> since <strong>the</strong> Dakar forum<br />
The precise meaning of ‘literacy’ continues to be<br />
subject to intense academic debate (Benavot, 2008;<br />
Fransman, 2005). Unlike <strong>the</strong> simple dichotomies<br />
used in o<strong>the</strong>r areas – such as being ‘in school’ or<br />
‘out of school’ – <strong>the</strong>re are no clear-cut dividing lines<br />
between <strong>the</strong> literate and non-literate. In any society,<br />
<strong>the</strong>re is a continuum of literacy – and people with<br />
a fragile hold on literacy in youth can lose that hold<br />
in adulthood. However, academic debates over<br />
<strong>the</strong> precise meaning of <strong>the</strong> word should not detract<br />
from common-sense depictions of what <strong>the</strong><br />
experience of illiteracy means to those affected.<br />
Half a century ago, UNESCO defined a literate<br />
person as someone ‘who can with understanding<br />
both read and write a short simple statement on<br />
his or her everyday life’ (UNESCO, 1958, p. 3).<br />
More recently, <strong>the</strong> Global Campaign for Education<br />
has extended this basic idea: ‘Literacy is about<br />
<strong>the</strong> acquisition and use of reading, writing and<br />
94
PROGRESS TOWARDS THE <strong>EFA</strong> GOALS<br />
Youth and adult literacy<br />
numeracy skills, and <strong>the</strong>reby <strong>the</strong> development of<br />
active citizenship, improved health and livelihoods<br />
and gender equality’ (Global Campaign for<br />
Education and ActionAid International, 2005, p.13).<br />
A combination of <strong>the</strong>se two broad definitions<br />
captures <strong>the</strong> reality of illiteracy as a condition<br />
that denies people opportunity.<br />
The condition affects much of <strong>the</strong> world’s youth<br />
and adult population, especially women in<br />
developing countries. While all regions are<br />
affected, a relatively small group of countries<br />
with large populations dominates <strong>the</strong> global<br />
illiteracy headcount.<br />
The illiteracy scourge continues<br />
An estimated 759 million adults – around 16%<br />
of <strong>the</strong> world’s population aged 15 and over – lack<br />
<strong>the</strong> basic reading, writing and numeracy skills<br />
needed in everyday life (Table <strong>2.</strong>6). More than half<br />
live in South and West Asia, and ano<strong>the</strong>r one-fifth<br />
in sub-Saharan Africa. Reflecting <strong>the</strong> legacy of<br />
gender disparity in education, almost two in every<br />
three adult illiterates are female (see annex,<br />
Statistical Table 2).<br />
Measured in aggregate terms, adult illiterates<br />
are heavily concentrated in a small group of largepopulation<br />
countries (Figure <strong>2.</strong>29). Just twenty<br />
countries account for around 80% of global illiterates,<br />
with Bangladesh, China, India and Pakistan making<br />
up over half <strong>the</strong> total. The data in this section<br />
highlight <strong>the</strong> concentration of illiteracy in developing<br />
countries. This should not deflect attention from<br />
<strong>the</strong> serious problems in rich countries, where large<br />
pockets of illiteracy contribute to wider patterns<br />
of social and economic marginalization (Box <strong>2.</strong>19).<br />
Aggregate figures mask differences in <strong>the</strong><br />
incidence of illiteracy. Both South and West Asia,<br />
and sub-Saharan Africa have high illiteracy rates,<br />
with more than one in three adults affected in both<br />
regions (Table <strong>2.</strong>6). In sub-Saharan Africa, twelve<br />
countries have illiteracy rates in excess of 50%;<br />
among <strong>the</strong>se, in Burkina Faso, Guinea, Mali and<br />
<strong>the</strong> Niger, more than 70% of <strong>the</strong> adult population<br />
is illiterate (Figure <strong>2.</strong>30). In <strong>the</strong> Arab States, <strong>the</strong><br />
proportion is nearly one-third. Gender disparities are<br />
a major contributor to <strong>the</strong> high adult illiteracy rates<br />
in all three regions (see annex, Statistical Table 2).<br />
For instance:<br />
Table <strong>2.</strong>6: Adult (15 and over) illiteracy rates and numbers,<br />
by region, 2000–2007 1<br />
World<br />
Illiteracy<br />
rates<br />
(%) 2 Illiterates<br />
(millions)<br />
16 759<br />
Figure <strong>2.</strong>29: Adult illiteracy is heavily concentrated<br />
in a small group of large-population countries<br />
Adult (15 and over) illiterates (millions), top ten countries<br />
Rest of <strong>the</strong> world, 218<br />
Developing countries<br />
Developed countries<br />
Countries in transition<br />
Sub-Saharan Africa<br />
Arab States<br />
Central Asia<br />
East Asia and <strong>the</strong> Pacific<br />
East Asia<br />
Pacific<br />
South and West Asia<br />
Latin America and <strong>the</strong> Caribbean<br />
Caribbean<br />
Latin America<br />
North America and Western Europe<br />
Central and Eastern Europe<br />
20 752<br />
0.7 5<br />
0.6 1<br />
38 153<br />
29 58<br />
1 0.7<br />
7 108<br />
7 106<br />
7 2<br />
36 391<br />
9 36<br />
25 3<br />
9 33<br />
0.6 4<br />
2 8<br />
Morocco, 10<br />
Indonesia, 13<br />
Brazil, 14<br />
Egypt, 17<br />
Nigeria, 23<br />
Ethiopia, 27<br />
Pakistan, 47<br />
Bangladesh, 49<br />
China, 71<br />
India, 270<br />
About 759 million<br />
adults lack <strong>the</strong><br />
basic reading,<br />
writing and<br />
numeracy skills<br />
needed in<br />
everyday life<br />
Notes: The population used to generate <strong>the</strong> number of illiterates is from <strong>the</strong> United Nations Population Division estimates (2006 revision).<br />
For countries with national observed literacy data, <strong>the</strong> population used corresponds to <strong>the</strong> year of <strong>the</strong> census or survey.<br />
1. Data are for <strong>the</strong> most recent year available during <strong>the</strong> period specified. See <strong>the</strong> web version of <strong>the</strong> introduction to <strong>the</strong> statistical tables for a broader<br />
explanation of national literacy definitions, assessment methods, and sources and years of data.<br />
<strong>2.</strong> The illiteracy rate is calculated as 100 minus <strong>the</strong> literacy rate.<br />
Source: Annex, Statistical Table <strong>2.</strong><br />
95
2<br />
0<br />
0<br />
1<br />
CHAPTER 2<br />
Box <strong>2.</strong>19: Rich countries — poor literacy<br />
Education for All Global Monitoring Report<br />
The world is far<br />
off track for <strong>the</strong><br />
2015 target of<br />
achieving a 50%<br />
improvement<br />
in levels of<br />
adult literacy<br />
This section focuses on illiteracy in poor countries,<br />
but rich countries also have significant pockets of<br />
deprivation. Many adults lack <strong>the</strong> functional literacy<br />
skills <strong>the</strong>y need to apply for jobs, read newspapers<br />
or understand documents — on housing, health<br />
and <strong>the</strong> education of children, for example —<br />
that affect <strong>the</strong>ir lives:<br />
In France, an estimated 9% of people aged 18<br />
to 65 lack <strong>the</strong> basic reading, writing, arithmetic<br />
and o<strong>the</strong>r fundamental skills required for simple<br />
everyday situations.<br />
In <strong>the</strong> Ne<strong>the</strong>rlands, 1.5 million adults (including<br />
1 million native Dutch speakers) are classified as<br />
functionally illiterate, implying that <strong>the</strong>y are not<br />
equipped to process basic information.<br />
In <strong>the</strong> United States, 14% of <strong>the</strong> population lacks<br />
<strong>the</strong> literacy skills to perform simple, everyday<br />
tasks like understanding newspaper articles and<br />
instruction manuals. Around 12% lack <strong>the</strong> literacy<br />
In Afghanistan, 87% of adult women and 57%<br />
of men were illiterate in 2000.<br />
In Chad, Ethiopia and Mali, women are around<br />
1.5 times as likely as men to be illiterate.<br />
In Algeria and Yemen, <strong>the</strong> illiteracy rates for<br />
females are more than twice those for men.<br />
Contrary to common understanding, <strong>the</strong><br />
relationship between average income and literacy<br />
is highly variable. For example, Egypt’s average<br />
income is comparable to that of Ecuador, but its<br />
literacy rate is 66% while Ecuador’s is 84%.<br />
Similarly, Algeria has a far higher level of average<br />
income than Bolivia but a lower adult literacy rate.<br />
In both cases, gender disparities explain much of<br />
<strong>the</strong> discrepancy (see annex, Statistical Table 2).<br />
The contrasting profiles for national literacy point<br />
to distinctive policy challenges. As well as making<br />
sure that young people emerge from education<br />
systems with basic literacy skills, many countries<br />
in sub-Saharan Africa, South and West Asia and<br />
parts of <strong>the</strong> Arab world need to extend literacy<br />
opportunities to a large share of <strong>the</strong> adult<br />
population. In Brazil and Indonesia, where<br />
illiteracy affects 10% or less of <strong>the</strong> adult population,<br />
policy-makers still have to address <strong>the</strong> task of<br />
reaching highly marginalized groups and people,<br />
many of <strong>the</strong>m in remote areas.<br />
skills needed to fill out a job application or<br />
understand labels on food and drugs. More than<br />
one in five — 22% of <strong>the</strong> population — has<br />
‘below basic’ quantitative skills, finding it impossible<br />
to balance a chequebook or deduce from an<br />
advertisement <strong>the</strong> amount of interest on a loan.<br />
In England (United Kingdom), 1.7 million people<br />
(5% of those aged 16 to 65) perform below <strong>the</strong><br />
level expected of 7-year-olds on <strong>the</strong> national<br />
curriculum test, and 5.1 million perform below<br />
<strong>the</strong> level expected of 11-year-olds.<br />
Literacy problems in rich countries are often<br />
concentrated in areas of acute social disadvantage,<br />
among migrant groups and <strong>the</strong> poor. Illiteracy<br />
is a factor in low pay, insecure employment<br />
and social exclusion.<br />
Sources: Burd-Sharps et al. (2008); National Agency to Fight<br />
Illiteracy (2007); National Literacy Trust (2009); Reading and<br />
Writing Foundation (2009).<br />
Measuring literacy is not an exact science. National<br />
estimates are typically derived from census and<br />
household surveys in which people are asked to<br />
report on <strong>the</strong>ir own literacy status (Box <strong>2.</strong>20).<br />
Because <strong>the</strong> idea of literacy is specific to different<br />
cultures and contexts, <strong>the</strong> word itself can have<br />
different meanings to different people (Fransman,<br />
2005; UIS, 2008a). National surveys often fail to<br />
generate representative data for populations that<br />
are hard to reach or people living in informal<br />
settlements (Aderinoye and Rogers, 2005). Given<br />
that literacy levels are likely to be lower among<br />
<strong>the</strong>se groups this can also lead to underestimation<br />
of <strong>the</strong> numbers of illiterates.<br />
The progress report<br />
The world is far off track for <strong>the</strong> 2015 target of<br />
achieving a 50% improvement in levels of adult<br />
literacy. In <strong>the</strong> absence of a concerted international<br />
drive to prioritize literacy, <strong>the</strong>re is little prospect<br />
of <strong>the</strong> target being brought within reach. Yet <strong>the</strong><br />
experience of some countries, and of some<br />
programmes within countries, demonstrates that<br />
a great deal can be achieved in relatively little time.<br />
Adult literacy rates in <strong>the</strong> developing world have<br />
been rising with every school generation. As more<br />
children enter school and leave with basic literacy<br />
skills, literacy rates inevitably rise. Literacy<br />
programmes have also played a positive role in<br />
some countries. From 1985–1994 to 2000–2007,<br />
96
PROGRESS TOWARDS THE <strong>EFA</strong> GOALS<br />
Youth and adult literacy<br />
Figure <strong>2.</strong>30: In developing countries, illiteracy can affect<br />
from one to three out of four adults<br />
Adult (15 and over) illiteracy rates in countries with rates of 25%<br />
or more in selected regions, 2000–2007 1<br />
Arab States (19)<br />
Iraq<br />
Egypt<br />
Sudan* ,2<br />
Yemen<br />
Mauritania<br />
Morocco<br />
India<br />
Nepal<br />
Pakistan*<br />
Bangladesh<br />
Bhutan*<br />
Afghanistan*<br />
Kenya*<br />
Uganda<br />
U. R. Tanzania<br />
Nigeria<br />
Malawi<br />
Madagascar*<br />
Zambia<br />
Cameroon*<br />
Angola*<br />
D. R. Congo*<br />
Ghana<br />
Rwanda*<br />
Eritrea<br />
Burundi*<br />
Liberia<br />
Togo *<br />
Côte d’Ivoire*<br />
C. A. R. *<br />
Mozambique<br />
Senegal*<br />
Benin<br />
Sierra Leone<br />
Ethiopia<br />
Chad<br />
Guinea*<br />
Burkina Faso*<br />
Niger*<br />
Mali*<br />
South and West Asia (9)<br />
Sub-Saharan Africa (41)<br />
0 10 20 30 40 50 60 70 80<br />
Adult illiteracy rates (%)<br />
Regional<br />
average<br />
29%<br />
Regional<br />
average<br />
36%<br />
Regional<br />
average<br />
38%<br />
Notes: For countries indicated with *, national observed literacy data are used.<br />
For all o<strong>the</strong>rs, UIS literacy estimates are used. The estimates were generated using<br />
<strong>the</strong> UIS Global Age-specific Literacy Projections model. Figures in paren<strong>the</strong>ses after<br />
region names indicate <strong>the</strong> number of countries with publishable data in <strong>the</strong> region.<br />
1. Data are for <strong>the</strong> most recent year available during <strong>the</strong> period specified. See <strong>the</strong><br />
web version of <strong>the</strong> introduction to <strong>the</strong> statistical tables for a broader explanation<br />
of national literacy definitions, assessment methods, and sources and years of data.<br />
<strong>2.</strong> Data do not include all geographic regions.<br />
Source: Annex, Statistical Table <strong>2.</strong><br />
<strong>the</strong> number of adult illiterates in <strong>the</strong> world fell by<br />
13%. Given that population growth pushed <strong>the</strong> adult<br />
population up by around 30% in <strong>the</strong> same period,<br />
<strong>the</strong> net effect is clearly positive. Adult literacy levels<br />
increased more rapidly than in <strong>the</strong> 1990s (Qiao,<br />
2007), growing by 10% to reach 84% in 2000-2007.<br />
Box <strong>2.</strong>20: A new generation of literacy statistics<br />
New approaches to literacy measurement are attempting<br />
to address long-standing data problems. One prominent<br />
example is <strong>the</strong> Literacy Assessment and Monitoring<br />
Programme (LAMP).<br />
Conventional approaches to literacy measurement are often<br />
fundamentally flawed. Asking people to report whe<strong>the</strong>r <strong>the</strong>y<br />
are literate is of limited use in assessing real capabilities.<br />
Similarly, testing literacy by reference to words, objects and<br />
experiences that have no relevance in <strong>the</strong> lives of <strong>the</strong> people<br />
being surveyed can understate achievement levels.<br />
The LAMP approach tests literacy in three domains:<br />
continuous texts (prose), non-continuous texts (documents)<br />
and numeracy. Results reflect a continuum of achievement,<br />
and <strong>the</strong> tests are designed to be meaningful to respondents.<br />
Data generated through <strong>the</strong> tests are intended for national<br />
and cross-national comparisons. Developed by <strong>the</strong> UIS<br />
and administered through ministries of education, LAMP<br />
surveys are in <strong>the</strong> pilot stage in several countries.<br />
Sources: UIS (2009c, 2009d).<br />
The broadly positive global canvas hides some<br />
less encouraging developments (Figure <strong>2.</strong>31).<br />
Almost all <strong>the</strong> decline in <strong>the</strong> number of illiterate<br />
adults in <strong>the</strong> developing world took place in just<br />
one region, East Asia and <strong>the</strong> Pacific. In South<br />
and West Asia, population growth cancelled<br />
out <strong>the</strong> decline in numbers of illiterate adults.<br />
In sub-Saharan Africa, <strong>the</strong> number of illiterates<br />
increased by 19.5 million. The Arab States also<br />
experienced an increase. Some countries<br />
witnessed large absolute increases in <strong>the</strong><br />
number of illiterate adults: over 1 million in<br />
Burkina Faso, <strong>the</strong> Philippines, Senegal, <strong>the</strong><br />
United Republic of Tanzania and Viet Nam,<br />
and 4 million in Bangladesh and Ethiopia<br />
(see annex, Statistical Table 2).<br />
The idea that countries are powerless to<br />
combat adult illiteracy is refuted by <strong>the</strong><br />
experience of countries that have achieved rapid<br />
progress. The following are examples of positive<br />
change between 1985–1994 and 2000–2007:<br />
Much of <strong>the</strong> illiteracy reduction in East Asia<br />
can be traced to China. The number of<br />
adult illiterates <strong>the</strong>re fell by 114 million<br />
or 62% between <strong>the</strong> two periods, with an<br />
average increase in <strong>the</strong> number of adult<br />
literates of 4 million between 1990 and 2000<br />
(NCEDR, 2008).<br />
Adult literacy<br />
levels grew by<br />
10% to reach 84%<br />
in 2000-2007<br />
97
0<br />
0<br />
1<br />
CHAPTER 2<br />
2<br />
Education for All Global Monitoring Report<br />
Burkina Faso<br />
and Chad have<br />
respectively<br />
doubled<br />
and almost<br />
tripled <strong>the</strong>ir<br />
literacy rates<br />
Figure <strong>2.</strong>31: The number of adult illiterates is falling despite population growth<br />
Changes in adult (15 and over) illiterates, literacy rates and population, by region, 1985–1994 and 2000–2007 1<br />
-70<br />
World<br />
Developing countries<br />
Developed countries<br />
Countries in transition<br />
Sub-Saharan Africa<br />
Arab States<br />
Central Asia<br />
East Asia and <strong>the</strong> Pacific<br />
South and West Asia<br />
Latin America and <strong>the</strong> Caribbean<br />
North America and Western Europe<br />
Central and Eastern Europe<br />
-60 -50 -40 -30 -20 -10 0 10 20 30 40 50 60 70<br />
Per cent change, 1985-1994 and 2000-2007<br />
Adult illiterates<br />
Adult population<br />
Literacy rates<br />
Notes: The population used to generate <strong>the</strong> number of illiterates is from <strong>the</strong> United Nations Population Division estimates (2006 revision). For countries with national<br />
observed literacy data, <strong>the</strong> population used corresponds to <strong>the</strong> year of <strong>the</strong> census or survey. For countries with UIS estimates, <strong>the</strong> populations used are for 1994 and 2007.<br />
1. Data are for <strong>the</strong> most recent year available during each period specified.<br />
Source: Annex, Statistical Table <strong>2.</strong><br />
31 The gender parity index<br />
(GPI) declined in Ecuador,<br />
Ethiopia and Zambia.<br />
In Botswana, <strong>the</strong> GPI<br />
improved from 1.09 to<br />
1.00. Gender parity had<br />
already been achieved in<br />
1985-1994 in <strong>the</strong> Maldives,<br />
Panama, Seychelles<br />
and Uruguay, and was<br />
maintained in 2000–2007<br />
(Annex, Statistical<br />
Table 2).<br />
With <strong>the</strong> world’s largest illiterate population,<br />
India has been making progress. In 1985–1994<br />
not quite half of adults were literate. The figure<br />
is now slightly above two-thirds. Since <strong>the</strong> adult<br />
population increased by 45%, this marks a real<br />
advance. It also suggests that <strong>the</strong> country’s<br />
Total Literacy Campaign, under <strong>the</strong> Auspices<br />
of <strong>the</strong> National Literacy Mission, may be having<br />
an impact (India Ministry of Human Resource<br />
Development and National University of<br />
Educational Planning and Administration, 2008).<br />
Many countries in sub-Saharan Africa have<br />
achieved steep rises in adult literacy rates.<br />
Burkina Faso and Chad, with some of <strong>the</strong><br />
world’s lowest literacy rates, have respectively<br />
doubled and almost tripled <strong>the</strong>ir rates.<br />
Several Arab states have achieved major<br />
advances. Egypt’s adult literacy rate has<br />
increased from 44% to 66%. Yemen has<br />
increased <strong>the</strong> adult literacy rate from<br />
37% to 59%.<br />
Gender parity is improving<br />
Rising literacy has been accompanied by<br />
declining gender disparities. Many countries<br />
that started with very large gaps between male<br />
and female literacy, and from low overall levels,<br />
have been on a pathway <strong>towards</strong> parity.<br />
Gender parity improved in all but eight of <strong>the</strong><br />
seventy-nine countries with data. 31 In Bangladesh,<br />
Burkina Faso, Burundi, Malawi, Nepal and<br />
Yemen, female adult literacy rates doubled or<br />
98
PROGRESS TOWARDS THE <strong>EFA</strong> GOALS<br />
Youth and adult literacy<br />
tripled, and have increased twice as fast as<br />
male rates. Because adult literacy gaps track<br />
developments in basic education, this catching<br />
up process mirrors a narrowing of <strong>the</strong> gender gap<br />
in basic education. Between <strong>the</strong> two benchmark<br />
periods, <strong>the</strong> number of adult female literates<br />
increased by 14%, compared with 7% for adult<br />
males (see annex, Statistical Table 2).<br />
This positive trend has to be placed in context.<br />
Women may be catching up, but in many countries<br />
<strong>the</strong>y are starting from a long way back. Gender<br />
disparities remain very deep – and <strong>the</strong> share of<br />
women in <strong>the</strong> total number of illiterates has<br />
increased slightly. The process of convergence is<br />
thus starting from very unequal points (Figure <strong>2.</strong>32).<br />
In <strong>the</strong> three regions with <strong>the</strong> lowest levels of literacy<br />
and largest gender disparities – <strong>the</strong> Arab states,<br />
South and West Asia, and sub-Saharan Africa –<br />
female adult literacy rates for 2000–2007 were still<br />
below <strong>the</strong> average for male literacy in 1985–1994.<br />
On <strong>the</strong> current trajectory, it will take women in<br />
South and West Asia about fifty-six years to catch up.<br />
Gender convergence in adult literacy is proceeding<br />
at different rates in different countries. Compare <strong>the</strong><br />
contrasting experiences of Bangladesh and India.<br />
Women aged 25 to 34 in Bangladesh have illiteracy<br />
rates 32% higher than men in <strong>the</strong> same age group.<br />
The gap reflects gender disparities that prevailed in<br />
<strong>the</strong> education system when that generation went to<br />
school. For 15- to 24-year-olds in Bangladesh today<br />
<strong>the</strong> gender gap has been eliminated. While India has<br />
been narrowing <strong>the</strong> gap, 15- to 24-year-old females<br />
are still about twice as likely to be illiterate as<br />
males in that group. Among <strong>the</strong> Arab states,<br />
Morocco has been making rapid progress <strong>towards</strong><br />
improved literacy with every school generation but<br />
has been less successful in closing <strong>the</strong> gender gap,<br />
as comparison with China underlines (Figure <strong>2.</strong>33).<br />
Improvement in access to education across<br />
generations is one of <strong>the</strong> motors driving increased<br />
literacy levels. In almost all countries, literacy rates<br />
among younger adults (15 to 24) are higher than<br />
<strong>the</strong> average for all adults (15 and over). In <strong>the</strong> Arab<br />
States, South and West Asia, and sub-Saharan<br />
Africa, youth literacy rates in 2000–2007 were<br />
16% to 24% higher than <strong>the</strong> average for all adults<br />
(see annex, Statistical Table 2). Age-group<br />
disparities are particularly marked in some<br />
countries, including Botswana, Eritrea, <strong>the</strong> Islamic<br />
Republic of Iran, Nigeria and Sri Lanka, where <strong>the</strong><br />
proportion of illiterates among all adults is double<br />
or more <strong>the</strong> proportion for younger adults.<br />
Figure <strong>2.</strong>32: Being so far behind, women have fur<strong>the</strong>r to travel to reach male literacy rates<br />
Adult (15 and over) literacy rates, by region and gender, 1985–1994 and 2000–2007 1<br />
World<br />
Developing countries<br />
Developed countries<br />
Countries in transition<br />
Sub-Saharan Africa<br />
Arab States<br />
Central Asia<br />
East Asia and <strong>the</strong> Pacific<br />
South and West Asia<br />
Latin America/Caribbean<br />
Central/Eastern Europe<br />
N. America/W. Europe<br />
30 40 50 60 70 80 90 100<br />
Adult literacy rates (%)<br />
Female 1985-1994 Female 2000-2007<br />
Male 1985-1994 Male 2000-2007<br />
1. Data are for <strong>the</strong> most recent year available during each period specified.<br />
Source: Annex, Statistical Table <strong>2.</strong><br />
Illiteracy mirrors wider disadvantages<br />
National data on literacy can provide insights into<br />
<strong>the</strong> average picture for a country while obscuring<br />
disparities within countries, where adult illiteracy<br />
may intersect with income, parental education,<br />
ethnicity, language and disability. While women<br />
are systematically disadvantaged, gender<br />
disparities are magnified by wider structures<br />
of disadvantage and marginalization.<br />
Low income. Adults from <strong>the</strong> poorest<br />
households are far more likely to be illiterate.<br />
In Guatemala, 60% of adults living in extreme<br />
poverty and 42% of those living in non-extreme<br />
poverty are illiterate, compared with 17% of richer<br />
adults (Porta Pallais and Laguna, 2007). Similarly,<br />
<strong>the</strong> literacy rate for <strong>the</strong> richest Bangladeshi<br />
households is 76%, compared with 28% for<br />
<strong>the</strong> poorest (Bangladesh Ministry of Planning<br />
and UNESCO Bangladesh, 2008).<br />
Ethnicity, language and group-based<br />
disadvantage. Minority language groups and<br />
indigenous people often register far lower levels<br />
of literacy. In Viet Nam, <strong>the</strong> literacy rate is 94%<br />
among <strong>the</strong> majority Kinh population, but only 72%<br />
for ethnic minorities (Daswani, 2005). In Peru,<br />
illiteracy is much more prevalent among<br />
On <strong>the</strong> current<br />
trajectory, it will<br />
take women in<br />
South and West<br />
Asia about fifty-six<br />
years to catch<br />
up with men<br />
99
0<br />
0<br />
1<br />
CHAPTER 2<br />
2<br />
Education for All Global Monitoring Report<br />
On current<br />
trends,<br />
710 million adults<br />
will still lack<br />
basic literacy<br />
skills in 2015.<br />
3<strong>2.</strong> See note for<br />
Figure <strong>2.</strong>35 for how<br />
<strong>the</strong> literacy target has<br />
been measured.<br />
Figure <strong>2.</strong>33: Contrasting experiences in reducing illiteracy<br />
and <strong>the</strong> associated gender gap in four countries<br />
Age illiteracy profile in selected countries, by age group and gender, 2007<br />
Illiteracy rates (%)<br />
Illiteracy rates (%)<br />
100<br />
80<br />
60<br />
40<br />
20<br />
0<br />
100<br />
80<br />
60<br />
40<br />
20<br />
0<br />
75-84 65-74 55-64 45-54 35-44 25-34 15-24<br />
Age groups<br />
Bangladesh, male<br />
Bangladesh, female<br />
India, female<br />
India, male<br />
China, female<br />
China, male<br />
75-84 65-74 55-64 45-54 35-44 25-34 15-24<br />
Source: UIS database.<br />
Age groups<br />
Morocco, female<br />
Morocco, male<br />
indigenous-language speakers at 21% of adults<br />
compared with 4% for Spanish-speakers (Cueto<br />
et al., 2009). In South Asia, literacy gaps between<br />
lower and higher castes are pronounced. In Nepal,<br />
caste disparities are even larger than wealth<br />
and gender disparities (Nepal Ministry of Education<br />
and Sports and UNESCO Kathmandu, 2007).<br />
Disparities linked to location. Illiteracy tends to<br />
be higher in poorer regions, rural areas and slums.<br />
Regional disparities often mirror national poverty<br />
maps. For example, in Brazil some of <strong>the</strong> poorest<br />
states in <strong>the</strong> north-east – Alagoas, Maranhão,<br />
Paraíba and Piauí – have illiteracy levels twice as<br />
high as in <strong>the</strong> south-east (The George Washington<br />
University, 2006). In India, <strong>the</strong> regional spectrum<br />
extends from almost no illiteracy in <strong>the</strong> state<br />
of Mizoram to 50% illiteracy in Rajasthan (India<br />
Ministry of Human Resource Development and<br />
National University of Educational Planning and<br />
Administration, 2008). Rural areas often lag far<br />
behind urban areas (Kinsella and He, 2009).<br />
In Pakistan, urban literacy rates are twice as high<br />
as <strong>the</strong> rural average. Within urban areas illiteracy<br />
tends to be concentrated in informal settlements<br />
characterized by high levels of poverty (Pakistan<br />
Ministry of Education, 2008).<br />
None of <strong>the</strong>se disadvantages exists in isolation.<br />
Being female is a near-universal indicator for lower<br />
average literacy in many Arab states and most of<br />
South and West Asia, and sub-Saharan Africa. But<br />
gender disadvantage is compounded by poverty,<br />
location and ethnicity (Figure <strong>2.</strong>34). The wealth gap<br />
in <strong>the</strong> Philippines is particularly marked: women in<br />
<strong>the</strong> poorest households have literacy rates averaging<br />
65%, compared with over 96% for women in <strong>the</strong><br />
wealthiest households. In South Africa, white youth<br />
and adult women have near-universal literacy levels,<br />
compared with just 70% literacy among black<br />
women. In Mexico, women who only speak an<br />
indigenous language are about fifteen times less<br />
likely to be literate than women who only speak<br />
Spanish, and women lacking a knowledge of<br />
Spanish have literacy levels of just 5%. Literacy<br />
rates among Cambodian women living in Ratanakiri,<br />
a province dominated by indigenous hill tribes, are<br />
just over a third of those among women in <strong>the</strong><br />
capital, Phnom Penh.<br />
Prospects for achieving <strong>the</strong> 2015 target<br />
Current trends in adult literacy will leave <strong>the</strong> world<br />
short of <strong>the</strong> target set for 2015. 32 <strong>Progress</strong> has been<br />
so slow that <strong>the</strong> target is out of reach. Even in a<br />
best-case scenario, not enough children will enter<br />
adulthood literate over <strong>the</strong> next five years to halve<br />
<strong>the</strong> level of illiteracy. Continuing on <strong>the</strong> current trend<br />
will leave a very large gap with <strong>the</strong> Dakar promise.<br />
Projections provided for <strong>the</strong> <strong>EFA</strong> Global Monitoring<br />
Report 2010 give a ballpark estimate of <strong>the</strong> scale<br />
of shortfall: by 2015 <strong>the</strong> adult illiteracy rate will have<br />
fallen between 29% and 34% in <strong>the</strong> three regions<br />
with <strong>the</strong> highest rates. In o<strong>the</strong>r words, between half<br />
and two-thirds of <strong>the</strong> journey to <strong>the</strong> 50% illiteracy<br />
reduction target will have been completed.<br />
There is a very real human cost associated with<br />
<strong>the</strong> gap. On <strong>the</strong> current course, an estimated<br />
710 million adults – 13% of <strong>the</strong> world’s adults – will<br />
still lack basic literacy skills in 2015. Regional gaps<br />
between target and projected outcome are largest<br />
for South and West Asia, sub-Saharan Africa and<br />
<strong>the</strong> Arab States (Figure <strong>2.</strong>35). Failure to achieve <strong>the</strong><br />
Dakar adult literacy goal will translate into very<br />
large deficits for many countries. In India <strong>the</strong> target<br />
will be missed on current trends by around 81 million<br />
100
PROGRESS TOWARDS THE <strong>EFA</strong> GOALS<br />
Youth and adult literacy<br />
Figure <strong>2.</strong>34: Within countries, women’s literacy rates are influenced by socio-economic and geographic factors<br />
Female adult (18 and over) literacy rates, by area, ethnicity, income, language, religion or region, selected countries, latest available year<br />
100<br />
90<br />
80<br />
70<br />
Average<br />
Poorest<br />
Richest<br />
Urban<br />
Rural<br />
Addis Abeba<br />
region<br />
Kerala region<br />
Spanish language<br />
Ladino ethnicity<br />
Metropolitan/<br />
Central region<br />
Phnom Penh<br />
region<br />
Distrito Federal<br />
Spanish<br />
language only<br />
White ethnicity<br />
W. Cape region<br />
Black ethnicity<br />
Capital region<br />
Christian<br />
Ucayali region<br />
Castellano ethnicity<br />
Quechua ethnicity<br />
Female literacy rates (%)<br />
60<br />
50<br />
40<br />
Ouagadougou<br />
region<br />
Indian ethnicity<br />
North-Occidental<br />
region<br />
Oaxaca region<br />
Limpopo region<br />
ARMM*<br />
Muslim<br />
Cusco region<br />
30<br />
Rajasthan region<br />
O<strong>the</strong>r language<br />
Mondol Kiri/<br />
Rattanak Kiri region<br />
20<br />
Sénoufo ethnicity<br />
10<br />
0<br />
East region<br />
Fulfulde/<br />
Peul ethnicity<br />
Somali region<br />
Indigenous<br />
language only<br />
Burkina Faso Ethiopia India Guatemala Cambodia Mexico South Africa Philippines Peru<br />
Notes: Data for Burkina Faso (2003), Cambodia (2005), Ethiopia (2005), Guatemala (1999), India (2005) and Peru (2004) are from Demographic and Health Surveys.<br />
Data for Mexico (2005), <strong>the</strong> Philippines (2000) and South Africa (2001) are from population censuses. Countries are sorted by average female literacy rate.<br />
* Autonomous Region in Muslim Mindanao.<br />
Source: UNESCO-DME (2009).<br />
people. Bangladesh will have 16 million more illiterates<br />
than it would if <strong>the</strong> 2015 <strong>goals</strong> were achieved. 33<br />
Among <strong>the</strong> sub-Saharan African countries,<br />
Mozambique will face a deficit of <strong>2.</strong>6 million people,<br />
based on a target set using 1997 data (UIS, 2009d).<br />
Changing <strong>the</strong> trend —<br />
making <strong>the</strong> literacy decade count<br />
The disappointing progress <strong>towards</strong> <strong>the</strong> literacy goal<br />
set at Dakar reflects a collective failure of political<br />
commitment. While <strong>the</strong>re are many exceptions,<br />
governments and aid donors collectively have failed<br />
to attach sufficient weight to <strong>the</strong> eradication of<br />
illiteracy. There are encouraging signs, however,<br />
that this could be starting to change.<br />
Some are apparent at <strong>the</strong> international level. In 2003,<br />
<strong>the</strong> United Nations launched a literacy decade, with<br />
33. The Bangladesh and India targets are set using 2001 literacy data<br />
from <strong>the</strong> UIS database.<br />
Figure <strong>2.</strong>35: At <strong>the</strong> present rate, regions fur<strong>the</strong>st behind<br />
will miss <strong>the</strong> literacy target for 2015<br />
Adult (15 and over) illiteracy rates, by region: 2007, projected by 2015<br />
and required by 2015 to achieve <strong>the</strong> goal<br />
East Asia/Pacific<br />
Latin America/Caribbean<br />
Arab States<br />
Sub-Saharan Africa<br />
South/West Asia<br />
0 10 20 30 40<br />
Adult illiteracy rates (%)<br />
2007<br />
Projected 2015<br />
Goal by 2015<br />
Notes: The goal of achieving a 50% improvement in levels of adult literacy is measured<br />
by looking at <strong>the</strong> 1999 illiteracy rate, reflecting <strong>the</strong> original formulation of <strong>the</strong> goal as<br />
expressed in Jomtien in 1991. The adult illiteracy rate is computed by deducting <strong>the</strong><br />
adult literacy rate from 100. Regions are sorted by illiteracy rate goal by 2015.<br />
Sources: Annex, Statistical Table 2; UIS (2009b).<br />
101
0<br />
1<br />
2<br />
0<br />
CHAPTER 2<br />
Education for All Global Monitoring Report<br />
Large-scale<br />
programmes<br />
in Brazil, India<br />
and <strong>the</strong> Islamic<br />
Republic of Iran<br />
are delivering<br />
positive results<br />
governments recognizing that ‘literacy is crucial<br />
to <strong>the</strong> acquisition, by every child, youth and adult,<br />
of essential life skills that enable <strong>the</strong>m to address<br />
<strong>the</strong> challenges <strong>the</strong>y can face in life, and represents<br />
an essential step in basic education’ (United<br />
Nations, 2002, p. 2). While development decades<br />
come and go, usually without meaningful impact,<br />
<strong>the</strong> literacy decade has given rise to intensive<br />
regional discussions and raised <strong>the</strong> profile of <strong>the</strong><br />
illiteracy problem (Robinson, 2009; UNESCO,<br />
2008b). The International Conference on Adult<br />
Education scheduled for late 2009 (CONFINTEA VI)<br />
provides an opportunity to move from international<br />
dialogue to international action.<br />
Literacy continues to receive insufficient attention<br />
at many levels. It is not treated as a political<br />
priority, it receives insufficient financial<br />
commitment and efforts to incorporate strategies<br />
for literacy into wider poverty reduction plans<br />
remain underdeveloped (Caillods and Hallak, 2004;<br />
Giffard-Lindsay, 2008; Lindt, 2008). Even so, some<br />
governments have demonstrated through practical<br />
action that national programmes deliver results.<br />
O<strong>the</strong>rs have increased financing commitments<br />
for literacy. And a vast array of partnerships and<br />
approaches are now promoting literacy at <strong>the</strong><br />
community level (Oxenham, 2008).<br />
Some governments have openly acknowledged<br />
that neglect of literacy was a serious policy failure<br />
(Lindt, 2008). One of <strong>the</strong> most far-reaching efforts<br />
to correct that failure is <strong>the</strong> Literate Brazil<br />
Programme (Box <strong>2.</strong>21). In <strong>the</strong> Islamic Republic<br />
of Iran, community learning centres initiated by<br />
<strong>the</strong> Literacy Movement Organization, a government<br />
agency, have enrolled 3.1 million illiterates from<br />
2000 to 2006 in preliminary basic education<br />
courses. Around three-quarters of those enrolled<br />
successfully complete <strong>the</strong>ir courses (Richmond<br />
et al., 2008). In Burkina Faso, <strong>the</strong> government has<br />
adopted <strong>the</strong> bold target of increasing adult literacy<br />
rates from 28% to 40% by 2010. That target has<br />
been backed by an increase in <strong>the</strong> share of <strong>the</strong><br />
education budget allocated to literacy from 1% to<br />
7% – a move that has facilitated <strong>the</strong> expansion of<br />
permanent literacy training centres and centres<br />
for non-formal basic education. Graduation from<br />
<strong>the</strong>se centres grew by 24% from 2003 to 2007<br />
(Richmond et al., 2008).<br />
Ano<strong>the</strong>r example comes from India, where <strong>the</strong><br />
National Literacy Mission, launched in 1988, has<br />
been revitalized. The eleventh five-year plan, which<br />
ends in 2012, has quintupled <strong>the</strong> mission’s budget<br />
to <strong>the</strong> equivalent of US$21 billion. Programmes<br />
have been redesigned to provide an integrated<br />
approach that combines initial literacy training<br />
with ongoing post-literacy courses.<br />
Decentralization is transferring authority to states<br />
and districts, and a much stronger commitment<br />
has been made to preparing literacy materials in<br />
local languages. In 2009, <strong>the</strong> Government of India<br />
also signaled a stronger focus on gender and<br />
equity, first by recasting <strong>the</strong> National Literacy<br />
Mission as <strong>the</strong> National Female Literacy Mission<br />
and <strong>the</strong>n by announcing a strategy for targeting.<br />
Commitments have been made to ensure that<br />
85% of targeted beneficiaries will be women and<br />
that 50% will come from scheduled castes, tribes<br />
and minorities, with a focus on Muslims (India<br />
Ministry of Human Resource Development, 2009).<br />
Slow progress in improving literacy is sometimes<br />
cited as evidence that little can be done for older<br />
generations. There is extensive evidence, however,<br />
of problems with past approaches to raising<br />
literacy. For two or three decades after 1960,<br />
many governments attempted to combat illiteracy<br />
through top-down courses that were ill suited<br />
to <strong>the</strong> lives of <strong>the</strong> intended beneficiaries, badly<br />
designed and offered no follow-up. Dropout rates<br />
were high and literacy acquisition limited. The<br />
needs of indigenous people and minority language<br />
groups were often ignored. Literacy programmes<br />
have mirrored schools in denying people an<br />
opportunity to learn in <strong>the</strong>ir local language,<br />
diminishing <strong>the</strong> perceived value of <strong>the</strong>ir culture<br />
in <strong>the</strong> process.<br />
Shortcomings persist in national programmes,<br />
particularly in targeting. Literacy initiatives often<br />
focus on youth and young adults, with insufficient<br />
attention paid to older people – especially<br />
women – who represent <strong>the</strong> bulk of <strong>the</strong> illiterate<br />
population. India’s and Brazil’s programmes<br />
principally target people under 30 (India Ministry<br />
of Human Resource Development and National<br />
University of Educational Planning and<br />
Administration, 2008). Reaching older illiterates<br />
can be difficult, but far more could be done to<br />
extend opportunities through livelihood-based<br />
literacy programmes.<br />
Financing is ano<strong>the</strong>r area of concern. It is<br />
encouraging that more governments are adopting<br />
bold targets, but those targets are seldom backed<br />
by adequate budget support. It is not uncommon<br />
for literacy to account for as little as 1% to<br />
2% of total education spending (Lindt, 2008).<br />
102
PROGRESS TOWARDS THE <strong>EFA</strong> GOALS<br />
Youth and adult literacy<br />
Box <strong>2.</strong>21: Brazil — ‘making people literate’<br />
Around 14 million Brazilian youth, adults and elderly<br />
people lack basic reading and writing skills. The<br />
Literate Brazil Programme (Programa Brasil<br />
Alfabetizado) initiated by President Luiz Inácio Lula<br />
da Silva in 2003 is <strong>the</strong> first concerted national effort<br />
to consign illiteracy to <strong>the</strong> history books.<br />
The programme is coordinated by <strong>the</strong> Ministry of<br />
Education but operates through a highly decentralized<br />
structure. It functions in 3,699 municipalities, just<br />
over 1,000 of which have been accorded priority<br />
status because <strong>the</strong>y have illiteracy rates over 25%.<br />
The effort primarily targets disadvantaged groups<br />
such as indigenous people, small farmers and farm<br />
workers, child labourers (as part of <strong>the</strong> Programme<br />
to Eradicate Child Labour) and people covered under<br />
<strong>the</strong> Bolsa Familia social protection programme.<br />
Literate Brazil is open to anyone over 15 with less than<br />
a year of education. Thus far it has provided literacy<br />
training to about 8 million learners. Literacy classes<br />
typically last six to eight months and are attended<br />
by groups of eighteen to twenty-five learners. Federal<br />
transfers cover <strong>the</strong> cost of training and providing<br />
grants to literacy facilitators, many of whom are<br />
teachers. Literacy textbooks are produced in local<br />
languages and reflect local circumstances and needs.<br />
Innovative pedagogical approaches have been<br />
developed. Teaching is organized around <strong>the</strong> idea<br />
of ‘making people literate’ through dynamic learning<br />
processes that lead to <strong>the</strong> acquisition of reading,<br />
writing and numeracy skills. Students’ abilities are<br />
assessed and recorded by government agencies,<br />
and qualifications are provided that can be used<br />
to enter formal education.<br />
Literate Brazil has been about more than providing<br />
services. Political leaders have challenged <strong>the</strong> culture<br />
of silence and indifference surrounding illiteracy.<br />
A Ministry of Education programme has put <strong>the</strong><br />
development of textbooks for literacy, a previously<br />
neglected subject, on <strong>the</strong> same footing as books for<br />
primary and secondary school. Prizes are awarded<br />
for <strong>the</strong> development of literacy materials and <strong>the</strong> best<br />
entries are integrated into national programmes, with<br />
specific prizes for black Brazilians, an educationally<br />
disadvantaged group.<br />
Sources: Brazil Ministry of Education (2008);<br />
Henriques and Ireland (2007); Ireland (2007, 2008);<br />
UIL (2009); UNESCO Brasilia (2009).<br />
Many literacy programmes also continue to suffer<br />
from low rates of uptake and completion.<br />
On <strong>the</strong> o<strong>the</strong>r hand, programmes that provide for<br />
active learning through a relevant curriculum and<br />
offer follow-up have achieved results. Many such<br />
programmes are built on partnerships, extending<br />
from local communities to non-government actors<br />
and government agencies. One prominent<br />
example is Reflect. Developed and coordinated<br />
by ActionAid, an international charity, it focuses<br />
on <strong>the</strong> learners’ own literacy objectives, motivation<br />
and skills (Riddell, 2001). It not only promotes <strong>the</strong><br />
use of real texts from <strong>the</strong> environment but also<br />
encourages participants to generate <strong>the</strong>ir own<br />
texts. It fur<strong>the</strong>r aims to transform <strong>the</strong> broader<br />
literacy environment, for example by campaigning<br />
for newspapers to use local language or texts more<br />
accessible to adult literacy learners (Aderinoye<br />
and Rogers, 2005). The programme is currently<br />
applied in Bangladesh, Pakistan and many o<strong>the</strong>r<br />
countries (Duffy et al., 2008).<br />
Bilingual education is critical to <strong>the</strong> success of<br />
literacy programmes aimed at indigenous people<br />
and ethnic minorities. Here, too, many governments<br />
have openly acknowledged <strong>the</strong> mistakes of <strong>the</strong> past.<br />
Several governments in Latin America – including<br />
those of Chile, Guatemala, Mexico, Paraguay and<br />
Peru – and <strong>the</strong> UN Economic Commission for Latin<br />
America and <strong>the</strong> Caribbean have developed a<br />
regional poverty reduction strategy incorporating<br />
bilingual literacy training for indigenous groups<br />
(Latin American and <strong>the</strong> Caribbean Demographic<br />
Center, 2009; Stockholm Challenge, 2008).<br />
Conclusion<br />
Much has been achieved through <strong>the</strong> scaling up<br />
of literacy initiatives since 2000. However, <strong>the</strong><br />
monitoring evidence is unambiguous: <strong>the</strong> 2015<br />
targets will not be reached on <strong>the</strong> current<br />
trajectory. Far more has to be done to accelerate<br />
progress. This will require stronger political<br />
leadership. Governments across <strong>the</strong> world continue<br />
to attach too little weight to literacy in national<br />
planning. This is short-sighted. Illiteracy imposes<br />
huge costs on society and <strong>the</strong> economy – and<br />
investments in literacy have <strong>the</strong> potential to<br />
generate large returns in both areas.<br />
The Literate Brazil<br />
Programme has<br />
provided literacy<br />
training to about<br />
8 million learners<br />
103
0<br />
1<br />
2<br />
0<br />
CHAPTER 2<br />
Education for All Global Monitoring Report<br />
The core purpose<br />
of education is to<br />
ensure that<br />
children acquire<br />
<strong>the</strong> skills that<br />
shape <strong>the</strong>ir<br />
future life<br />
chances<br />
The quality of education<br />
Goal 6: Improving all aspects of <strong>the</strong> quality of<br />
education and ensuring excellence of all so that<br />
recognized and measurable learning outcomes<br />
are achieved by all, especially in literacy,<br />
numeracy and essential life skills.<br />
The core task of any education system is to<br />
equip young people with <strong>the</strong> skills <strong>the</strong>y need to<br />
participate in social, economic and political life.<br />
Getting children into primary school, through <strong>the</strong>ir<br />
early grades and into secondary school is not an<br />
end in itself but a means of delivering <strong>the</strong>se skills.<br />
Success or failure in achieving education for all<br />
hinges critically not just on countries delivering<br />
more years in school; <strong>the</strong> ultimate measure lies<br />
in what children learn and <strong>the</strong> quality of <strong>the</strong>ir<br />
education experience.<br />
Many countries are failing <strong>the</strong> quality test. Outof-school<br />
children face obvious disadvantages,<br />
yet less attention has been paid to <strong>the</strong> fact that<br />
millions of children emerge from primary school<br />
each year without having acquired basic literacy<br />
and numeracy skills. Unable to formulate or read<br />
a simple sentence, <strong>the</strong>se children are ill equipped<br />
to make <strong>the</strong> transition to secondary school – let<br />
alone enter employment markets. The problems<br />
extend to secondary schools, where many children<br />
– sometimes a majority – do not reach even a<br />
minimal level of competence.<br />
Policy-makers, educators and parents need to<br />
focus far more on <strong>the</strong> core purpose of education:<br />
ensuring that children acquire <strong>the</strong> skills that<br />
shape <strong>the</strong>ir future life chances. That goal is<br />
difficult to achieve – far more difficult, arguably,<br />
than getting children into school. Governments<br />
need to revise approaches to teaching, learning<br />
and curriculum development. With <strong>the</strong> global<br />
financial crisis having tightened already severe<br />
budget constraints, cost is often a barrier, but<br />
learning achievement can be greatly improved<br />
at low cost, in some cases by making better use<br />
of resources already being invested in education.<br />
Public concern over <strong>the</strong> quality of education<br />
is evident in many of <strong>the</strong> world’s richest nations,<br />
as well as <strong>the</strong> poorest. This section focuses on<br />
<strong>the</strong> situation in developing countries. There are<br />
three key messages:<br />
While global gaps in access to school may be<br />
narrowing, gaps in school quality remain<br />
enormous. Evidence from learning achievement<br />
tests suggests that, in many developing countries,<br />
average students are performing close to or below<br />
minimum competency levels. Global disparities<br />
are reinforced by inequalities within countries. The<br />
problem is not just one of relative performance;<br />
absolute levels of learning achievement are<br />
exceptionally low in many countries.<br />
Getting <strong>the</strong> basics right is important – and many<br />
countries are failing to build strong foundations.<br />
Children in <strong>the</strong> early grades are not mastering<br />
<strong>the</strong> reading skills necessary for fur<strong>the</strong>r learning.<br />
Without <strong>the</strong>se foundations, returns on <strong>the</strong> huge<br />
investment that governments and households<br />
make in education will be sub-optimal. Reading<br />
skills can be improved relatively easily. Education<br />
ministries and teachers need to renew <strong>the</strong>ir<br />
efforts regarding <strong>the</strong>se basic skills.<br />
Children do not start <strong>the</strong>ir schooling on an<br />
equal footing: more must be done to equalize<br />
opportunity. Circumstances beyond children’s<br />
control, such as <strong>the</strong> income and education of<br />
<strong>the</strong>ir parents, <strong>the</strong> language <strong>the</strong>y speak and where<br />
<strong>the</strong>y live, influence <strong>the</strong>ir achievement at school.<br />
If <strong>the</strong> quality goal is to be achieved, ensuring that<br />
all learners, regardless of background, achieve<br />
basic levels of learning needs to become<br />
a central objective. Programmes to improve<br />
achievement for <strong>the</strong> most disadvantaged<br />
learners are necessary.<br />
The section is divided into three parts. Part 1<br />
highlights <strong>the</strong> large disparities in learning<br />
achievement among and within countries. Part 2<br />
explores early grade reading – one of <strong>the</strong><br />
foundations for learning. Part 3 looks at <strong>the</strong> wider<br />
challenge of improving learning in schools and at<br />
global trends in teacher recruitment.<br />
The learning gap —<br />
from global to local<br />
In an increasingly knowledge-based world,<br />
prosperity, employment and poverty reduction –<br />
for countries and individuals – depend increasingly<br />
on skills and capabilities delivered in <strong>the</strong> classroom.<br />
For large parts of <strong>the</strong> world’s population, however,<br />
education systems fall far short of legitimate<br />
expectations. Poor quality in education is<br />
jeopardizing <strong>the</strong> future of millions of young people,<br />
many of whom face <strong>the</strong> prospect of lifelong illiteracy.<br />
104
PROGRESS TOWARDS THE <strong>EFA</strong> GOALS<br />
The quality of education<br />
Cross-country inequalities<br />
and achievement deficits<br />
While significant gaps remain, more and more<br />
countries are participating in global and regional<br />
assessment exercises that make it possible to<br />
measure disparities between countries in terms<br />
of <strong>the</strong> skills students attain after a given period<br />
of learning.<br />
The fourth cycle of Trends in International<br />
Ma<strong>the</strong>matics and Science Study (TIMSS),<br />
conducted in 2007 among eighth grade students,<br />
shows large gaps in learning achievement between<br />
countries (Figure <strong>2.</strong>36). One way of looking at <strong>the</strong>se<br />
gaps is to consider <strong>the</strong> range of results. Average<br />
test scores for students in <strong>the</strong> Republic of Korea,<br />
<strong>the</strong> top-performing country, were almost twice<br />
as high as for students in Ghana, at <strong>the</strong> bottom<br />
of <strong>the</strong> league. Viewed from a different vantage<br />
point, <strong>the</strong> average student in El Salvador, Ghana,<br />
Indonesia and Morocco figures alongside or<br />
below <strong>the</strong> poorest-performing 10% of students<br />
in higher-performing countries.<br />
Few of <strong>the</strong> poorest developing countries<br />
participated in TIMSS 2007. Researchers have<br />
attempted to address this limitation by<br />
reconfiguring scores from wider test exercises.<br />
The results confirm that low-income countries lag<br />
far behind o<strong>the</strong>rs in learning achievement (Altinok,<br />
2008; Hanushek and Woessmann, 2009). One<br />
assessment in India, conducted in <strong>the</strong> states of<br />
Orissa and Rajasthan during 2005, used questions<br />
from TIMSS to see how students in <strong>the</strong>se states<br />
compared with those in countries participating in<br />
<strong>the</strong> original TIMSS survey (Das and Zajonc, 2008).<br />
The results showed that ninth grade students in<br />
Orissa and Rajasthan ranked alongside students<br />
from <strong>the</strong> poorest-performing TIMSS countries.<br />
Learning assessments allow for more than<br />
relative measurement. TIMSS establishes a series<br />
of performance thresholds aimed at measuring<br />
student capabilities. At <strong>the</strong> low end (scores of<br />
400 or less), students have only <strong>the</strong> most basic<br />
knowledge of whole numbers, decimals and basic<br />
graphs. At <strong>the</strong> upper end (over 550), students can<br />
apply <strong>the</strong>ir understanding and knowledge in a<br />
variety of complex situations. In eighteen of <strong>the</strong><br />
countries covered, including Botswana, Egypt and<br />
Saudi Arabia, <strong>the</strong> average student performs below<br />
<strong>the</strong> low threshold (Figure <strong>2.</strong>36). This points to<br />
There are large<br />
gaps in learning<br />
achievement<br />
between countries<br />
Figure <strong>2.</strong>36: There are large gaps in learning achievement across countries<br />
Distribution of TIMSS ma<strong>the</strong>matics scale score for eighth grade students in 2007<br />
800<br />
700<br />
OECD O<strong>the</strong>r high income Middle and low income<br />
Above <strong>the</strong><br />
TIMSS high<br />
international<br />
benchmark<br />
600<br />
TIMSS ma<strong>the</strong>matics scale score<br />
500<br />
400<br />
300<br />
95th<br />
90th<br />
50th percentile<br />
200<br />
10th<br />
5th<br />
100<br />
0<br />
Rep. of Korea<br />
Japan<br />
Hungary<br />
England (U. K.)<br />
United States<br />
Czech Rep.<br />
Australia<br />
Sweden<br />
Scotland (U. K.)<br />
Italy<br />
Norway<br />
Singapore<br />
Slovenia<br />
Malta<br />
Cyprus<br />
Israel<br />
Bahrain<br />
Oman<br />
Kuwait<br />
Saudi Arabia<br />
Qatar<br />
Russian Fed.<br />
Lithuania<br />
Armenia<br />
Serbia<br />
Malaysia<br />
Bulgaria<br />
Ukraine<br />
Romania<br />
Bosnia/Herzeg.<br />
Lebanon<br />
Thailand<br />
Jordan<br />
Turkey<br />
Tunisia<br />
Georgia<br />
Iran, Isl. Rep.<br />
Indonesia<br />
Syrian A. R.<br />
Egypt<br />
Algeria<br />
Colombia<br />
Morocco<br />
Palestinian A. T.<br />
Botswana<br />
El Salvador<br />
Ghana<br />
Below <strong>the</strong><br />
TIMSS low<br />
international<br />
benchmark<br />
Notes: The markers show <strong>the</strong> scale score of <strong>the</strong> indicated percentile. The fiftieth percentile is <strong>the</strong> median score for <strong>the</strong> country. This represents <strong>the</strong> middle of <strong>the</strong> distribution,<br />
with 50% of students scoring above and below <strong>the</strong> median. Low benchmark – students have some knowledge of whole numbers and decimals, operations and basic graphs.<br />
High benchmark – students can organise and draw conclusions from information, make generalizations and solve non-routine problems.<br />
Source: Mullis et al. (2008).<br />
105
0<br />
1<br />
0<br />
CHAPTER 2<br />
2<br />
Education for All Global Monitoring Report<br />
Poor quality<br />
education in<br />
childhood has a<br />
major bearing on<br />
adult illiteracy<br />
34. Expressed at<br />
purchasing power<br />
parity in constant 2006<br />
US dollars.<br />
35. This is based on<br />
grade 3 students<br />
achieving at or below<br />
level 1 performance,<br />
as defined by <strong>the</strong><br />
assessment.<br />
failings in education systems. While average test<br />
scores are higher in OECD countries, <strong>the</strong>ir education<br />
systems still fail a large minority. For example,<br />
approximately 10% of students in England (United<br />
Kingdom) and <strong>the</strong> United States, and an even higher<br />
share in Italy, score below <strong>the</strong> low threshold.<br />
Learning achievement does rise with average<br />
income, but with large variations and some striking<br />
exceptions. Households and governments in<br />
wealthier countries can invest more in education<br />
and this often leads to higher achievement. For<br />
example, average government spending on a<br />
secondary school student in Norway was US$13,388<br />
in 2005, compared with US$348 in Ghana (see<br />
annex, Statistical Table 11). 34 But <strong>the</strong> links between<br />
income and learning are far from automatic. Among<br />
high-income countries, <strong>the</strong> best performers – <strong>the</strong><br />
Republic of Korea and Singapore – outperform<br />
wealthier countries such as <strong>the</strong> United States. The<br />
most striking exceptions are among Arab states. In<br />
Qatar and Saudi Arabia, both high-income countries,<br />
three-quarters of students register below <strong>the</strong> lowest<br />
score threshold – a performance comparable with<br />
that of Ghana. In <strong>the</strong> middle-income countries of<br />
Algeria, Egypt and Morocco, more than half of<br />
students register below <strong>the</strong> lowest threshold.<br />
These results point to serious underlying policy<br />
problems and help explain <strong>the</strong> widely observed<br />
failure of Arab states to translate investment in<br />
education into improved skills, employment<br />
creation and economic growth.<br />
International comparison highlights <strong>the</strong> degree<br />
of inequality in learning achievement worldwide,<br />
with students from low-income countries faring<br />
especially poorly, as Figures <strong>2.</strong>37 and <strong>2.</strong>38<br />
powerfully demonstrate. At age 10 or 11, in <strong>the</strong><br />
fourth grade of primary school, fewer than one<br />
in five children in Japan or <strong>the</strong> Ne<strong>the</strong>rlands<br />
scored below <strong>the</strong> intermediate benchmark on <strong>the</strong><br />
relevant TIMSS scale. In Japan, almost all students<br />
had at least intermediate levels of proficiency,<br />
while in Qatar and Yemen almost no children<br />
scored above that level. Meanwhile, fewer than<br />
20% in El Salvador, Morocco and Tunisia scored<br />
at <strong>the</strong> low benchmark (Figure <strong>2.</strong>37).<br />
Evidence from international assessments of<br />
reading skills is even more disturbing. PISA<br />
assesses students with about eight years of<br />
education. Students with reading literacy below<br />
level 1 are identified as being at risk during <strong>the</strong><br />
transition to work. They are also unlikely to have<br />
achieved sufficient proficiency to be able to<br />
benefit from fur<strong>the</strong>r education and o<strong>the</strong>r learning<br />
opportunities throughout life (OECD, 2007b).<br />
In Kyrgyzstan, 70% of students tested in PISA<br />
failed to achieve level 1 proficiency in reading<br />
(Figure <strong>2.</strong>38). In Brazil, Indonesia, Mexico and<br />
Thailand, more than 40% of students were at level1<br />
or below. After eight years of schooling, <strong>the</strong>se<br />
children were unable to demonstrate levels of<br />
literacy that would typically be achieved by <strong>the</strong><br />
middle of primary school in OECD countries.<br />
Sub-Saharan Africa is covered poorly by<br />
international learning assessments, but <strong>the</strong>re is<br />
no shortage of evidence pointing to acute problems.<br />
Regional assessments conducted by <strong>the</strong> Sou<strong>the</strong>rn<br />
and Eastern Africa Consortium for Monitoring<br />
Educational Quality (SACMEQ) from 2000 to 2002<br />
for Malawi, Namibia and Zambia found that over<br />
70% of grade 6 students in each country had not<br />
achieved basic numeracy. Students in Lesotho<br />
and South Africa did not do much better: over half<br />
of all students failed to achieve basic levels of<br />
numeracy. The evidence from sub-Saharan Africa<br />
also demonstrates that income is not <strong>the</strong> only<br />
factor shaping learning achievement. Lesotho<br />
and South Africa have much higher per capita<br />
incomes and government resources than Kenya,<br />
but <strong>the</strong>y registered lower levels of primary school<br />
learning achievement.<br />
Poor quality of education in childhood has a major<br />
bearing on adult illiteracy. Young adults with no<br />
education or just a few years of school inevitably<br />
figure prominently in <strong>the</strong> ranks of adult illiterates.<br />
But so do some who have spent several years in<br />
school. An analysis of adult literacy in twenty-one<br />
countries in sub-Saharan Africa using household<br />
survey data found that 22- to 24-year-olds with five<br />
years of education had a 40% probability of being<br />
illiterate (UNESCO-BREDA, 2007). People with<br />
seven years of education had a 20% chance of<br />
being illiterate. These figures point not just to an<br />
enormous waste of human potential and restricted<br />
opportunity, but to a failure of investment in<br />
education to deliver results.<br />
In Latin America and <strong>the</strong> Caribbean, reading<br />
proficiency of primary school students also varies<br />
widely (Figure <strong>2.</strong>39). According to <strong>the</strong> recent<br />
Segundo Estudio Regional Comparativo y Explicativo<br />
(SERCE) assessment, less than half of all grade 3<br />
students in <strong>the</strong> Dominican Republic, Ecuador and<br />
Guatemala had more than very basic reading skills<br />
(UNESCO-OREALC, 2008). 35 In contrast, over 85%<br />
106
PROGRESS TOWARDS THE <strong>EFA</strong> GOALS<br />
The quality of education<br />
Figure <strong>2.</strong>37: There are wide disparities across countries in primary school ma<strong>the</strong>matics performance<br />
% of fourth grade students reaching <strong>the</strong> TIMSS international benchmarks for ma<strong>the</strong>matics achievement, 2007<br />
100<br />
OECD O<strong>the</strong>r high income Middle and low-income<br />
80<br />
Highest benchmark achieved (% of students)<br />
60<br />
40<br />
20<br />
0<br />
20<br />
40<br />
60<br />
Advanced benchmark<br />
High benchmark<br />
Intermediate benchmark<br />
Low benchmark<br />
Below low benchmark<br />
80<br />
100<br />
Japan<br />
Ne<strong>the</strong>rlands<br />
England (U. K.)<br />
Germany<br />
United States<br />
Denmark<br />
Australia<br />
Austria<br />
Sweden<br />
Hungary<br />
Italy<br />
Scotland (U. K.)<br />
New Zealand<br />
Czech Republic<br />
Norway<br />
Hong Kong, China<br />
Singapore<br />
Slovenia<br />
Kuwait<br />
Qatar<br />
Latvia<br />
Kazakhstan<br />
Russian Fed.<br />
Lithuania<br />
Slovakia<br />
Armenia<br />
Ukraine<br />
Georgia<br />
Iran, Isl. Rep.<br />
Algeria<br />
Colombia<br />
Morocco<br />
Tunisia<br />
El Salvador<br />
Yemen<br />
Notes: Low benchmark – students have some basic ma<strong>the</strong>matical knowledge, an understanding of adding and subtracting with whole numbers, and can read information from simple bar graphs<br />
and tables. High benchmark – students can apply <strong>the</strong>ir ma<strong>the</strong>matical understanding and knowledge in relatively complex situations and explain <strong>the</strong>ir meaning.<br />
Source: Mullis et al. (2008).<br />
of students in Costa Rica and Cuba had moved<br />
beyond <strong>the</strong> basics. Primary school students in<br />
Cuba performed extremely well. Over 40% of Cuban<br />
grade 3 students achieved <strong>the</strong> highest reading skills<br />
assessed, more than double <strong>the</strong> share in Chile and<br />
Mexico. At <strong>the</strong> o<strong>the</strong>r end of <strong>the</strong> achievement scale,<br />
Cuba has <strong>the</strong> smallest share of students<br />
performing below <strong>the</strong> lowest grade.<br />
Countries in South and West Asia also suffer from<br />
significant deficits in levels of learning. In rural<br />
Pakistan, a recent survey found that only two-thirds<br />
of students in grade 3 could subtract single digit<br />
numbers, and only a small proportion could tell<br />
<strong>the</strong> time or carry out simple multiplication and<br />
division (Das et al., 2006). In rural India, levels<br />
of learning are equally troubling. In 2008, just 28%<br />
of grade 3 students could subtract two-digit<br />
numbers and only a third could tell <strong>the</strong> time<br />
(Pratham Resource Centre, 2008).<br />
In one important respect international learning<br />
assessments understate <strong>the</strong> problem. This is<br />
because <strong>the</strong>y cover only children in school, ra<strong>the</strong>r<br />
than <strong>the</strong> entire age group. Factoring in out-of-school<br />
children would significantly lower <strong>the</strong> scores of<br />
countries that are far from universal primary<br />
enrolment at <strong>the</strong> level being tested. In Ghana, TIMSS<br />
2007 found that 17% of 16-year-olds scored above<br />
<strong>the</strong> low international benchmark, but only around<br />
half of <strong>the</strong> children of this age were in school.<br />
This implies that only 9% of Ghanaian 16-year-olds<br />
have mastered <strong>the</strong> most basic maths skills. In highincome<br />
countries such as <strong>the</strong> Czech Republic and<br />
England (United Kingdom), most children at <strong>the</strong><br />
same stage are still in school and have far higherlevel<br />
skills in ma<strong>the</strong>matics (Mullis et al., 2008). 36<br />
Disparities in learning within countries<br />
An equal opportunity to learn is no less a human<br />
right than an equal entitlement to be in school,<br />
regardless of parental income, gender, language or<br />
ethnicity. The Dakar <strong>goals</strong> in some cases explicitly<br />
target greater equity. For example, achieving gender<br />
parity in learning achievement is an important part<br />
of goal 6 and a key component of achieving gender<br />
equality in education by 2015 (goal 5) (Box <strong>2.</strong>22).<br />
In many countries, however, large disparities in<br />
learning achievement point to deep disparities<br />
in opportunity. What students achieve is heavily<br />
influenced by both <strong>the</strong> type of school <strong>the</strong>y attend<br />
and <strong>the</strong> characteristics of <strong>the</strong>ir family backgrounds.<br />
International<br />
learning<br />
assessments<br />
understate <strong>the</strong><br />
problem as <strong>the</strong>y<br />
only cover children<br />
in school<br />
36. For <strong>the</strong> TIMSS<br />
assessment children are<br />
assessed in grade 8 of <strong>the</strong>ir<br />
education careers. In <strong>the</strong><br />
Czech Republic and England<br />
(United Kingdom) <strong>the</strong><br />
average age of children in<br />
grade 8 was 14 compared<br />
with 16 in Ghana.<br />
107
1<br />
0<br />
0<br />
CHAPTER 2<br />
2<br />
Education for All Global Monitoring Report<br />
100<br />
80<br />
60<br />
40<br />
20<br />
0<br />
20<br />
40<br />
60<br />
80<br />
100<br />
Figure <strong>2.</strong>38: Reading ability in secondary school also varies greatly across countries<br />
% of 15-year-old students reaching <strong>the</strong> PISA standard levels of reading proficiency, 2006<br />
Level 5<br />
Level 4<br />
Level 3<br />
Level 2<br />
Level 1<br />
Below level 1<br />
Highest benchmark achieved (% of students)<br />
100<br />
80<br />
60<br />
40<br />
20<br />
0<br />
20<br />
40<br />
60<br />
80<br />
100<br />
OECD<br />
Rep. of Korea<br />
Finland<br />
Canada<br />
Ireland<br />
New Zealand<br />
Australia<br />
Ne<strong>the</strong>rlands<br />
Sweden<br />
Belgium<br />
Switzerland<br />
Germany<br />
Japan<br />
Denmark<br />
United Kingdom<br />
France<br />
Austria<br />
Iceland<br />
Norway<br />
Hungary<br />
Czech Rep.<br />
Luxembourg<br />
Portugal<br />
Italy<br />
Slovakia<br />
Greece<br />
Spain<br />
O<strong>the</strong>r high income<br />
Hong Kong, China<br />
Liechtenstein<br />
Estonia<br />
Slovenia<br />
Macao, China<br />
Israel<br />
Qatar<br />
Notes: Below level 1 – students have serious difficulty using reading literacy as an effective tool to advance and extend <strong>the</strong>ir knowledge and skills in o<strong>the</strong>r areas. Level 5 –<br />
students can complete sophisticated reading tasks, such as evaluating critically, building hypo<strong>the</strong>ses, and locating and accommodating concepts contrary to expectations.<br />
Source: OECD (2007b).<br />
Figure <strong>2.</strong>39: Latin America’s reading league has large performance gaps<br />
Levels of reading performance of third grade primary school students in Latin America, 2007<br />
Percentage of students reaching performance level<br />
Cuba<br />
Chile<br />
Costa Rica<br />
Mexico<br />
Uruguay<br />
Argentina<br />
Colombia<br />
Brazil<br />
El Salvador<br />
Nicaragua<br />
Peru<br />
Panama<br />
Paraguay<br />
Ecuador<br />
Guatemala<br />
Dominican Rep.<br />
Level 4<br />
Level 3<br />
Level 2<br />
Level 1<br />
Below level 1<br />
Notes: Level 1 – Students can locate information with a single meaning which is repeated in a prominent<br />
part of a text. Level 4 – Students can integrate and generalize information given in a paragraph, read a text<br />
and identify new information.<br />
Source: UNESCO-OREALC (2008).<br />
The case for reducing disparities in learning<br />
achievement goes beyond education. More<br />
equitable education, combined with sustained<br />
improvement in overall quality, is likely to be good<br />
for economic growth and social cohesion. Achieving<br />
greater equity will require a stronger focus on<br />
schools that serve <strong>the</strong> disadvantaged – and on<br />
<strong>the</strong> factors beyond education that diminish learning<br />
achievement. Many countries have shown that<br />
it is possible to combine equity with high levels<br />
of overall achievement.<br />
Measuring equity in learning achievement is<br />
inherently difficult. One approach is simply to<br />
measure <strong>the</strong> gap between <strong>the</strong> best- and worstperforming<br />
students. Figure <strong>2.</strong>40 applies this<br />
measure to grade 4 ma<strong>the</strong>matics results using<br />
data from TIMSS. The sizes of <strong>the</strong> bars show<br />
differences in test scores between <strong>the</strong> best<br />
performers (ninety-fifth percentile) and <strong>the</strong> worst<br />
(fifth percentile), expressed as a percentage of<br />
<strong>the</strong> average country score. In OECD countries,<br />
disparities in learning are typically smaller than<br />
in o<strong>the</strong>r countries covered in TIMSS. In Germany,<br />
<strong>the</strong> difference between <strong>the</strong> best and worst<br />
performers is about 42% of <strong>the</strong> mean score of 525.<br />
108
PROGRESS TOWARDS THE <strong>EFA</strong> GOALS<br />
The quality of education<br />
Middle and low-income<br />
Poland<br />
Latvia<br />
Croatia<br />
Lithuania<br />
Turkey<br />
Chile<br />
Russian Fed.<br />
Uruguay<br />
Bulgaria<br />
Mexico<br />
Thailand<br />
Argentina<br />
Serbia<br />
Jordan<br />
Brazil<br />
Colombia<br />
Romania<br />
Montenegro<br />
Tunisia<br />
Indonesia<br />
Azerbaijan<br />
Kyrgyzstan<br />
Disparities in learning tend to be much wider<br />
in low-income countries, with some of <strong>the</strong><br />
widest disparities found in Arab states. In Yemen,<br />
<strong>the</strong> difference between <strong>the</strong> best and worst<br />
performers is 368 scale points, or 165% of <strong>the</strong><br />
mean score of 224. A study of ma<strong>the</strong>matics<br />
achievement in <strong>the</strong> Indian states of Orissa and<br />
Rajasthan found that <strong>the</strong> range in test scores<br />
between <strong>the</strong> best and worst performers was wider<br />
than for all TIMSS countries except South Africa<br />
(Das and Zajonc, 2008). 37<br />
Differences between schools play a critical role<br />
in <strong>the</strong> level of equity within education systems,<br />
as evidence from <strong>the</strong> OECD countries shows.<br />
Measured on a global scale, <strong>the</strong>se countries have<br />
relatively low overall levels of inequality in learning<br />
achievement. Where <strong>the</strong>y differ is in <strong>the</strong> share<br />
of inequality that can be traced back to schools.<br />
In Nordic countries such as Finland, Iceland and<br />
Norway, less than 10% of <strong>the</strong> variation in science<br />
scores is explained by school differences. At <strong>the</strong><br />
o<strong>the</strong>r end of <strong>the</strong> scale, such differences account<br />
for over half <strong>the</strong> variation in test scores in Germany<br />
(Figure <strong>2.</strong>41). 38 Such findings demonstrate <strong>the</strong><br />
degree to which school-based factors can widen –<br />
or narrow – learning achievement gaps.<br />
100<br />
80<br />
60<br />
40<br />
20<br />
0<br />
20<br />
40<br />
60<br />
80<br />
100<br />
Highest benchmark achieved (% of students)<br />
Box <strong>2.</strong>22: Gender parity and learning achievement<br />
In many countries, girls are less likely than boys to get into school.<br />
Once in school, though, <strong>the</strong>y tend to perform as well as, or better than,<br />
<strong>the</strong>ir male classmates. While <strong>the</strong>re are important gender-based<br />
differences in learning achievement by subject, learning achievement<br />
in general is not characterized by deep inequalities.<br />
OECD countries. In PISA 2006, average reading scores for<br />
15-year-old girls were 8% higher than those of boys throughout<br />
<strong>the</strong> OECD. In ma<strong>the</strong>matics, boys held an advantage over girls.<br />
The widest gap was found in Austria, where males’ test scores were<br />
on average 5% higher. Gender differences in science tended to be<br />
statistically insignificant.<br />
Arab States. TIMSS 2007 covered thirteen of <strong>the</strong> twenty Arab States.<br />
In most of <strong>the</strong>m, grade 8 girls outperformed boys in ma<strong>the</strong>matics.<br />
In Qatar, girls’ test scores were 13% higher than boys’. A similar<br />
number of countries recorded a female advantage in science, with<br />
larger gender gaps in many cases. In Qatar, girls scored on average<br />
25% higher than boys.<br />
Central and Eastern Europe. PISA 2006 covered fifteen of <strong>the</strong><br />
twenty-one countries in this region. All registered a large female<br />
advantage in reading performance. In most, gender gaps in<br />
ma<strong>the</strong>matics were statistically insignificant; in <strong>the</strong> remaining<br />
countries boys tended to do slightly better than girls.<br />
Latin America and <strong>the</strong> Caribbean. Information from sixteen countries<br />
in <strong>the</strong> 2006 SERCE assessment in ma<strong>the</strong>matics shows that boys in<br />
<strong>the</strong> sixth grade performed better than girls. When reading was<br />
assessed, girls outperformed boys, but in both subjects <strong>the</strong> average<br />
differences were small.<br />
Sub-Saharan Africa. Among Francophone countries participating<br />
in <strong>the</strong> PASEC assessment, <strong>the</strong>re were no large gender differences<br />
in second and fifth grade performance in French or ma<strong>the</strong>matics.<br />
For <strong>the</strong> thirteen countries participating in <strong>the</strong> 2000–2002 SACMEQ<br />
assessments, gender differences in sixth grade English were on <strong>the</strong><br />
whole ei<strong>the</strong>r statistically insignificant or small. 1 In ma<strong>the</strong>matics, about<br />
half <strong>the</strong> participating countries showed no statistically significant<br />
gender difference. In <strong>the</strong> rest, males’ average scores tended to be<br />
higher but <strong>the</strong> differences were not large. 2<br />
These findings confirm that gender gaps in overall achievement are<br />
modest. Where differences do exist, <strong>the</strong> data show that, except in <strong>the</strong><br />
Arab States, girls do better in languages and boys in ma<strong>the</strong>matics and<br />
science. Eliminating remaining gaps will be necessary if <strong>the</strong> goal of<br />
education for all is to be achieved. However, it has to be recognized<br />
that current data provide an incomplete picture, especially for countries<br />
that do not participate in international and regional assessments.<br />
1. Seychelles was <strong>the</strong> exception, where girls’ performance in English compared<br />
with that of boys was 0.65 of a standard deviation higher.<br />
<strong>2.</strong> Seychelles was again <strong>the</strong> exception, where girls’ performance in ma<strong>the</strong>matics<br />
compared with that of boys was 0.38 of a standard deviation higher.<br />
Sources: Bonnet (2009); Ma (2007); Mullis et al. (2008); OECD (2007b).<br />
37. The study compares test scores of students at <strong>the</strong> fifth<br />
and ninety-fifth percentile of <strong>the</strong> test score distribution.<br />
38. The overall dispersion of test scores in Germany is 110% of<br />
<strong>the</strong> OECD average, compared with 81% in Finland (OECD, 2007b).<br />
109
0<br />
0<br />
1<br />
CHAPTER 2<br />
2<br />
Education for All Global Monitoring Report<br />
Figure <strong>2.</strong>40: Learning gaps are higher in poor countries<br />
Learning gaps in TIMSS ma<strong>the</strong>matics scale scores for fourth grade<br />
students, 2007<br />
Hong Kong, China<br />
Ne<strong>the</strong>rlands<br />
Germany<br />
Latvia<br />
Sweden<br />
Japan<br />
Denmark<br />
Austria<br />
Singapore<br />
Lithuania<br />
United States<br />
Slovenia<br />
Czech Rep.<br />
Kazakhstan<br />
Italy<br />
Russian Fed.<br />
Scotland (U. K.)<br />
England (U. K.)<br />
Norway<br />
Australia<br />
Slovakia<br />
New Zealand<br />
Hungary<br />
Armenia<br />
Ukraine<br />
Georgia<br />
Iran, Isl. Rep.<br />
Algeria<br />
Colombia<br />
El Salvador<br />
Morocco<br />
Qatar<br />
Kuwait<br />
Tunisia<br />
Yemen<br />
0 20 40 60 80 100 120 140 160 180<br />
Disparity in scale score expressed as a percentage<br />
of <strong>the</strong> mean score<br />
Figure <strong>2.</strong>41: When schools make a difference — inequality in student<br />
performance across schools varies widely in rich countries<br />
Variation in PISA science scale scores in OECD countries explained<br />
by differences across schools, 2006<br />
Finland<br />
Iceland<br />
Norway<br />
Sweden<br />
Poland<br />
Spain<br />
Denmark<br />
New Zealand<br />
Ireland<br />
Australia<br />
Canada<br />
United Kingdom<br />
United States<br />
Luxembourg<br />
Portugal<br />
Switzerland<br />
Mexico<br />
Rep. of Korea<br />
Slovakia<br />
Japan<br />
Greece<br />
Italy<br />
Belgium<br />
Turkey<br />
Austria<br />
Czech Republic<br />
Ne<strong>the</strong>rlands<br />
Germany<br />
Hungary<br />
0 10 20 30 40 50 60 70 80<br />
% of total variance explained by differences across schools<br />
Note: The length of <strong>the</strong> bars shows <strong>the</strong> percentage of <strong>the</strong> total variation in student<br />
performance that is accounted for by performance differences between schools.<br />
Source: OECD (2007b).<br />
Note: The bars show <strong>the</strong> difference in test scores between students at <strong>the</strong> fifth and<br />
ninety-fifth percentiles, expressed as a percentage of <strong>the</strong> country’s mean test score.<br />
Source: Mullis et al. (2008).<br />
at <strong>the</strong> secondary level have helped reduce youth<br />
unemployment, but early tracking has contributed<br />
to high levels of inequality across schools.<br />
39. Performance<br />
differences among<br />
schools can also arise<br />
because households with<br />
similar social and<br />
economic backgrounds<br />
often make <strong>the</strong> same<br />
school choices (e.g. public<br />
or private schooling), or<br />
because government<br />
policy on how students<br />
are selected into specific<br />
schools has this effect.<br />
Does greater equity come at <strong>the</strong> price of reduced<br />
average performance? Not in this case: Finland is<br />
both more equitable and higher performing than<br />
Germany. The greater equity is partly <strong>the</strong> result of<br />
comprehensive education systems that provide<br />
similar opportunities for all. In recent years, Poland<br />
has achieved substantial reductions in inequality<br />
among schools by extending <strong>the</strong> duration of<br />
comprehensive education (Box <strong>2.</strong>23). One factor<br />
contributing to school-based inequality in many<br />
OECD countries is <strong>the</strong> grouping of students into<br />
rigidly separate ability streams, or into academic<br />
and vocational tracks or schools (OECD, 2007b;<br />
Schutz et al., 2008). In Germany, vocational tracks<br />
In many developing countries, differences in<br />
performance across schools are linked to <strong>the</strong><br />
teaching environment. School systems are often<br />
marked by large variations in class size, availability<br />
of books and teaching materials, teacher quality<br />
and school building standards. 39 In <strong>the</strong> 2000–2002<br />
SACMEQ assessment, differences among schools<br />
accounted for 37% of <strong>the</strong> variation in student<br />
reading performance (Dolata et al., 2004).<br />
Research in India and Pakistan has also found that<br />
differences in school characteristics help explain<br />
inequality in test scores (Das et al., 2006; Das and<br />
Zajonc, 2008). In Bolivia and Chile, a study showed<br />
that over half <strong>the</strong> large disparities in learning<br />
110
PROGRESS TOWARDS THE <strong>EFA</strong> GOALS<br />
The quality of education<br />
between indigenous and non-indigenous students<br />
were explained by <strong>the</strong> poor quality of schools<br />
serving indigenous students (McEwan, 2004).<br />
These findings demonstrate that improving school<br />
quality and narrowing differences among schools<br />
will reduce inequality in student performance. In <strong>the</strong><br />
mid-1990s, Brazil created <strong>the</strong> Fundo de Manutenção<br />
e Desenvolvimento do Ensino Fundamental e de<br />
Valorização do Magistério (FUNDEF), a fund to<br />
finance subnational spending on primary and lower<br />
secondary education to ensure a more equitable<br />
distribution of per-student spending across <strong>the</strong><br />
country. Preliminary evidence suggests that this<br />
redistributive policy has narrowed learning<br />
inequalities, though only by a small amount (Gordon<br />
and Vegas, 2005). In o<strong>the</strong>r countries, per-student<br />
funding formulas have been introduced to ensure<br />
that resources are more equitably distributed<br />
across regions and population groups.<br />
Box <strong>2.</strong>23: Improving equity in Poland<br />
In 1999, Poland started providing an additional year of general<br />
education before students were split into upper secondary school<br />
tracks. By using three rounds of PISA it is possible to assess <strong>the</strong><br />
reform’s impact on equity:<br />
From 2000 to 2003, average variation in student performance<br />
in science fell from 51% of <strong>the</strong> OECD average to 15%. By 2006,<br />
Poland had one of <strong>the</strong> lowest levels of variation in science<br />
performance among participating countries (Figure <strong>2.</strong>41).<br />
Improvement in equity came about at <strong>the</strong> same time as general<br />
improvement in performance. For example, average reading<br />
performance of 15-year-olds increased by twenty-nine score<br />
points between 2000 and 2006.<br />
Most of <strong>the</strong> improvement occurred among students with poor<br />
performance. From 2000 to 2006, <strong>the</strong> proportion of students<br />
failing to score above level 1 in reading competency fell from<br />
23% to 16%.<br />
Students in <strong>the</strong> vocational track appear to have benefited<br />
most from greater integration of <strong>the</strong> system.<br />
School-based disparities do not operate in isolation.<br />
In many cases <strong>the</strong>y interact with and reinforce<br />
wider disadvantage. Parental income and education,<br />
home language and o<strong>the</strong>r factors are all strongly<br />
associated with learning achievement levels, as<br />
<strong>the</strong> following cases demonstrate:<br />
In Pakistan, children from families in <strong>the</strong> richest<br />
third of <strong>the</strong> population scored on average<br />
between 0.25 and 0.5 of a standard deviation<br />
higher than children from <strong>the</strong> poorest households<br />
(Das et al., 2006).<br />
In Peru, in national assessments of ma<strong>the</strong>matics<br />
conducted in 2004, sixth grade pupils whose<br />
mo<strong>the</strong>r tongue was Spanish scored more than<br />
one standard deviation higher than children<br />
whose mo<strong>the</strong>r tongue was an indigenous<br />
language (Cueto et al., 2009).<br />
Fifth grade students from Cameroon’s Bamileke<br />
language group scored 48% on <strong>the</strong> PASEC<br />
literacy test, compared with 56% for students<br />
from <strong>the</strong> Ewondo language group (Fehrler and<br />
Michaelowa, 2009).<br />
In <strong>the</strong> 2006 SERCE assessments in Latin America<br />
and <strong>the</strong> Caribbean, students who undertook a<br />
significant amount of work, inside and outside<br />
<strong>the</strong> home, had lower levels of ma<strong>the</strong>matics<br />
achievement on average. For example, in<br />
El Salvador, sixth graders who worked had<br />
average scores 6% lower than those of children<br />
who did not (Bonnet, 2009).<br />
Source: OECD (2007b).<br />
A longitudinal study in Ethiopia found that 42%<br />
of 12-year-olds who had lost <strong>the</strong>ir mo<strong>the</strong>rs<br />
between ages 8 and 12 were unable to read,<br />
while for children with both parents living <strong>the</strong><br />
figure was 23% (Himaz, 2009). The study<br />
attributed <strong>the</strong> difference to lower school<br />
enrolment among orphans, as well as poorer<br />
performance in school.<br />
In countries with more equitable systems,<br />
children’s backgrounds are less important in<br />
determining levels of achievement. In countries<br />
where <strong>the</strong>re is a strong relationship between<br />
student background and performance, or where<br />
large differences in student background exist,<br />
reducing differences in school quality is unlikely<br />
to be enough to improve equity significantly.<br />
Targeted programmes to improve learning among<br />
children who are being left behind will also be<br />
needed (see <strong>Chapter</strong> 3). In Mexico, <strong>the</strong> Consejo<br />
Nacional de Fomento Educativo (CONAFE) provides<br />
supplemental funds, learning materials – including<br />
textbooks in indigenous languages – and teacher<br />
support to schools in areas marked by consistent<br />
underperformance and disadvantage. Evaluations<br />
indicate that <strong>the</strong>se efforts have narrowed <strong>the</strong> gap<br />
in primary school ma<strong>the</strong>matics scores, though<br />
<strong>the</strong>y have had little impact on Spanish scores<br />
(Vegas and Petrow, 2008).<br />
School-based<br />
disparities interact<br />
with student<br />
background and<br />
socio-economic<br />
status<br />
111
0<br />
1<br />
0<br />
CHAPTER 2<br />
2<br />
Education for All Global Monitoring Report<br />
It is crucial<br />
for reading<br />
difficulties to be<br />
detected early<br />
and acted<br />
upon quickly<br />
40. The positive<br />
correlation between<br />
comprehension and oral<br />
reading fluency has been<br />
<strong>the</strong> subject of much<br />
research. For additional<br />
examples see Kudo and<br />
Bazan (2009) and RTI<br />
International (2008).<br />
41. In <strong>the</strong> United States,<br />
children are identified as<br />
being at risk of developing<br />
learning difficulties if <strong>the</strong>ir<br />
reading speed is below<br />
seventy words per minute<br />
in grade 2 and below<br />
eighty in grade 3.<br />
4<strong>2.</strong> It is not possible to<br />
compare across countries<br />
in <strong>the</strong> table owing to <strong>the</strong><br />
different languages used<br />
and differences in <strong>the</strong><br />
ages of student<br />
populations.<br />
Teaching reading in <strong>the</strong> early<br />
primary grades is crucial for learning<br />
Children lacking reading and comprehension<br />
skills are unable to use textbooks and o<strong>the</strong>r<br />
written materials and to take advantage of learning<br />
opportunities in or out of school. Research shows<br />
that children who have difficulties acquiring <strong>the</strong>se<br />
skills in <strong>the</strong>ir early lives are likely to struggle<br />
throughout <strong>the</strong>ir school careers (Jukes et al.,<br />
2006). Schools in many developing countries are<br />
failing to equip young learners with <strong>the</strong>se basic<br />
skills. If <strong>the</strong> <strong>EFA</strong> quality goal is to be achieved,<br />
it is crucial for reading difficulties to be detected<br />
early and acted upon quickly.<br />
Understanding is central to <strong>the</strong> achievement of<br />
reading skills. Children need to be able to read<br />
with sufficient fluency to obtain meaning from<br />
what is being read. Reading accurately and quickly<br />
has been shown in many cases to be strongly<br />
correlated with comprehension (Abadzi, 2006;<br />
Fuchs et al., 2001). In a small-scale survey of<br />
Peruvian first and second graders, children who<br />
could answer a set of three comprehension<br />
questions correctly read on average at seventyseven<br />
words per minute, compared with fifteen<br />
words per minute for children who only answered<br />
one comprehension question correctly (Abadzi<br />
et al., 2005). 40 Early grade reading assessments<br />
aim to test comprehension by measuring reading<br />
fluency (Box <strong>2.</strong>24). Estimates vary, but reading<br />
fluency in excess of forty words per minute<br />
is thought to be required for comprehension<br />
(Abadzi, 2006). 41<br />
Small-scale reading assessments conducted in<br />
several low-income countries paint a worrying<br />
picture (Table <strong>2.</strong>7). 42 While <strong>the</strong>se tests are not<br />
nationally representative, <strong>the</strong>y often point to<br />
very low levels of fluency in reading. Average<br />
performance in many test sites falls far short of<br />
automatic reading, implying that large numbers<br />
of children are failing to achieve <strong>the</strong> basic reading<br />
skills necessary to facilitate fur<strong>the</strong>r learning:<br />
In Gambia, children in grades 1 to 3 were able,<br />
on average, to read six words correctly in a<br />
minute.<br />
In Liberia, grade 2 students could read eighteen<br />
words per minute. Although fluency increased<br />
in grade 3, it was still below <strong>the</strong> estimated forty<br />
words per minute required for comprehension.<br />
Looking beyond <strong>the</strong> averages reveals <strong>the</strong> poor<br />
outcomes for some children:<br />
In Ethiopia, a 2008 study of grade 3 students<br />
in Woliso district found that 36% could not read<br />
a single word in Afan Oromo, <strong>the</strong> local language<br />
(DeStefano and Elaheebocus, 2009).<br />
In Guatemala, two-thirds of students could read<br />
more than forty words correctly per minute but<br />
wide disparities across language groups existed.<br />
Students whose mo<strong>the</strong>r tongue was Mam had<br />
average reading speeds below forty words per<br />
minute whereas students whose mo<strong>the</strong>r tongue<br />
was Quiche or Spanish read more than sixty<br />
words per minute (Dowd, 2009).<br />
Assessing reading skills early in primary school<br />
provides an opportunity to identify children with low<br />
learning achievement and take remedial measures<br />
that can help prevent dropout and grade repetition.<br />
It is far less time-consuming and costly to prevent<br />
low achievement at an early age than to act later.<br />
Evidence from several countries demonstrates<br />
that policy interventions can make a difference<br />
in improving reading skills. Involving schools and<br />
communities is a key to success. A programme<br />
operated by a non-government organization in<br />
Uttar Pradesh, India, has used ‘remedial reading<br />
camps’ run by volunteer trainers to achieve<br />
impressive improvements in early reading<br />
(Box <strong>2.</strong>25). In <strong>the</strong> Malindi district of Kenya, teachers<br />
were trained for five days on a set of carefully<br />
designed lessons to teach effective reading skills<br />
to grade 2 students (Crouch et al., 2009). Significant<br />
improvements resulted: comparing grade 2 results<br />
before and after teachers were trained showed that<br />
reading speeds had improved by 80%, on average.<br />
While it is difficult to attribute all <strong>the</strong> improvement<br />
to <strong>the</strong> training, <strong>the</strong> study showed that this relatively<br />
small intervention and <strong>the</strong> information it generated<br />
on <strong>the</strong> poor state of reading skills contributed<br />
significantly. 43 Pilot studies in Mali and <strong>the</strong> Niger<br />
in 2007 also demonstrated promising approaches<br />
to improving reading skills at relatively low cost<br />
(Mitton, 2008).<br />
Whe<strong>the</strong>r such pilot programmes can be scaled up<br />
to improve reading across national education<br />
43. The study was set up as a randomized trial but improvement in<br />
reading skills was seen in schools where <strong>the</strong> teachers had received <strong>the</strong><br />
training as well as in <strong>the</strong> schools where <strong>the</strong>y did not. The study showed<br />
that leakage of teaching techniques and <strong>the</strong> transfer of teachers between<br />
control and treatment schools accounted for similar improvements in<br />
both types of schools.<br />
112
PROGRESS TOWARDS THE <strong>EFA</strong> GOALS<br />
The quality of education<br />
Box <strong>2.</strong>24: What are early grade reading assessments and what can <strong>the</strong>y be used for?<br />
Failure to develop reading skills in <strong>the</strong> early school<br />
years can severely compromise later learning,<br />
undermining progression through grades and<br />
contributing to early dropout. Early grade reading<br />
assessments help teachers identify problems and<br />
correct <strong>the</strong>m. The components assessed include:<br />
phonemic awareness — children can focus on,<br />
manipulate and break apart <strong>the</strong> sounds in words;<br />
ability to use phonics — <strong>the</strong>y can understand<br />
and apply knowledge of how letters are linked<br />
to sounds to form letter-sound correspondences<br />
and spelling patterns;<br />
fluency — <strong>the</strong>y can read orally with speed,<br />
accuracy and proper expression;<br />
vocabulary — <strong>the</strong>y know an increasing number<br />
of words, both orally and in print;<br />
comprehension — <strong>the</strong>y can actively engage with<br />
and derive meaning from texts.<br />
Most of <strong>the</strong>se components are tested by counting<br />
<strong>the</strong> letters and words that children can sound out<br />
accurately in one minute. While <strong>the</strong>re are obvious<br />
dangers with mechanistic application, <strong>the</strong><br />
assessments can be used to capture both word<br />
recognition and understanding. Similar approaches<br />
are used in adult literacy work. Early grade reading<br />
assessments are not designed to serve as tests for<br />
grading students or ranking schools. They are most<br />
useful when integrated into a wider framework for<br />
building children’s confidence and equipping schools<br />
and teachers to respond to <strong>the</strong>ir needs.<br />
Sources: Abadzi (2006); Kudo and Bazan (2009);<br />
RTI International (2008).<br />
Table <strong>2.</strong>7: Results from early grade reading assessments<br />
(correct words per minute)<br />
Gambia<br />
Malindi, Kenya<br />
Liberia<br />
Liberia<br />
Nicaragua<br />
Junin, Peru<br />
Year<br />
Tests of reading in English<br />
Tests of reading in Spanish<br />
Grade<br />
Connected<br />
text fluency<br />
Sample size<br />
2007 1-3 6 1,200<br />
2007 2 10 40 schools<br />
2008 2 18 429<br />
2008 3 28 407<br />
2006 3 18 2,206<br />
2008 3 57 475<br />
Tests of reading in French<br />
Senegal<br />
2007 1-3 19 502<br />
Notes: Unless o<strong>the</strong>rwise stated, sample size refers to <strong>the</strong> number of students<br />
tested. The studies recorded in <strong>the</strong> table also measured o<strong>the</strong>r aspects of reading<br />
outlined in Box <strong>2.</strong>24 and in some cases tested reading in local languages as well.<br />
Sources: Castro and Laguna (2008); Crouch and Korda (2008); Crouch et al (2009);<br />
Jammeh (2008); Kudo and Bazan (2009); Sambe and Sprenger-Charolles (2008).<br />
systems is open to question. Many of <strong>the</strong>se<br />
programmes succeeded because of intensive<br />
efforts to mobilize communities, resources and<br />
local professionals. Duplicating <strong>the</strong>se efforts is<br />
often difficult for subnational authorities, let alone<br />
national ministries. Even so, <strong>the</strong> success of pilot<br />
programmes shows that substantial improvements<br />
are possible. Central governments and education<br />
authorities can make a difference to early learning<br />
through action at many levels, including training<br />
teachers more effectively and providing appropriate<br />
teaching materials.<br />
Box <strong>2.</strong>25: India — remedial reading classes<br />
in Uttar Pradesh<br />
A baseline survey conducted in 2005 in Jaunpur<br />
district in Uttar Pradesh revealed poor acquisition<br />
of basic skills. Among 7- to 14-year-olds, 60% could<br />
not read and understand a simple story designed<br />
for first grade students. In this context, a<br />
randomized evaluation examined <strong>the</strong> impact<br />
on basic education skills of combinations of<br />
three interventions:<br />
encouraging community participation by<br />
providing information and facilitating discussion<br />
on <strong>the</strong> status of local schools and outlining to<br />
village education committees <strong>the</strong>ir roles and<br />
responsibilities;<br />
training community members to assess<br />
children’s learning and presenting <strong>the</strong>se findings<br />
at village meetings;<br />
training local volunteers in simple techniques<br />
for teaching children to read and introducing<br />
reading classes after school.<br />
The evaluation found that information-sharing did<br />
not improve reading skills but that extra classes<br />
after school had a big impact. Overall, <strong>the</strong><br />
evaluation showed that it was possible to get<br />
children who were not fluent readers to read fairly<br />
fluently by combining instruction in school with<br />
additional reading classes which students attend<br />
for two hours a day over a period of three months.<br />
Source: Banerjee et al. (2008).<br />
In India, ‘remedial<br />
reading camps’<br />
have achieved<br />
impressive<br />
improvements<br />
in early reading<br />
113
0<br />
1<br />
0<br />
CHAPTER 2<br />
2<br />
Education for All Global Monitoring Report<br />
In Ethiopia<br />
and Guatemala,<br />
children were<br />
in class and<br />
learning for only<br />
a third of <strong>the</strong><br />
time schools<br />
were officially<br />
open<br />
44. This is <strong>the</strong> percentage<br />
of grade 4 pupils in<br />
schools where <strong>the</strong> head<br />
stated that <strong>the</strong> ‘school<br />
needs complete<br />
rebuilding’ or ‘some<br />
classrooms need major<br />
repairs’.<br />
45. In Liberia, <strong>the</strong><br />
pupil/teacher ratio<br />
increased from 14 to 142<br />
between 2006 and 2008.<br />
This is due to a<br />
substantial decrease in<br />
volunteer and o<strong>the</strong>r<br />
untrained teachers<br />
previously recruited to<br />
meet <strong>the</strong> teacher demand<br />
following <strong>the</strong> civil crisis<br />
(UIS database).<br />
Improving learning in schools<br />
One of <strong>the</strong> most important requirements for<br />
sustained progress <strong>towards</strong> better quality in<br />
education is an improved learning environment,<br />
encompassing <strong>the</strong> physical school infrastructure,<br />
<strong>the</strong> learning process and <strong>the</strong> interaction between<br />
children and teachers.<br />
Low achievement levels are often associated<br />
with a poor school environment. Badly ventilated<br />
classrooms, leaking roofs, poor sanitation and<br />
lack of materials represent significant barriers to<br />
effective learning in many schools. Over half of rural<br />
primary students in Peru, <strong>the</strong> Philippines and Sri<br />
Lanka attend schools viewed by <strong>the</strong> head teacher as<br />
needing major rehabilitation (UIS, 2008b). 44 A recent<br />
survey of primary schools in two Nigerian states<br />
found that over 80% of classrooms in Enugu and<br />
50% in Kaduna ei<strong>the</strong>r did not have a blackboard, or<br />
had one that was barely usable (World Bank, 2008c).<br />
Such conditions are common in many countries.<br />
The fact that <strong>the</strong> most marginalized children<br />
often attend <strong>the</strong> poorest-quality schools adds to<br />
<strong>the</strong>ir learning disadvantages. Urban-rural divides<br />
figure prominently in school quality disparities. In<br />
<strong>the</strong> Philippines, over 70% of urban grade 4 students<br />
attended schools with basic facilities such as<br />
blackboards and toilets, but only about 50% of<br />
rural students attended schools with <strong>the</strong>se<br />
facilities (UIS, 2008b). Improving learning in such<br />
environments requires redistributing resources<br />
<strong>towards</strong> poorer areas.<br />
Many studies highlight <strong>the</strong> positive role of<br />
appropriate textbooks (Boissiere, 2004; Scheerens,<br />
2004). A detailed evaluation of Ghana’s basic<br />
education system found that improvements in<br />
ma<strong>the</strong>matics and English test scores from 1988<br />
to 2003 had been brought about in part through<br />
increased availability of textbooks (White, 2004).<br />
The longer children spend in school over <strong>the</strong> course<br />
of a year, <strong>the</strong> greater <strong>the</strong>ir opportunity to master<br />
<strong>the</strong> curriculum and achieve learning objectives<br />
(Boissiere, 2004). The official number of teaching<br />
hours varies considerably by country (Benavot,<br />
2004), but time spent on effective learning is what<br />
matters for achievement. In effective classrooms,<br />
about 80% of class time is spent on learning<br />
– a benchmark that many schools in developing<br />
countries fail to meet (Abadzi, 2006). Student and<br />
teacher absenteeism fur<strong>the</strong>r reduces learning time.<br />
In Nepal, a detailed study of a small number of<br />
primary schools showed that, while schools were<br />
officially open for 192 days, <strong>the</strong> average student<br />
experienced only 97 days of effective learning<br />
(Dowd, 2009). In Ethiopia and Guatemala, children<br />
were in class and learning for a third of <strong>the</strong> time<br />
schools were officially open (DeStefano and<br />
Elaheebocus, 2009; Dowd, 2009). Better monitoring,<br />
improved teacher incentives and targeted support<br />
for students struggling to attend regularly can all<br />
increase learning time and performance.<br />
Increasing <strong>the</strong> amount of time children spend<br />
learning can be difficult. Chronic overcrowding<br />
of classrooms has led many countries to operate<br />
double-shift systems in schools. These offer<br />
potential efficiency gains in terms of <strong>the</strong> number of<br />
children covered, but <strong>the</strong> gains sometimes come at<br />
a price. In francophone Africa, double-shift teaching<br />
has sometimes reduced learning achievement,<br />
primarily because children spend less time in<br />
school (Michaelowa, 2001). In <strong>the</strong> longer term,<br />
additional classrooms can be built to accommodate<br />
a single-shift system. However, policy-makers<br />
need to assess whe<strong>the</strong>r building classrooms is<br />
as cost-effective in improving learning as o<strong>the</strong>r<br />
investments, such as providing more teaching and<br />
learning materials. Creating conditions that enable<br />
children to remain in school, ensuring that teachers<br />
actually attend and organizing <strong>the</strong> school day to<br />
devote more time to learning are all low-cost<br />
options with potentially high returns.<br />
The important role of teachers<br />
Teachers are <strong>the</strong> single most important education<br />
resource in any country. From early childhood<br />
through primary and secondary school, <strong>the</strong><br />
presence of a qualified, well-motivated teacher<br />
is vital for effective learning. What students achieve<br />
in school is heavily influenced by classroom<br />
practices and teachers’ skills (Aslam and Kingdon,<br />
2007). In many countries, shortages of trained<br />
teachers remain a major barrier to achieving <strong>the</strong><br />
Education for All <strong>goals</strong>, especially among<br />
marginalized groups.<br />
Pre-primary education. Early childhood teachers<br />
and carers play a crucial role in preparing children<br />
for school and supporting <strong>the</strong>ir social, emotional<br />
and cognitive development. The quality of care and<br />
teaching depends critically on <strong>the</strong> pupil/teacher<br />
ratio, teacher training and <strong>the</strong> creation of an active<br />
learning environment (Schumacher and Hoffmann,<br />
2008; UNESCO, 2005). Many countries do not meet<br />
minimum standards of quality, however. In Bolivia,<br />
India, Liberia, 45 Nepal, Uganda and <strong>the</strong> United<br />
114
PROGRESS TOWARDS THE <strong>EFA</strong> GOALS<br />
The quality of education<br />
Republic of Tanzania, for example, <strong>the</strong> pre-primary<br />
pupil/teacher ratio was 40:1 or higher in 2007<br />
(see annex, Statistical Table 10A).<br />
Data from within countries highlight particular<br />
disadvantages facing <strong>the</strong> marginalized in this<br />
respect. In Kenya, <strong>the</strong> national ratio of pupils to<br />
trained pre-primary teachers is 54:1. In <strong>the</strong> arid,<br />
largely pastoral district of Turkana, one of Kenya’s<br />
poorest, <strong>the</strong> ratio is 123:1 (Ruto et al., 2009). In<br />
Indonesia, <strong>the</strong> share of pre-primary teachers with<br />
at least a diploma ranges from 60% in Banten, a<br />
relatively prosperous area, to only 1% in Maluku,<br />
a region with high levels of poverty (Indonesia<br />
Ministry of National Education, 2007).<br />
Primary education. Higher enrolment since 1999<br />
has gone hand in hand with an increase in <strong>the</strong><br />
recruitment of primary teachers. Many countries<br />
in sub-Saharan Africa – including Burkina Faso,<br />
Burundi, <strong>the</strong> Niger and Senegal 46 – have more<br />
than doubled <strong>the</strong> teacher workforce in most cases,<br />
improving <strong>the</strong> pupil/teacher ratio (see annex,<br />
Statistical Table 10A). As countries seek to<br />
accelerate progress <strong>towards</strong> universal primary<br />
education, <strong>the</strong>y will need to sustain a concerted<br />
drive to recruit and train teachers.<br />
Despite <strong>the</strong> progress of <strong>the</strong> past decade, teacher<br />
shortages remain a serious concern. Countries set<br />
<strong>the</strong>ir own targets for pupil/teacher ratios, making<br />
cross-country comparisons difficult (Bennell, 2009).<br />
However, <strong>the</strong> most widely used international ceiling<br />
for <strong>the</strong> pupil/teacher ratio is 40:1 (Takala, 2003;<br />
World Bank Independent Evaluation Group, 2006).<br />
In 2007, 26 countries out of 171 with data were above<br />
this ceiling, all but four of <strong>the</strong>m in sub-Saharan<br />
Africa (see annex, Statistical Table 10A). While data<br />
coverage is patchy, <strong>the</strong>re are also concerns over<br />
<strong>the</strong> ratio of pupils to trained teachers. Countries<br />
including Madagascar, Mozambique, Sierra Leone<br />
and Togo have ratios of pupils to trained teacher<br />
in excess of 80:1 (Figure <strong>2.</strong>42). In fifteen of <strong>the</strong> forty<br />
countries with data, <strong>the</strong> share of trained teachers<br />
in <strong>the</strong> workforce has declined since 1999, in some<br />
cases dramatically (see annex, Statistical Table<br />
10A). In Togo, it has fallen from 31% to 15% as<br />
recruitment has shifted <strong>towards</strong> contract teachers.<br />
National average pupil/teacher ratios can conceal<br />
large disparities. A recent review of teacher<br />
deployment patterns examined differences across<br />
regions in ten countries in sub-Saharan Africa<br />
(Pôle de Dakar, 2009). In some countries <strong>the</strong> ratios<br />
vary by a factor of three. While low ratios are often<br />
Figure <strong>2.</strong>42: Trained teachers are sometimes in short supply<br />
Ratios of pupils to teachers and pupils to trained teachers<br />
in primary education, selected countries, 2007<br />
Mauritania<br />
Côte d’Ivoire<br />
Kenya<br />
Cambodia<br />
Rwanda<br />
U. R. Tanzania<br />
Uganda<br />
Burundi<br />
Eritrea<br />
Congo<br />
Burkina Faso<br />
Mozambique<br />
Bangladesh<br />
Madagascar<br />
Sierra Leone<br />
0 20 40 60 80 100 120<br />
Ratios<br />
Pupil/teacher<br />
Pupil/trained teacher<br />
Note: Among countries with available data, only those with pupil/teacher ratios at<br />
or above 40:1 are included. Countries sorted by <strong>the</strong> gap between <strong>the</strong> pupil/teacher<br />
and <strong>the</strong> pupil/trained teacher ratios.<br />
Sources: Annex, Statistical Table 10A; UIS database.<br />
found in rural areas with highly dispersed<br />
populations, high ratios tend to be concentrated in<br />
areas marked by poverty and acute disadvantage.<br />
In Uganda, nor<strong>the</strong>rn regions affected by conflict were<br />
marked by pupil/teacher ratios in excess of 90:1 –<br />
nearly double <strong>the</strong> national average (Figure <strong>2.</strong>43).<br />
Urban-rural differences create ano<strong>the</strong>r layer of<br />
inequality. The pattern of disadvantage is highly<br />
variable but overall ratios tend to be higher in urban<br />
areas (Zhang et al., 2008). In o<strong>the</strong>r countries such<br />
as Malawi, though, <strong>the</strong> average urban pupil/teacher<br />
ratio is 46:1, compared with 81:1 in rural areas<br />
(Mulkeen, 2009). However, trained teachers are<br />
often concentrated in urban areas. Whereas 60%<br />
of teachers in <strong>the</strong> Ugandan capital, Kampala, are<br />
trained, <strong>the</strong> figure falls to 11% in <strong>the</strong> rural district of<br />
Yumbe. In Lesotho, nearly a quarter of teachers in<br />
lowland areas are unqualified, compared with about<br />
half in <strong>the</strong> mountainous and less accessible areas<br />
(Mulkeen, 2009). These areas also tend to have<br />
higher repetition rates and, like o<strong>the</strong>r rural areas,<br />
poorer test scores (Mulkeen and Chen, 2008).<br />
To some degree, such deployment patterns reflect<br />
self-perpetuating processes of selection and inbuilt<br />
disadvantage. Trained teachers are more likely<br />
to choose to work in urban areas, especially in<br />
systems where <strong>the</strong>ir remuneration is linked to<br />
In nor<strong>the</strong>rn<br />
Uganda, <strong>the</strong>re<br />
were 90 pupils<br />
per teacher<br />
— nearly double<br />
<strong>the</strong> national<br />
average<br />
46. In Senegal, this increase<br />
in teachers is due to <strong>the</strong><br />
creation of more schools,<br />
upgrading of schools with<br />
incomplete primary<br />
education cycles and<br />
double-shift teaching<br />
(UIS, 2009b).<br />
115
2<br />
0<br />
0<br />
1<br />
CHAPTER 2<br />
Education for All Global Monitoring Report<br />
An additional<br />
1.9 million<br />
teachers will<br />
have to be<br />
recruited<br />
to reach UPE<br />
by 2015<br />
47. Estimates of teacher<br />
needs are based on<br />
assumptions regarding<br />
enrolment, repetition<br />
and pupil/teacher ratios.<br />
For technical details<br />
see UIS (2009e).<br />
48. These projections<br />
are based on a teacher<br />
attrition rate of 5%<br />
and include additional<br />
teachers needed to fill<br />
vacancies resulting<br />
from increased attrition<br />
caused by <strong>the</strong> expansion<br />
of universal primary<br />
education and population<br />
growth. For results<br />
using o<strong>the</strong>r attrition<br />
assumptions see<br />
UIS (2009e).<br />
Figure <strong>2.</strong>43: National averages can hide large differences<br />
in pupil/teacher ratios<br />
Provincial disparities in primary education pupil/teacher ratios,<br />
selected sub-Saharan African countries, circa 2005/2006<br />
Eritrea<br />
Uganda<br />
U. R. Tanzania<br />
Zambia<br />
Benin<br />
Malawi<br />
C. A. R.<br />
0 20 40 60 80 100 120 140<br />
Pupil/teacher ratios<br />
Lowest Average Highest<br />
Note: Except where indicated, data do not distinguish between civil servant<br />
teachers and community teachers, or between public and private sector teachers.<br />
Benin data exclude community teachers. C. A. R. data include community teachers.<br />
Countries sorted by average pupil/teacher ratio.<br />
Source: Pôle de Dakar (2009), Table 5.4.<br />
parental contributions. Opportunities for<br />
professional development are also more likely<br />
to be concentrated in urban areas, enabling<br />
urban teachers to gain qualifications more readily<br />
than <strong>the</strong>ir rural counterparts (Bennell and<br />
Akyeampong, 2007). Cities may be seen as<br />
preferable to rural areas for o<strong>the</strong>r reasons,<br />
ranging from <strong>the</strong> quality of housing, amenities<br />
and schools to <strong>the</strong> proximity of friends and family.<br />
Concerns over living in remote and unfamiliar rural<br />
communities can also play a role. Such factors<br />
play a part in <strong>the</strong> preference of female teachers<br />
for urban areas in many countries. In Uganda<br />
and Zambia, <strong>the</strong> share of female teachers in urban<br />
primary schools is about 60%, compared with 15%<br />
to 35% in rural areas (Mulkeen, 2009).<br />
Projected primary school teacher<br />
requirements to 2015<br />
Future teacher recruitment needs vary<br />
enormously by region. They are determined<br />
partly by current deficits and partly by a complex<br />
mix of demographics, enrolment trends and<br />
numbers of children still out of school. The UIS has<br />
re-estimated <strong>the</strong> total number of primary education<br />
teachers that will be required to achieve <strong>the</strong> goal of<br />
universal primary education by 2015 (UIS, 2009e). 47<br />
The numbers underline <strong>the</strong> scale of <strong>the</strong> challenge<br />
facing many countries.<br />
An additional 1.9 million teachers will have to<br />
be recruited to reach universal primary education<br />
by 2015.<br />
Two-thirds of <strong>the</strong> additional teachers – around<br />
1.2 million – will be needed in sub-Saharan Africa.<br />
The Arab States account for around 15%<br />
of <strong>the</strong> additional teachers required.<br />
The effort needed to close <strong>the</strong>se gaps varies by<br />
country (Figure <strong>2.</strong>44). Many governments will have<br />
to expand recruitment by 4% to 18% annually.<br />
For some countries, this means maintaining <strong>the</strong><br />
rate of increase registered since 1999. O<strong>the</strong>rs will<br />
need to step up <strong>the</strong> pace of recruitment and budget<br />
for new posts, including Chad, Côte d’Ivoire,<br />
Djibouti, Eritrea, Kenya and Uganda.<br />
In addition to increasing recruitment to achieve<br />
universal primary education, governments have<br />
to replace teachers expected to retire or leave<br />
<strong>the</strong>ir posts before 2015. 48 Taking into account<br />
<strong>the</strong> need to replace teachers drives up <strong>the</strong> regional<br />
and global recruitment numbers (UIS, 2009e):<br />
An additional 8.4 million primary teachers will<br />
have to be recruited and trained worldwide to<br />
replace existing teachers expected to retire or<br />
leave <strong>the</strong>ir posts before 2015.<br />
Nearly a quarter of <strong>the</strong>se teachers – around<br />
<strong>2.</strong>1 million – will be needed in East Asia and<br />
<strong>the</strong> Pacific.<br />
North America and Western Europe account<br />
for 17%, South and West Asia for 19% and<br />
sub-Saharan Africa for ano<strong>the</strong>r 15% of <strong>the</strong><br />
additional recruitment needed to replace<br />
teachers leaving <strong>the</strong>ir posts by 2015.<br />
A total of 10.3 million additional teachers will be<br />
needed worldwide by 2015, if <strong>the</strong> 1.9 million new<br />
teachers required to achieve universal primary<br />
education are added to <strong>the</strong> 8.4 million needed to<br />
replace departing teachers. The number of extra<br />
teaching posts that need to be created may seem<br />
small compared to <strong>the</strong> teacher needs resulting<br />
from attrition. However, creating new posts requires<br />
an increase in <strong>the</strong> overall budget allocated for<br />
teacher salaries. In many countries this requires<br />
greater effort than that of filling vacant posts.<br />
116
PROGRESS TOWARDS THE <strong>EFA</strong> GOALS<br />
The quality of education<br />
Figure <strong>2.</strong>44: The rate at which new teaching posts are<br />
created will need to increase if universal primary education<br />
is to be achieved by 2015<br />
Annual growth in teacher posts needed to reach universal primary<br />
education by 2015, selected countries<br />
Benin<br />
Senegal<br />
Guinea<br />
Burundi<br />
Liberia<br />
Congo<br />
Mali<br />
Togo<br />
Viet Nam<br />
Gambia<br />
Palestinian A. T.<br />
U. R. Tanzania<br />
1 Kenya<br />
Comoros<br />
Rwanda<br />
Côte d’Ivoire<br />
Uganda<br />
D. R. Congo<br />
Djibouti<br />
Burkina Faso<br />
Niger<br />
Chad<br />
Eritrea<br />
Afghanistan<br />
Bangladesh<br />
Timor-Leste<br />
Sudan<br />
Malawi<br />
Papua N. Guinea<br />
C. A. R.<br />
Observed growth higher than needed<br />
Observed growth lower than needed<br />
No observed data to compare<br />
Observed 1999-2007<br />
Needed 2007-2015<br />
0 5 10 15 20<br />
Annual growth rates (compound) in teaching staff (%)<br />
Note: Only countries in which <strong>the</strong> current number of teachers must expand by<br />
at least 30% to reach <strong>the</strong> projected number needed to achieve universal primary<br />
education on time are included.<br />
1. Kenya’s observed growth rate between 1999 and 2007 was -0.1% but for<br />
expositional purposes this is not shown here.<br />
Source: UIS (2009e).<br />
The capacity of countries to finance increased<br />
recruitment varies, but for many <strong>the</strong> prospect of<br />
closing <strong>the</strong> gap will hinge partly on aid donors.<br />
A sustained push to recruit teachers will increase<br />
<strong>the</strong> future recurrent costs that governments have<br />
to plan for. For low-income countries with a limited<br />
revenue base, multiyear aid commitments over<br />
five to ten years, backed by predictable delivery,<br />
will be vital to <strong>the</strong> sustainable financing of teacher<br />
recruitment. This will require both an increase<br />
in aid and a radical change in aid management<br />
practices – issues discussed in <strong>Chapter</strong> 4.<br />
Recruitment is just one part of a far wider set<br />
of issues that governments have to address.<br />
In many of <strong>the</strong> world’s poorest countries, <strong>the</strong><br />
problem involves not just low teacher numbers<br />
but also poor teacher morale. Attracting and<br />
retaining well-qualified candidates is increasingly<br />
difficult, as many countries’ high attrition rates<br />
show. Low pay is endemic, a problem that in<br />
many countries not only hinders recruitment<br />
of able candidates but forces many teachers to<br />
supplement <strong>the</strong>ir salaries, thus reducing <strong>the</strong> time<br />
<strong>the</strong>y devote to teaching. In Bangladesh, teachers in<br />
state-aided schools are paid less than US$1 a day,<br />
and two-thirds report undertaking additional<br />
income-earning activities (Financial Management<br />
Reform Programme, 2006).<br />
Teacher salaries are a contentious issue in many<br />
countries. Governments face an obvious dilemma:<br />
how to increase teacher recruitment without<br />
creating unsustainable budget pressures. Some<br />
countries have attempted to address this dilemma<br />
by reducing salary costs, notably by hiring fewer<br />
teachers under standard civil service pay terms<br />
and hiring more contract teachers at lower levels<br />
of remuneration and benefits. Finance ministries<br />
and several aid donors have actively encouraged<br />
more contract employment. The risk is that this<br />
will lead to recruitment of less qualified candidates<br />
and to even more pressure on teachers to<br />
supplement <strong>the</strong>ir incomes through o<strong>the</strong>r forms<br />
of employment, with attendant implications for<br />
morale. There is evidence from West Africa that<br />
increased recourse to contract teachers has<br />
compromised education quality (UNESCO, 2008a).<br />
While a balance has to be struck between<br />
affordability and good teaching, <strong>the</strong> limits<br />
to cost-cutting also have to be recognized.<br />
Governments and donors need to ensure that<br />
teacher pay and conditions reflect a commitment<br />
to delivering good-quality education through<br />
a well-qualified and motivated workforce.<br />
In many of <strong>the</strong><br />
world’s poorest<br />
countries, <strong>the</strong><br />
problem involves<br />
low teacher<br />
numbers or poor<br />
teacher morale<br />
117
0<br />
1<br />
2<br />
0<br />
CHAPTER 2<br />
Education for All Global Monitoring Report<br />
Initial training and professional development<br />
are also crucial to morale and effective teaching.<br />
Teachers are <strong>the</strong> product of <strong>the</strong> education systems<br />
<strong>the</strong>y teach in. Where <strong>the</strong>se systems are of low<br />
quality it is even more important for teachers to<br />
receive effective training and support throughout<br />
<strong>the</strong>ir careers. Teachers need to understand <strong>the</strong><br />
content of <strong>the</strong> curriculum and be able to<br />
communicate it to students of varying ability. In<br />
many countries, initial training is not good enough<br />
to develop <strong>the</strong>se skills. To make matters worse,<br />
many teachers do not even receive initial training.<br />
In Mozambique, one recent evaluation found that<br />
41% of primary school teachers were untrained<br />
(Mulkeen and Chen, 2008). In-service training,<br />
which is vital to build on initial skills, is also<br />
poorly developed in many low-income countries<br />
(Leu, 2004; Lewin and Stuart, 2003).<br />
Conclusion<br />
The ultimate aim of schools is to equip children<br />
with <strong>the</strong> skills and knowledge <strong>the</strong>y need to realize<br />
<strong>the</strong>ir potential, develop secure livelihoods and<br />
participate in society. Evidence presented in this<br />
section suggests that many schools are failing to<br />
meet even minimum standards for <strong>the</strong> quality of<br />
education. Millions of children, especially those<br />
from socially marginalized groups, are completing<br />
<strong>the</strong>ir primary education without having acquired<br />
basic literacy and numeracy skills. At <strong>the</strong> secondary<br />
level, too, many education systems in developing<br />
countries are characterized by low levels of<br />
learning and high levels of inequality. Equipping<br />
schools to provide good quality education will<br />
require governments to focus more strongly on<br />
recruiting and training teachers, supplying<br />
textbooks and developing classroom practices<br />
that promote active learning. Support for literacy<br />
and reading in early grades has an especially<br />
important role to play, as <strong>the</strong>se skills create<br />
<strong>the</strong> foundation for future learning.<br />
118
PROGRESS TOWARDS THE <strong>EFA</strong> GOALS<br />
Estimating <strong>the</strong> cost of achieving Education for All<br />
Estimating <strong>the</strong> cost<br />
of achieving Education<br />
for All<br />
The Dakar Framework for Action includes strong<br />
commitments on education financing. Developing<br />
countries pledged to ‘enhance significantly<br />
investment in basic education’ (para. 8[i]), while rich<br />
nations promised an increase in aid, mainly in <strong>the</strong><br />
form of grants and concessional finance, to ensure<br />
that ‘no countries seriously committed to education<br />
for all will be thwarted in <strong>the</strong>ir achievement of this<br />
goal by a lack of resources’ (para. 10).<br />
Ten years later, finance remains a major barrier<br />
to Education for All. Developing countries have<br />
stepped up <strong>the</strong>ir efforts to make domestic<br />
resources available, albeit on an uneven basis.<br />
Many could do much more to raise <strong>the</strong>ir<br />
investment in education by streng<strong>the</strong>ning revenue<br />
collection and equity in public spending. The<br />
international community has also increased aid<br />
for basic education, but collectively donors have<br />
fallen far short of delivering on <strong>the</strong>ir commitments<br />
made in Dakar.<br />
This section assesses <strong>the</strong> scale of <strong>the</strong> Education<br />
for All financing gap. It sets out <strong>the</strong> results of a<br />
costing exercise covering forty-six low-income<br />
countries. 49 The exercise looks at <strong>the</strong> financing<br />
requirements for achieving a range of <strong>goals</strong> in basic<br />
education and beyond. Among <strong>the</strong> key findings:<br />
The financing gap is far larger than previously<br />
assumed. Even with an increased domestic<br />
resource mobilization effort, low-income<br />
countries face a financing gap of about<br />
US$16 billion for basic education (literacy,<br />
pre-primary and primary education),<br />
representing 1.5% of <strong>the</strong>ir collective GDP. 50<br />
This is a third higher than <strong>the</strong> previous estimate.<br />
Factoring in lower secondary education would<br />
increase <strong>the</strong> gap to US$24 billion.<br />
Low-income countries need to streng<strong>the</strong>n<br />
efficiency and equity in education financing.<br />
There is considerable scope for making more<br />
domestic resources available by improving<br />
revenue collection, giving education a higher<br />
priority and focusing more on basic education.<br />
Increased revenue collection and greater equity<br />
could enhance domestic financing for basic<br />
education by about 0.7% of GDP. This represents<br />
US$7 billion, or two-thirds of current levels of<br />
spending in <strong>the</strong> countries included in <strong>the</strong> study.<br />
Several countries have <strong>the</strong> potential to double<br />
<strong>the</strong> share of GDP allocated to basic education.<br />
Exploiting that potential should be part of <strong>the</strong><br />
Education for All contract between developing<br />
countries and donors.<br />
Aid donors need to undertake a ‘Gleneagles plus’<br />
aid commitment. Aid levels for basic education<br />
in <strong>the</strong> forty-six countries covered need to rise<br />
sixfold from <strong>the</strong>ir current level, from<br />
US$<strong>2.</strong>7 billion to US$16 billion. 51 Even if<br />
donors act on <strong>the</strong> commitments made at<br />
<strong>the</strong> 2005 Group of Eight summit in Gleneagles,<br />
Scotland, and substantially increase aid to<br />
<strong>the</strong> poorest countries, <strong>the</strong> level will still fall<br />
US$11 billion short. An emergency pledging<br />
conference should be convened to mobilize<br />
<strong>the</strong> additional financing required.<br />
Reaching <strong>the</strong> marginalized requires additional<br />
finance. Failure to take into account <strong>the</strong> costs<br />
associated with reaching marginalized groups<br />
has contributed to systematic underestimation<br />
of <strong>the</strong> financing gap. It costs more to extend<br />
education opportunities to <strong>the</strong> most<br />
disadvantaged than it costs to reach better-off<br />
households. The new study estimates that<br />
additional measures to extend primary school<br />
opportunities to social groups facing extreme<br />
and persistent deprivation will cost<br />
US$3.7 billion annually.<br />
The revised Education for All financing gap<br />
points to challenges for both aid recipients and<br />
donors. Developing countries need to increase<br />
<strong>the</strong> level of ambition for public spending in<br />
education at a time when slower economic growth<br />
is putting budgets under pressure. Most major<br />
donors, for <strong>the</strong>ir part, are gripped by recession and<br />
rising fiscal deficits. Some are cutting aid budgets.<br />
O<strong>the</strong>rs are reviewing future commitments. As <strong>the</strong>se<br />
pressures mount, it is important that governments<br />
recognize <strong>the</strong> crucial role of education investments<br />
in creating <strong>the</strong> foundations for recovery and future<br />
poverty reduction efforts.<br />
Part 1 of this section sets out <strong>the</strong> cost estimates<br />
and <strong>the</strong> assumptions behind <strong>the</strong>m. Part 2 presents<br />
<strong>the</strong> findings on <strong>the</strong> Education for All financing gap.<br />
Ten years after<br />
Dakar, finance<br />
remains a major<br />
barrier to<br />
Education for All<br />
49. Full details of <strong>the</strong><br />
methodology and results<br />
of <strong>the</strong> study are available in<br />
(EPDC and UNESCO, 2009).<br />
50. These figures relate to<br />
average financing gaps and<br />
GDP levels in low-income<br />
countries between 2008<br />
and 2015.<br />
51. <strong>Chapter</strong> 4 reports that<br />
annual aid commitments<br />
to basic education averaged<br />
US$4.9 billion in 2006<br />
and 2007 (see Figure 4.7).<br />
The low-income countries<br />
included in this costing<br />
exercise received 55% of<br />
those commitments and<br />
US$<strong>2.</strong>7 billion of total aid to<br />
basic education. <strong>Chapter</strong> 4<br />
shows that low-income<br />
countries received 60% of<br />
all aid to basic education,<br />
but <strong>the</strong> figure includes some<br />
small countries excluded<br />
from <strong>the</strong> costing exercise,<br />
as well as India, which<br />
<strong>the</strong> OECD-DAC defined as<br />
a low-income country at<br />
<strong>the</strong> time of writing.<br />
119
0<br />
1<br />
0<br />
CHAPTER 2<br />
2<br />
Education for All Global Monitoring Report<br />
Countries need<br />
to consider <strong>the</strong><br />
financing<br />
required to reach<br />
those who have<br />
been left behind<br />
5<strong>2.</strong> The financing gap<br />
estimate for <strong>the</strong> literacy<br />
target was half <strong>the</strong><br />
US$2 billion annual<br />
estimate of <strong>the</strong> cost of<br />
literacy programmes in<br />
all developing countries –<br />
a much larger group than<br />
<strong>the</strong> low-income group<br />
used for <strong>the</strong> o<strong>the</strong>r<br />
components of <strong>the</strong><br />
estimate (Van Ravens<br />
and Aggio, 2005). It was<br />
also assumed that <strong>the</strong><br />
financing gap for early<br />
childhood care and<br />
education was similar<br />
to that for literacy.<br />
53. The study covers<br />
forty-six of <strong>the</strong> forty-nine<br />
countries classified by<br />
<strong>the</strong> World Bank as low<br />
income as of April 2009.<br />
The study excludes<br />
Solomon Islands and<br />
Sao Tome and Principe<br />
because <strong>the</strong>ir populations<br />
were below 1 million and<br />
<strong>the</strong> Democratic People’s<br />
Republic of Korea<br />
because of lack of data.<br />
It includes <strong>the</strong> Sudan<br />
because sou<strong>the</strong>rn Sudan<br />
has a separate education<br />
system and can be<br />
considered low income.<br />
Costing <strong>the</strong> commitment<br />
to Education for All <strong>goals</strong><br />
Too often, governments and aid donors have<br />
adopted bold <strong>goals</strong> at international development<br />
summits but failed to put in place <strong>the</strong> financing<br />
measures needed to achieve <strong>the</strong>m. How closely<br />
are <strong>the</strong> Education for All <strong>goals</strong> aligned with<br />
current financing?<br />
Several studies have addressed this question.<br />
In 2003, <strong>the</strong> World Bank carried out a detailed<br />
analysis of <strong>the</strong> financing required to achieve<br />
universal primary education in low-income<br />
countries (Bruns et al., 2003). Basing its estimate<br />
on assumptions about economic growth, revenue<br />
collection, public spending and aid levels, <strong>the</strong> study<br />
put <strong>the</strong> annual financing gap at US$3.6 billion<br />
(constant 2000 prices). The first <strong>EFA</strong> Global<br />
Monitoring Report 2002 adjusted this estimate for<br />
more moderate economic growth, <strong>the</strong> impact of<br />
HIV and AIDS, and <strong>the</strong> inclusion of cash-transfer<br />
programmes targeted at girls and poor<br />
households. These adjustments increased <strong>the</strong><br />
estimated financing gap for universal primary<br />
education to US$5.6 billion (constant 2000 prices).<br />
The <strong>EFA</strong> Global Monitoring Report 2007 updated<br />
this estimate to reflect <strong>the</strong> fact that aid levels<br />
had been lower than expected. Rough estimates<br />
were also made of additional financing for early<br />
childhood care and education, and literacy. 52<br />
These adjustments produced an annual financing<br />
gap estimate in low-income countries of<br />
US$11 billion (constant 2003 prices) – a figure<br />
that has been widely used as a reference point<br />
by <strong>the</strong> international community.<br />
The costing exercise undertaken for this<br />
Report provides a comprehensive review and<br />
reassessment of <strong>the</strong> financing gap (EPDC and<br />
UNESCO, 2009). Using <strong>the</strong> latest available national<br />
data, <strong>the</strong> study updates <strong>the</strong> global estimate for<br />
low-income countries. 53 It covers a wider range of<br />
education <strong>goals</strong> than in <strong>the</strong> 2003 study, recognizing<br />
that Education for All is about more than universal<br />
primary education. Ano<strong>the</strong>r significant departure<br />
is <strong>the</strong> estimation of costs for reaching <strong>the</strong> most<br />
marginalized. Earlier studies assumed <strong>the</strong> cost<br />
of extending education to out-of-school children<br />
was <strong>the</strong> same as <strong>the</strong> average cost of providing<br />
education to those in school, but this assumption<br />
is flawed. Many children in <strong>the</strong> most marginalized<br />
groups live in remote areas and suffer chronic<br />
poverty and extreme gender disadvantage.<br />
Reaching <strong>the</strong>se children requires higher levels<br />
of spending, not just on providing schools and<br />
teachers but also on supporting demand for<br />
education.<br />
There are strong grounds for factoring in <strong>the</strong>se<br />
additional costs. Marginalized children have <strong>the</strong><br />
same right to education as o<strong>the</strong>rs and that right<br />
carries with it a claim on financial resources.<br />
Equity in public spending means governments<br />
must assess what it takes to deliver equivalent<br />
opportunities to children in very different<br />
circumstances. The fact that marginalized children<br />
have benefited less than o<strong>the</strong>rs from past public<br />
spending reinforces <strong>the</strong>ir claim to fairer treatment.<br />
Moreover, failure to consider <strong>the</strong> financing needed<br />
to reach those who have been left behind will<br />
guarantee that many countries miss <strong>the</strong><br />
Education for All targets.<br />
Financing gap estimates cannot be considered<br />
in isolation. The same level of financing in two<br />
different countries can produce widely divergent<br />
results. Countries vary not just in <strong>the</strong>ir individual<br />
cost structures, but also in efficiency and equity<br />
in public spending on education. Some countries<br />
achieve more for less because <strong>the</strong>y have more<br />
efficient procurement systems, school construction<br />
programmes and textbook supply arrangements.<br />
National differences in teacher remuneration,<br />
<strong>the</strong> biggest single item in most education budgets,<br />
can have an enormous bearing on relative cost<br />
structures. The level of equity matters because<br />
it influences <strong>the</strong> degree to which increased public<br />
spending translates into advances for <strong>the</strong> most<br />
marginalized. For all <strong>the</strong>se reasons, average<br />
costs vary widely by country. The marginal costs<br />
associated with reaching disadvantaged groups<br />
are likely to depend on factors such as <strong>the</strong> depth<br />
of poverty and structures of inequality.<br />
The limitations of global costing exercises have to<br />
be recognized. Such exercises can help establish<br />
broad orders of magnitude for <strong>the</strong> financing<br />
required to achieve specified <strong>goals</strong>. But <strong>the</strong>y<br />
cannot substitute for detailed estimates drawn up<br />
at <strong>the</strong> national level. Bottom-up estimates provide<br />
much clearer insights into <strong>the</strong> financing needed to<br />
achieve policy <strong>goals</strong>. It is a matter of concern that,<br />
almost a decade after <strong>the</strong> World Education Forum<br />
in Dakar, governments and donors continue to<br />
address this task in such a fragmented and<br />
haphazard fashion – an issue taken up fur<strong>the</strong>r in<br />
<strong>Chapter</strong> 4. The estimates for <strong>the</strong> Education for All<br />
financing gaps presented in this Report are based<br />
on <strong>the</strong> most recent data available (Box <strong>2.</strong>26).<br />
120
PROGRESS TOWARDS THE <strong>EFA</strong> GOALS<br />
Estimating <strong>the</strong> cost of achieving Education for All<br />
Box <strong>2.</strong>26: Information used for <strong>the</strong> global cost estimates<br />
The study has drawn on <strong>the</strong> most recent cross-country<br />
data in preparing <strong>the</strong> global financing estimates.<br />
Variables covered include <strong>the</strong> size of <strong>the</strong> school age<br />
population, school system structure and capacity,<br />
student progression rates (e.g. promotion, repetition<br />
and dropout rates) and key costs such as those for<br />
teachers, classrooms and textbooks. The three main<br />
sources of data are:<br />
<strong>the</strong> United Nations World Population Prospects<br />
database, for information on school age populations<br />
and projections of population growth;<br />
<strong>the</strong> UNESCO Institute for Statistics, for information<br />
on enrolment, student progression rates, teachers,<br />
classrooms and education financing;<br />
<strong>the</strong> World Bank and International Monetary Fund,<br />
for information on overall government revenue<br />
and economic growth projections.<br />
These were supplemented by over thirty o<strong>the</strong>r<br />
sources, including national education sector reports<br />
and plans, and public expenditure reviews. Information<br />
was also collected directly from UNESCO offices and<br />
o<strong>the</strong>r studies commissioned for <strong>the</strong> costing exercise<br />
(Box <strong>2.</strong>27). In <strong>the</strong> few cases where no national data<br />
were available, regional aggregates were used. There<br />
were often large differences in reported data for a<br />
given country, particularly with respect to education<br />
costs. Every effort was made to use <strong>the</strong> best available<br />
data. However, in some cases <strong>the</strong>re are large margins<br />
of error. Overall, <strong>the</strong> cost estimates should be treated<br />
as indicative of <strong>the</strong> magnitude of financing gaps in<br />
low-income countries.<br />
A detailed outline of <strong>the</strong> methodology, data and<br />
results is available in EPDC and UNESCO (2009).<br />
However, <strong>the</strong>ir indicative and provisional nature<br />
is readily acknowledged.<br />
Estimating <strong>the</strong> financing required to meet <strong>the</strong><br />
Education for All <strong>goals</strong> poses several problems<br />
because <strong>the</strong> <strong>goals</strong> set in Dakar do not all include<br />
quantitative targets. In addition, quantifying<br />
financing gaps means measuring <strong>the</strong> difference<br />
between estimated costs and domestic financing<br />
capacity. Determining <strong>the</strong> latter involves<br />
identifying <strong>the</strong> degree to which low-income<br />
countries can make domestic resources available,<br />
taking into account economic growth prospects<br />
and public spending levels. The following<br />
subsections set out <strong>the</strong> parameters for <strong>the</strong>se<br />
areas.<br />
Identifying <strong>the</strong> targets<br />
In <strong>the</strong> Dakar Framework for Action, governments<br />
made a commitment to achieve universal primary<br />
education by 2015. This is a clear, quantifiable and<br />
measurable goal, though its precise meaning is<br />
open to interpretation. There are also quantifiable<br />
targets for adult literacy. O<strong>the</strong>r <strong>goals</strong> of great<br />
importance lack clear targets. Examples include<br />
<strong>the</strong> injunctions to improve education quality and<br />
ensure access to appropriate learning<br />
programmes for young people and adults. In<br />
some cases, <strong>goals</strong> relating to quality and equity<br />
define important principles but do not establish<br />
clear benchmarks. Targets chosen for this<br />
costing exercise cover four areas (Table <strong>2.</strong>8):<br />
Early childhood care and education. It is widely<br />
recognized that good early childhood education<br />
is important not just in its own right but also as<br />
a way to improve participation and learning<br />
achievement in primary education. Building<br />
on previous work, this exercise adopts a target<br />
of providing free pre-primary education to all<br />
children living below <strong>the</strong> poverty line (Van<br />
Ravens and Aggio, 2007, 2008). This translates<br />
into an average gross enrolment ratio of 52%<br />
by 2015 for countries included in <strong>the</strong> exercise.<br />
Universal primary education. For <strong>the</strong> purposes<br />
of this exercise, it is assumed that all primary<br />
school age children enter school on time and<br />
progress through school with limited repetition<br />
and no dropout, implying a net enrolment ratio<br />
of 100% by 2015. 54<br />
Lower secondary education. The Dakar<br />
Framework does not include targets for<br />
secondary education, but increasing<br />
participation at this level is important. This<br />
Report <strong>the</strong>refore includes a costing exercise<br />
that assumes that all children completing<br />
primary education by 2015 will make <strong>the</strong><br />
transition to lower secondary school, implying<br />
an average gross enrolment ratio of about 88%<br />
by 2015 for countries included in <strong>the</strong> exercise.<br />
Adult literacy. The Dakar target of halving<br />
adult illiteracy will require wide-ranging<br />
interventions. Part of <strong>the</strong> target will be achieved<br />
The costing<br />
exercise provides<br />
a comprehensive<br />
review and<br />
reassessment<br />
of <strong>the</strong> <strong>EFA</strong><br />
financing gap<br />
54. This assumption has <strong>the</strong><br />
effect of understating costs<br />
associated with reaching<br />
over-age children currently<br />
out of primary school.<br />
121
0<br />
1<br />
0<br />
CHAPTER 2<br />
2<br />
Education for All Global Monitoring Report<br />
Reducing <strong>the</strong><br />
cost burden on<br />
households is<br />
a priority for<br />
improving access<br />
Table <strong>2.</strong>8: Targets for <strong>the</strong> global costing exercise<br />
Goal<br />
Early childhood care and<br />
education<br />
Universal primary education<br />
Expansion of lower secondary<br />
schooling<br />
Adult literacy<br />
Gender parity and equality<br />
Education quality<br />
Criteria for achievement<br />
by 2015<br />
Provision of pre-primary schooling for all<br />
children living below <strong>the</strong> poverty line<br />
Provision of school places of good quality<br />
for all children of primary school age<br />
Provision of places in lower secondary school<br />
for all children completing primary school<br />
Provision of sufficient literacy programme<br />
places for illiterate adults to ensure that<br />
illiteracy rates are halved from 1999 levels<br />
Achievement of gender parity in primary<br />
enrolment rates and lower secondary<br />
transition rates, and male and female literacy<br />
rates at or above target levels<br />
Inclusion of a range of quality-enhancing<br />
interventions at each education level<br />
Average for 46 low-income countries<br />
(circa 2007)<br />
Pre-primary gross enrolment ratio = 16%<br />
Primary gross enrolment ratio = 95%<br />
Primary net enrolment ratio = 72%<br />
Primary to secondary transition rate = 69%<br />
Lower secondary gross enrolment ratio = 44%<br />
Adult literacy rate = 59%<br />
—<br />
—<br />
Target<br />
for 2015<br />
52%<br />
108% 1<br />
100%<br />
100%<br />
83%<br />
80%<br />
Full parity<br />
See Table <strong>2.</strong>9<br />
Notes: Targets for early childhood education and adult literacy are country-specific. The targets given in <strong>the</strong> table are unweighted averages for all countries covered.<br />
1. GER targets are country-specific but imply full enrolment of primary school age children with a maximum of 10% repetition.<br />
Box <strong>2.</strong>27: Basic education financing<br />
in <strong>the</strong> Democratic Republic of <strong>the</strong> Congo and <strong>the</strong> Sudan<br />
Estimating education costs for countries affected<br />
by conflict is problematic. In many such countries,<br />
access to <strong>the</strong> type of data required for a<br />
meaningful assessment of need is often lacking.<br />
households, which must cover half of overall<br />
costs in <strong>the</strong> Democratic Republic of <strong>the</strong> Congo<br />
and a third in <strong>the</strong> Sudan. Reducing <strong>the</strong> burden<br />
on households is a priority for improving access.<br />
Innovative work for <strong>the</strong> global costing exercise<br />
set out in this chapter has made it possible<br />
to include several conflict-affected countries.<br />
UNESCO carried out detailed country-level<br />
analysis for <strong>the</strong> Democratic Republic of <strong>the</strong> Congo<br />
and for <strong>the</strong> Sudan, where conflict has seriously<br />
compromised education planning and data<br />
collection. The analysis drew on recent surveys,<br />
including a 2006/2007 education census for <strong>the</strong><br />
Democratic Republic of <strong>the</strong> Congo (<strong>the</strong> first in<br />
twenty years), as well as detailed evidence on<br />
costs from a range of donor, international agency<br />
and national ministry sources.<br />
This research draws attention to several important<br />
concerns. In both countries, <strong>the</strong> collapse of public<br />
financing for education has shifted <strong>the</strong> burden to<br />
The case studies also highlight differences within<br />
each country. In <strong>the</strong> Democratic Republic of <strong>the</strong><br />
Congo, a legacy of weak governance and conflict<br />
stretching back over many years has resulted in<br />
a highly fragmented education system. Conflict<br />
and insecurity in some regions, notably <strong>the</strong> east,<br />
continue to hamper reconstruction prospects.<br />
In <strong>the</strong> Sudan, conflict has led to <strong>the</strong> development<br />
of separate political administrations and parallel<br />
education systems in <strong>the</strong> north and south.<br />
Financing for <strong>the</strong>se systems varies. The best<br />
estimates indicate that <strong>the</strong> north devotes 13%<br />
of government revenue to education, compared<br />
with 6% in sou<strong>the</strong>rn Sudan, leading to large<br />
differences in spending per pupil. Primary school<br />
pupil/teacher ratios are 33:1 in <strong>the</strong> north and 51:1<br />
in <strong>the</strong> south.<br />
Source: Chang et al. (2009).<br />
122
PROGRESS TOWARDS THE <strong>EFA</strong> GOALS<br />
Estimating <strong>the</strong> cost of achieving Education for All<br />
through increased participation and improved<br />
quality of education at <strong>the</strong> primary level, with<br />
literate school leavers driving down illiteracy<br />
rates. The residual element, representing about<br />
42% of <strong>the</strong> necessary decline, is assumed to<br />
occur through adult literacy programmes.<br />
An assumption underpinning <strong>the</strong> estimates<br />
presented in this Report is that education is<br />
provided at <strong>the</strong>se levels without fees. This is<br />
consistent with <strong>the</strong> Dakar Framework for Action.<br />
However, in many countries, particularly those<br />
recently involved in conflict, this would represent<br />
a substantial shift in <strong>the</strong> burden of education<br />
costs from households to <strong>the</strong> state (see Box <strong>2.</strong>27).<br />
Setting targets for <strong>the</strong> cost parameters<br />
The second step in <strong>the</strong> exercise is to develop<br />
targets for key parameters using country-level<br />
information on costs. Recurrent costs per capita<br />
and capital costs in education vary across and<br />
within regions, with significant implications for<br />
global cost estimates. Two factors account for<br />
most of <strong>the</strong> variation. First, differences in average<br />
efficiency associated with prices for important<br />
inputs – such as teacher wages, building materials<br />
and textbooks – inevitably influence cost structures.<br />
Second, countries have different norms and rules<br />
on teacher remuneration, pupil/teacher ratios,<br />
school construction and o<strong>the</strong>r inputs. Table <strong>2.</strong>9<br />
summarizes targets for <strong>the</strong> core cost parameters<br />
used in <strong>the</strong> estimates.<br />
In setting <strong>the</strong> parameters, several difficult<br />
financing questions were considered. Teacher<br />
remuneration is one of <strong>the</strong> most significant and<br />
controversial areas in any costing exercise for<br />
education. This is typically <strong>the</strong> single biggest<br />
component in <strong>the</strong> education budgets of low-income<br />
countries, often accounting for three-quarters of<br />
total spending. It follows that technical efficiency<br />
gains can dramatically reduce costs: adjusting<br />
salaries in sub-Saharan Africa to levels found in<br />
South and West Asia would cut average costs<br />
by 40%. However, <strong>the</strong> issues at stake go<br />
beyond considerations of technical efficiency.<br />
Table <strong>2.</strong>9: 2015 targets for main cost parameters<br />
Cost drivers<br />
Teacher salaries<br />
Sub-Saharan Africa<br />
O<strong>the</strong>r countries<br />
Pupil teacher ratio<br />
Parameters Pre-primary<br />
Primary Lower secondary<br />
Percentage of non-salary costs in recurrent spending<br />
School building and rehabilitation 1<br />
4.5 times GDP per capita<br />
3 times GDP per capita<br />
20<br />
33%<br />
$ 13,500 per classroom<br />
4.5 times GDP per capita<br />
3 times GDP per capita<br />
40<br />
33%<br />
$ 13,500 per classroom<br />
6 times GDP per capita<br />
3.5 times GDP per capita<br />
35<br />
40%<br />
$ 17,000 per classroom<br />
Teacher salaries<br />
are typically <strong>the</strong><br />
single biggest<br />
component in <strong>the</strong><br />
education budgets<br />
of low-income<br />
countries<br />
Share of private enrolment<br />
Maintain current levels<br />
10%<br />
10%<br />
School rehabilitation (% of classroom to be replaced)<br />
Low income countries<br />
Conflict affected countries<br />
25%<br />
50%<br />
25%<br />
50%<br />
25%<br />
50%<br />
Targeted programmes for <strong>the</strong> marginalized<br />
Demand side interventions (e.g. conditional cash transfer<br />
programmes, school feeding programmes)<br />
—<br />
5% of GDP per capita<br />
per marginalized student<br />
7.5% of GDP per capita<br />
per marginalized student<br />
Supply side interventions (e.g. incentives for qualified<br />
teachers to work in remote areas, increased resources<br />
for schools serving marginalized groups)<br />
—<br />
Additional 33% of per<br />
pupil recurrent costs per<br />
marginalized student<br />
Additional 33% of per<br />
pupil recurrent costs per<br />
marginalized student<br />
Effect on per-pupil recurrent costs (constant 2007 US$)<br />
Estimated current unit costs<br />
106<br />
68<br />
119<br />
Per-pupil costs in 2015 with additional policy measures<br />
102<br />
125<br />
162<br />
Notes: Per-pupil costs for 2015 do not include additional costs of demand-side and supply-side interventions for reaching <strong>the</strong> marginalized.<br />
1. Includes maintenance, estimated at 2% of construction cost. Classroom construction and rehabilitation include <strong>the</strong> cost of building school infrastructure<br />
(including latrines, offices, water supply, etc.) and providing access for children with disabilities.<br />
Source: EPDC and UNESCO (2009).<br />
123
0<br />
1<br />
0<br />
CHAPTER 2<br />
2<br />
Education for All Global Monitoring Report<br />
Specific<br />
programmes<br />
targeting highly<br />
marginalized<br />
groups are likely<br />
to have higher<br />
average costs<br />
55. Classroom<br />
construction costs include<br />
additional infrastructure<br />
required for an effective<br />
learning environment,<br />
such as furniture, latrines<br />
and water supply. Unit<br />
costs are based on an<br />
average of low- and<br />
high-cost construction<br />
scenarios in Theunynck<br />
(2009). Unit costs for<br />
lower secondary are<br />
assumed to be 25%<br />
higher.<br />
56. The regional average<br />
also corresponds to<br />
average salary targets in<br />
national education plans<br />
for sub-Saharan Africa<br />
(Bennell, 2009a).<br />
57. For <strong>the</strong> low-income<br />
countries included in <strong>the</strong><br />
costing exercise that are<br />
not in sub-Saharan Africa,<br />
average teacher salaries<br />
are <strong>2.</strong>5 times GDP per<br />
capita in primary school<br />
and 3.0 times in<br />
secondary.<br />
58. The costs of reaching<br />
<strong>the</strong> marginalized are<br />
excluded when non-salary<br />
spending as a proportion<br />
of total recurrent cost<br />
is calculated.<br />
59. The wide range<br />
of policy interventions<br />
needed to address<br />
marginalization are<br />
explored in detail in<br />
<strong>Chapter</strong> 3.<br />
For example, lowering teacher salaries may<br />
cut costs but lead to low morale, making it more<br />
difficult to recruit a workforce with sufficient skills<br />
and forcing teachers to supplement <strong>the</strong>ir pay<br />
with o<strong>the</strong>r work.<br />
Capital cost estimates raise ano<strong>the</strong>r set of<br />
difficulties. By definition, achieving Education<br />
for All requires school infrastructure that is<br />
accessible to all children and of sufficient quality<br />
to ensure safety and provide an appropriate<br />
learning environment. Costs of classroom<br />
construction vary enormously. Reasonablepractice<br />
standards point to a cost of about<br />
US$13,500 per classroom, rising to US$17,000<br />
for lower secondary school. 55 Classrooms<br />
obviously need to be built to accommodate<br />
children currently out of school. But <strong>the</strong><br />
dilapidated state of <strong>the</strong> school infrastructure in<br />
many countries means <strong>the</strong>re is also a need for<br />
extensive investment in rehabilitation. One<br />
recent survey suggests that 30% of classrooms<br />
in low-income sub-Saharan Africa need replacing<br />
(Theunynck, 2009). Conflict-affected countries<br />
face particularly pressing problems. To take<br />
one example, half of Liberia’s classrooms were<br />
destroyed or sustained major damage during<br />
<strong>the</strong> civil war (Liberia Ministry of Education, 2007b).<br />
The parameters set for this Report’s costing<br />
exercise are derived from international evidence<br />
on norms and current practice in key areas.<br />
They include <strong>the</strong> following:<br />
Teacher salaries. Individual countries have to<br />
address issues of efficiency, norms and standards<br />
for teachers in <strong>the</strong> light of national circumstances.<br />
The costing exercise does not prejudge <strong>the</strong><br />
appropriate teacher salary level. Instead, it takes<br />
<strong>the</strong> current regional average for primary and lower<br />
secondary salaries in sub-Saharan Africa as a longterm<br />
target that all countries in <strong>the</strong> region will<br />
converge on. 56 For countries outside sub-Saharan<br />
Africa, <strong>the</strong> benchmark is lower (see Table <strong>2.</strong>9). 57<br />
Rules and norms. While <strong>the</strong>re is some debate about<br />
optimal pupil/teacher ratios, here <strong>the</strong> bar is set at<br />
40:1 for primary school, reflecting <strong>the</strong> target used in<br />
previous costing exercises. Effective teaching also<br />
requires access to stationery, textbooks and o<strong>the</strong>r<br />
learning equipment. Ensuring that one-third of <strong>the</strong><br />
recurrent budget is directed <strong>towards</strong> non-salary<br />
costs (rising to 40% for lower secondary education)<br />
should enable most low-income countries to meet<br />
basic needs in this respect. 58<br />
Wider capital costs. As well as covering <strong>the</strong> cost<br />
of future enrolment, budgets have to absorb <strong>the</strong><br />
cost of replenishing infrastructure. A conservative<br />
estimate is that about a quarter of <strong>the</strong> classrooms<br />
in low-income countries need replacing, rising<br />
to half in conflict-affected countries. As with<br />
<strong>the</strong> o<strong>the</strong>r targets, it is assumed that all this<br />
replacement takes place by 2015.<br />
Cost of adult literacy programmes. In line with<br />
previous studies, <strong>the</strong> unit cost of adult literacy<br />
programmes is estimated at 8.9% of GDP per<br />
capita for countries in sub-Saharan Africa and<br />
5.3% for all o<strong>the</strong>r countries (Van Ravens and<br />
Aggio, 2005, 2007).<br />
Reaching <strong>the</strong> marginalized<br />
Previous global cost estimates for education<br />
have assumed that <strong>the</strong> average cost of reaching<br />
out-of-school children is roughly equivalent to<br />
a national average benchmark. That assumption<br />
is misplaced. Specific programmes targeting highly<br />
marginalized groups including child labourers,<br />
<strong>the</strong> extreme poor, ethnic minorities, girls, children<br />
with disabilities, and locations such as remote<br />
rural areas and slums have to be financed.<br />
Moreover, extending education programmes<br />
to <strong>the</strong>se groups and areas is likely to raise per<br />
capita spending requirements.<br />
Top-down estimates are a particularly blunt tool<br />
for assessing <strong>the</strong> financing required to reach <strong>the</strong><br />
marginalized. Policy-makers need to consider <strong>the</strong><br />
interlocking constraints that keep marginalized<br />
children out of school or that disrupt <strong>the</strong>ir<br />
participation and limit <strong>the</strong>ir learning achievements<br />
(see <strong>Chapter</strong> 3). Detailed poverty assessments<br />
and planning processes that draw on <strong>the</strong> evidence<br />
and perspectives provided by <strong>the</strong> marginalized<br />
<strong>the</strong>mselves are critical to policy design.<br />
With this caveat in mind, international evidence<br />
yields some useful insights. Cash transfer<br />
programmes that provide social protection can<br />
play an important role in insulating vulnerable<br />
households from external shocks, enabling <strong>the</strong>m<br />
to keep children in school. In some contexts, such<br />
programmes have played a particularly crucial<br />
role in allowing girls to enter and stay in school.<br />
Under <strong>the</strong> right circumstances, school feeding<br />
programmes can also provide strong incentives<br />
for children to attend school (as well as crucial<br />
health benefits). Effective programmes of this<br />
kind typically cost about 5% of GDP per capita<br />
(Bundy et al., 2009a; Fiszbein et al., 2009a) 59 .<br />
124
PROGRESS TOWARDS THE <strong>EFA</strong> GOALS<br />
Estimating <strong>the</strong> cost of achieving Education for All<br />
International evidence on <strong>the</strong> incremental costs<br />
that might be associated with creating a highquality<br />
learning environment is more fragmented<br />
and inconsistent (Chanamuto, 2009). Getting<br />
teachers to schools in remote rural areas, slums<br />
and o<strong>the</strong>r marginalized environments requires<br />
incentives, but on what scale? Providing<br />
schooling to children whose lives have been<br />
blighted by poverty, hunger, stigmatization and<br />
low expectations is likely to require<br />
supplementary teaching and additional teaching<br />
materials, but <strong>the</strong>re is no established benchmark<br />
for estimating <strong>the</strong> additional financing required.<br />
For <strong>the</strong> purposes of <strong>the</strong> costing exercise,<br />
three criteria are used to introduce equity-based<br />
finance:<br />
Assessing <strong>the</strong> size of <strong>the</strong> school age population<br />
requiring additional support. Drawing on a new<br />
statistical source – <strong>the</strong> Deprivation and<br />
Marginalization in Education (DME) data set<br />
introduced in <strong>Chapter</strong> 3 – <strong>the</strong> Report establishes,<br />
for each country, <strong>the</strong> share of <strong>the</strong> population<br />
aged 17 to 22 with fewer than four years in<br />
school. This is used as a proxy indicator for <strong>the</strong><br />
proportion of <strong>the</strong> school age population that is<br />
marginalized and in need of additional incentives<br />
and school resources to participate in basic<br />
education. There are obvious limitations to this<br />
measure, including <strong>the</strong> fact that it captures past<br />
outcomes ra<strong>the</strong>r than <strong>the</strong> current situation.<br />
However, <strong>the</strong> four-year benchmark is a useful<br />
measurement of <strong>the</strong> scale of marginalization.<br />
<strong>Chapter</strong> 3 explores <strong>the</strong> use of this measure<br />
of marginalization in greater detail.<br />
Table <strong>2.</strong>10: Costs of achieving Education for All in low-income countries<br />
US$ billions (constant 2007 prices)<br />
Current domestic resources (circa 2007)<br />
Cumulative cost (2008-2015)<br />
Average annual cost (2008-2015)<br />
Pre-primary<br />
Primary<br />
Providing incentives for marginalized children.<br />
The costing exercise includes financial provision<br />
for incentives aimed at marginalized groups.<br />
It assumes a cost per child of 5% of GDP per capita<br />
for primary school students and 7.5% for lower<br />
secondary school students.<br />
Creating an incremental financing coefficient.<br />
There are no ready-made standards that can be<br />
applied on a cross-country basis. For <strong>the</strong> purposes<br />
of <strong>the</strong> costing exercise, <strong>the</strong> cost parameter for<br />
reaching <strong>the</strong> marginalized is set at an increment of<br />
33% above average recurrent costs. This is broadly<br />
consistent with <strong>the</strong> sparse evidence available on<br />
<strong>the</strong> cost of financing teacher incentives and o<strong>the</strong>r<br />
measures to bring good-quality education to<br />
marginalized children (Chen and Mulkeen, 2008;<br />
Mulkeen, 2009a).<br />
The global cost<br />
The aggregate costs that emerge from <strong>the</strong> analysis<br />
are anchored in national data for <strong>the</strong> forty-six<br />
low-income countries covered. 60 For each of<br />
<strong>the</strong> Education for All targets selected, <strong>the</strong> norms<br />
for education inputs are applied to <strong>the</strong> size of <strong>the</strong><br />
population that has to be reached in each country.<br />
This makes it possible to identify <strong>the</strong> number of<br />
teachers, additional classrooms and teaching<br />
materials required. The cost parameters for<br />
<strong>the</strong>se inputs are <strong>the</strong>n applied, with adjustments<br />
for reaching <strong>the</strong> marginalized. Table <strong>2.</strong>10 shows<br />
<strong>the</strong> resulting cost projections. To summarize:<br />
Cumulative costs over 2008–2015 for <strong>the</strong><br />
basic education <strong>goals</strong> run to US$286 billion,<br />
or US$36 billion annually (in constant 2007 US$).<br />
Current spending on basic education is about<br />
Adult<br />
literacy*<br />
Basic education<br />
sub-total<br />
Lower<br />
secondary<br />
Total<br />
0.8 11.1 – 11.9 4.7 16.6<br />
60.4 220.4 5.1 285.9 120.2 406.1<br />
7.5 27.5 0.6 35.7 15.0 50.7<br />
The financing<br />
required to<br />
achieve <strong>the</strong> basic<br />
education <strong>goals</strong> is<br />
more than double<br />
current levels<br />
of spending<br />
Breakdown of costs between 2008-2015 (%)<br />
Teachers<br />
Classroom construction<br />
Programmes to reach <strong>the</strong> marginalized<br />
O<strong>the</strong>r<br />
39 40 – 40 36 39<br />
41 27 – 30 30 30<br />
– 14 – 11 12 11<br />
20 20 – 20 22 21<br />
Notes: Breakdown of costs for basic education subtotal relates only to pre-primary and universal primary education. Subtotals are based on non-rounded figures.<br />
* The estimated adult literacy costs for <strong>the</strong> low-income countries covered are about three times <strong>the</strong> costs estimated in <strong>the</strong> original study (see Van Ravens and Aggio, 2005).<br />
Source: EPDC and UNESCO (2009).<br />
60. The base year is 2007<br />
and estimates are based on<br />
<strong>the</strong> 2008–2015 period unless<br />
o<strong>the</strong>rwise indicated.<br />
125
1<br />
2<br />
0<br />
0<br />
CHAPTER 2<br />
Education for All Global Monitoring Report<br />
An estimated<br />
6.2 million<br />
additional<br />
classrooms will<br />
be needed<br />
in primary and<br />
pre-primary<br />
education<br />
61. This figure is reached<br />
by multiplying <strong>the</strong><br />
additional teachers<br />
needed from 2008 to 2015<br />
by <strong>the</strong> target teacher<br />
salaries shown in<br />
Table <strong>2.</strong>9.<br />
US$12 billion a year. In o<strong>the</strong>r words, <strong>the</strong><br />
financing required to achieve <strong>the</strong> basic<br />
education <strong>goals</strong> is three times <strong>the</strong> current level.<br />
Some US$3.7 billion, or 14% of annual spending<br />
on primary education, is required to finance<br />
programmes and interventions aimed at<br />
reaching <strong>the</strong> marginalized at <strong>the</strong> primary level.<br />
Additional teacher costs account for 40%<br />
of <strong>the</strong> required spending for basic education,<br />
with classroom construction adding just<br />
under one-third.<br />
Factoring in lower secondary education raises<br />
<strong>the</strong> average annual cost by US$16 billion.<br />
Figure <strong>2.</strong>45: Spending on teachers has to rise<br />
% increase required from 2007 in spending on primary school<br />
teachers to achieve universal primary education by 2015<br />
Sierra Leone<br />
Lao PDR<br />
Togo<br />
Madagascar<br />
Kenya<br />
Tajikistan<br />
Senegal<br />
D. R. Congo<br />
Mauritania<br />
Burkina Faso<br />
Niger<br />
Côte d’Ivoire<br />
Ghana<br />
Ethiopia<br />
Zambia<br />
Mali<br />
Mozambique<br />
Benin<br />
North Sudan<br />
U. R. Tanzania<br />
Uganda<br />
Bangladesh<br />
Rwanda<br />
Burundi<br />
Cambodia<br />
Nigeria<br />
Chad<br />
Pakistan<br />
Haiti<br />
Liberia<br />
South Sudan<br />
Gambia<br />
Guinea<br />
Somalia<br />
Eritrea<br />
C. A. R.<br />
Malawi<br />
Afghanistan<br />
Guinea-Bissau<br />
0 100 200 300 400 500 600 700 800<br />
Human resources figure prominently in <strong>the</strong> cost<br />
estimates (Table <strong>2.</strong>10). Collectively, <strong>the</strong> countries<br />
covered in <strong>the</strong> exercise have to recruit 3.2 million<br />
more primary and pre-primary teachers to<br />
achieve <strong>the</strong> basic education <strong>goals</strong>. At <strong>the</strong> primary<br />
level, <strong>the</strong> global cost of financing recruitment<br />
on this scale is some US$9.1 billion annually. 61<br />
Translated into current national budget terms,<br />
this implies a significant increase in spending.<br />
Ten countries need to more than double spending<br />
on primary teacher salaries and thirteen countries<br />
more than triple spending, from 2007 levels<br />
(Figure <strong>2.</strong>45).<br />
Overcoming school infrastructure deficits<br />
will require large increases in investment.<br />
An estimated 6.2 million additional classrooms<br />
will be needed in primary and pre-primary<br />
education to accommodate <strong>the</strong> increase in<br />
enrolment required to achieve <strong>the</strong> targets set. 62<br />
Current rates of construction fall far below<br />
<strong>the</strong> level required in most countries. In Burundi,<br />
Rwanda and Uganda, recent rates of classroom<br />
construction are less than 15% of <strong>the</strong> rate<br />
required to achieve universal primary education<br />
(Figure <strong>2.</strong>46). The estimated aggregate costs<br />
of expansion are highest in countries with <strong>the</strong><br />
biggest out-of-school populations. However,<br />
a large group of countries will have to increase<br />
spending on classroom construction and<br />
rehabilitation far above current levels to bring<br />
<strong>the</strong> Education for All targets within reach.<br />
Figure <strong>2.</strong>46: Many countries need more classrooms<br />
Current classroom construction as % of required rate of construction<br />
necessary to achieve universal primary education by 2015<br />
Mauritania<br />
Madagascar<br />
Guinea<br />
Burkina Faso<br />
Chad<br />
Malawi<br />
Rwanda<br />
Uganda<br />
Burundi<br />
Rwanda is currently<br />
constructing only 13% of <strong>the</strong><br />
required classrooms annually<br />
needed to achieve UPE by 2015.<br />
0 20 40 60 80 100<br />
Current annual classroom construction as a percentage<br />
of annual construction requirement<br />
6<strong>2.</strong> This includes new<br />
classrooms to achieve<br />
targeted pupil/classroom<br />
ratios and <strong>the</strong><br />
replacement of old<br />
classroom stock.<br />
Increase in spending required (%)<br />
Note: Excludes countries that do not require increases in spending on primary<br />
school teachers to achieve universal primary education.<br />
Source: EPDC and UNESCO (2009).<br />
Notes: Estimated classroom needs for universal primary education include replacing<br />
old classrooms (<strong>the</strong> assumption is that classrooms have a forty-year life span) and<br />
rebuilding existing stock. The period covered by figures for actual annual growth in<br />
classroom stock varies by country. See Table 1.1 in Theunynck (2009) for details.<br />
Sources: EPDC and UNESCO (2009); Theunynck (2009).<br />
126
PROGRESS TOWARDS THE <strong>EFA</strong> GOALS<br />
Estimating <strong>the</strong> cost of achieving Education for All<br />
Estimating <strong>the</strong> financing gap —<br />
and measures to close it<br />
The cost of achieving <strong>the</strong> internationally agreed<br />
Education for All <strong>goals</strong> has to be assessed against<br />
<strong>the</strong> financing available. National budgets are <strong>the</strong><br />
primary source of education financing. As <strong>the</strong><br />
Expanded Commentary on <strong>the</strong> Dakar Framework<br />
for Action recognized, developing countries will<br />
have to do far more to make resources available<br />
by ‘increasing <strong>the</strong> share of national income and<br />
budgets allocated to education and, within that,<br />
to basic education’ (para. 46). Over and above<br />
<strong>the</strong>se broad commitments, action is needed to<br />
streng<strong>the</strong>n <strong>the</strong> efficiency and equity of education<br />
spending, and to curb <strong>the</strong> diversion of resources<br />
associated with corruption.<br />
Most of <strong>the</strong> countries covered in <strong>the</strong> costing<br />
analysis have <strong>the</strong> capacity to increase domestic<br />
spending on basic education. Increased<br />
government revenue, stronger budget commitment<br />
and redistribution within <strong>the</strong> education budget all<br />
have a role to play. But even with a stronger<br />
domestic effort, many countries will be unable to<br />
finance all <strong>the</strong> investment required. The analysis<br />
for this Report estimates <strong>the</strong> Education for All<br />
financing gap as <strong>the</strong> difference between <strong>the</strong> total<br />
investment requirement indicated by <strong>the</strong> costing<br />
exercise and <strong>the</strong> domestic financing capacity of<br />
governments making a ‘best effort’ to channel<br />
resources to education.<br />
National governments can raise a substantial<br />
share of <strong>the</strong> additional resources needed<br />
Alongside national income, <strong>the</strong> domestic resource<br />
envelope available for public financing of <strong>the</strong><br />
Education for All <strong>goals</strong> is ultimately determined<br />
by three factors. The first is <strong>the</strong> share of national<br />
income collected as government revenue. That<br />
share rises on average with <strong>the</strong> level of per capita<br />
income, albeit with large variations by country that<br />
reflect policies on taxation, <strong>the</strong> level of natural<br />
resource exports and o<strong>the</strong>r national characteristics.<br />
The second factor is <strong>the</strong> proportion of revenue<br />
directed into <strong>the</strong> overall education budget. The third<br />
is <strong>the</strong> share of <strong>the</strong> education budget allocated to<br />
basic education. The proportion of national income<br />
directed <strong>towards</strong> basic education provides a<br />
summary overview of <strong>the</strong> level of public basic<br />
education financing.<br />
Figure <strong>2.</strong>47 presents <strong>the</strong> country-by-country<br />
picture. It shows <strong>the</strong> gap between current levels<br />
of spending on basic education and <strong>the</strong> levels<br />
Figure <strong>2.</strong>47: Current national spending falls short of <strong>the</strong> levels needed to achieve<br />
basic education <strong>goals</strong><br />
Current and required spending on basic education as a share of GDP<br />
Nor<strong>the</strong>rn Sudan<br />
Papua New Guinea<br />
Yemen<br />
Kyrgyzstan<br />
Tajikistan<br />
Mauritania<br />
Lao PDR<br />
Myanmar<br />
Sou<strong>the</strong>rn Sudan<br />
Pakistan<br />
Cambodia<br />
Kenya<br />
Nepal<br />
Ghana<br />
Bangladesh<br />
Haiti<br />
Côte d’Ivoire<br />
Senegal<br />
Low income country average<br />
Benin<br />
Nigeria<br />
Zambia<br />
Guinea<br />
Togo<br />
Madagascar<br />
U. R. Tanzania<br />
Rwanda<br />
Afghanistan<br />
Gambia<br />
Sierra Leone<br />
Mali<br />
Niger<br />
Mozambique<br />
Uganda<br />
Chad<br />
Eritrea<br />
Burkina Faso<br />
Ethiopia<br />
C. A. R.<br />
Zimbabwe<br />
Liberia<br />
Somalia<br />
Guinea-Bissau<br />
D. R. Congo<br />
Malawi<br />
Burundi<br />
0 2 4 6 8 10 12 14 16 18 20<br />
Basic education spending as % of GDP<br />
required to achieve <strong>the</strong> <strong>goals</strong> set in this Report’s<br />
costing exercise. On average, <strong>the</strong> forty-six countries<br />
need to increase public spending on basic<br />
education by <strong>2.</strong>5% of GDP to meet Education for All<br />
<strong>goals</strong>. 63 However, <strong>the</strong>re are very large variations<br />
around this average.<br />
To what extent can low-income countries<br />
increase spending on basic education from<br />
<strong>the</strong>ir own resources? Any attempt to address<br />
that question is highly sensitive to assumptions<br />
2007 estimated spending<br />
on basic education<br />
Estimated additional<br />
spending required for<br />
basic education in 2015<br />
Notes: Spending in 2007 is an estimate of domestic spending on education and excludes grants.<br />
Nor<strong>the</strong>rn and sou<strong>the</strong>rn Sudan are included separately in <strong>the</strong> costing study because of <strong>the</strong>ir separate<br />
education systems (see Box <strong>2.</strong>27). Excludes Uzbekistan and Viet Nam which are projected not to require<br />
additional spending on basic education.<br />
Source: EPDC and UNESCO (2009).<br />
63. This is an average<br />
figure weighted by <strong>the</strong> size<br />
of low-income countries<br />
in terms of <strong>the</strong>ir GDP.<br />
127
0<br />
0<br />
1<br />
CHAPTER 2<br />
2<br />
Education for All Global Monitoring Report<br />
Many countries<br />
can mobilize<br />
additional<br />
resources for<br />
basic education<br />
about economic growth, revenue collection<br />
and public spending patterns. For this analysis,<br />
a ‘best effort’ benchmark was established to<br />
assess national financing capacity. Factoring in<br />
projected economic growth, 64 a significant source<br />
of extra revenue, it is possible to estimate <strong>the</strong><br />
additional resources that can be generated by<br />
2015 if <strong>the</strong> countries covered (a) increase <strong>the</strong><br />
average share of government revenue in GDP to<br />
at least 17%; (b) raise <strong>the</strong> share of revenue going<br />
to education to at least 20%; and (c) ensure that<br />
about 70% of <strong>the</strong> education budget is devoted<br />
to pre-primary, primary and lower secondary. 65<br />
Where countries are already exceeding <strong>the</strong>se<br />
thresholds, it is assumed that current values<br />
are maintained up to 2015.<br />
Applying <strong>the</strong>se thresholds points to <strong>the</strong> scope<br />
for a far stronger level of national effort. If every<br />
country covered in <strong>the</strong> study reached each<br />
threshold, it would expand <strong>the</strong> financial resource<br />
envelope for basic education on average by<br />
about 0.9 percentage points of GDP by 2015.<br />
Put differently, it would provide slightly more<br />
Figure <strong>2.</strong>48: Many countries can mobilize additional domestic resources for basic education<br />
Current and additional resources countries devote to basic education as a share of GDP<br />
4.5<br />
than a third of <strong>the</strong> additional resources required<br />
to achieve <strong>the</strong> basic education <strong>goals</strong> by 2015.<br />
Increasing scope for additional domestic resource mobilization<br />
The aggregate picture inevitably obscures<br />
significant differences between countries<br />
(Figure <strong>2.</strong>48). Some, such as Benin and<br />
Mozambique, are close to <strong>the</strong> ‘best effort’<br />
thresholds in all target areas. By contrast,<br />
Chad combines high levels of revenue-raising<br />
with low levels of financial commitment to<br />
education. Nigeria raises 34% of national income<br />
in government revenue, but has one of <strong>the</strong> lowest<br />
levels of commitment to primary education among<br />
<strong>the</strong> forty-six countries covered. Pakistan performs<br />
poorly on all three counts: government revenue<br />
represents a small share of national income, <strong>the</strong><br />
share of revenue spent on basic education is<br />
among <strong>the</strong> lowest for any of <strong>the</strong>se low-income<br />
countries and <strong>the</strong> share spent on primary<br />
education is <strong>the</strong> very lowest in <strong>the</strong> group. The<br />
country has <strong>the</strong> potential to more than triple<br />
<strong>the</strong> share of GDP currently allocated to basic<br />
education, suggesting that successive<br />
governments have failed to address <strong>the</strong> education<br />
4.0<br />
3.5<br />
Additional resources mobilized in 2015 if thresholds met<br />
2007 estimated resources for basic education<br />
Basic education spending as % of GDP<br />
3.0<br />
<strong>2.</strong>5<br />
<strong>2.</strong>0<br />
1.5<br />
1.0<br />
0.5<br />
64. Resource projections<br />
use <strong>the</strong> latest IMF<br />
economic growth<br />
forecasts (IMF, 2009f).<br />
65. Targets for <strong>the</strong> exact<br />
share of <strong>the</strong> budget<br />
devoted to Education for<br />
All depend on <strong>the</strong> length<br />
of primary and lower<br />
secondary cycles. See<br />
EPDC and UNESCO (2009)<br />
for details. Economic<br />
growth projections are<br />
taken from <strong>the</strong> April 2009<br />
IMF forecast (IMF, 2009f).<br />
0.0<br />
North Sudan<br />
South Sudan<br />
Guinea<br />
Mali<br />
Kenya<br />
Benin<br />
Mozambique<br />
Senegal<br />
Burundi<br />
Zambia<br />
Papua New Guinea<br />
Malawi<br />
Somalia<br />
Lao PDR<br />
Rwanda<br />
Côte d’Ivoire<br />
Madagascar<br />
U. R. Tanzania<br />
Tajikistan<br />
Haiti<br />
Nepal<br />
Liberia<br />
Yemen<br />
Viet Nam<br />
Low income country average<br />
Sierra Leone<br />
Mauritania<br />
Uganda<br />
Ghana<br />
Togo<br />
Guinea-Bissau<br />
Kyrgyzstan<br />
C. A. R.<br />
Nigeria<br />
Burkina Faso<br />
Ethiopia<br />
D. R. Congo<br />
Zimbabwe<br />
Cambodia<br />
Chad<br />
Myanmar<br />
Bangladesh<br />
Gambia<br />
Afghanistan<br />
Pakistan<br />
Eritrea<br />
Note: Excludes countries where <strong>the</strong> thresholds are already exceeded.<br />
Source: EPDC and UNESCO (2009).<br />
128
PROGRESS TOWARDS THE <strong>EFA</strong> GOALS<br />
Estimating <strong>the</strong> cost of achieving Education for All<br />
financing challenge with sufficient urgency.<br />
In <strong>the</strong> cases of Chad and Nigeria, <strong>the</strong> problem<br />
is less one of revenue mobilization than <strong>the</strong> low<br />
priority attached to education in general and<br />
basic education in particular.<br />
It should be emphasized that <strong>the</strong> ‘best effort’<br />
thresholds used are an imperfect guide to public<br />
policy. Revenue-raising capacity partly depends<br />
on export structures. Countries with large<br />
mineral assets may be better placed than o<strong>the</strong>rs<br />
to increase revenue collection. For countries<br />
emerging from conflict, such as Nepal and Sierra<br />
Leone, increasing <strong>the</strong> share of national income<br />
collected in revenue may be a slow process<br />
involving <strong>the</strong> restoration of credible public<br />
institutions and confidence in government. The<br />
estimates here should <strong>the</strong>refore be treated as an<br />
evaluation of what is possible under reasonable<br />
conditions, not as a full assessment of what each<br />
country can achieve in practice. With <strong>the</strong> data<br />
available, it is difficult to generate precise<br />
Education for All financing estimates for<br />
countries such as Afghanistan, Liberia and<br />
Sierra Leone, but <strong>the</strong>re are strong grounds for<br />
recognizing, as most aid donors have done, <strong>the</strong><br />
urgent need for a large up-front increase in<br />
education finance, given <strong>the</strong> limited capacity of<br />
<strong>the</strong>se countries’ governments to raise that finance.<br />
Donors need to increase aid<br />
to close <strong>the</strong> remaining gap<br />
Successive issues of <strong>the</strong> <strong>EFA</strong> Global Monitoring<br />
Report have drawn <strong>the</strong> attention of <strong>the</strong> donor<br />
community to <strong>the</strong> gap between aid levels and <strong>the</strong><br />
level of financing required to meet <strong>the</strong> Dakar<br />
targets. The revised global cost estimate suggests<br />
<strong>the</strong> gap is far larger than previously assumed. Any<br />
prospect of accelerated progress <strong>towards</strong> <strong>the</strong> 2015<br />
targets hinges critically on a scaled-up donor<br />
effort. The bottom-line message to emerge from<br />
<strong>the</strong> costing exercise is that two-thirds of <strong>the</strong><br />
additional resources required will have to be<br />
provided through aid.<br />
The residual aid component of <strong>the</strong> Education for All<br />
financing requirement can be extrapolated from<br />
<strong>the</strong> costing exercise. Figure <strong>2.</strong>49 summarizes <strong>the</strong><br />
financing gap that remains once prospects for<br />
additional domestic resources have been<br />
exhausted. Table <strong>2.</strong>11 provides an approximate<br />
breakdown of this financing deficit by education<br />
Figure <strong>2.</strong>49: Financing gaps are large and unlikely to be eliminated by current donor pledges<br />
Breakdown of annual resource needs to achieve basic education <strong>goals</strong><br />
40<br />
Constant 2007 US$ billions<br />
35<br />
30<br />
25<br />
20<br />
15<br />
Average annual<br />
resources needed<br />
to finance <strong>EFA</strong><br />
(2008-2015)<br />
US$36 billion<br />
Financing gap<br />
US$16 billion<br />
US$4 billion<br />
US$3 billion<br />
Additional resources<br />
from domestic prioritization<br />
Additional domestic resources<br />
from economic growth<br />
Financing gap<br />
Current aid to basic<br />
education (2006-2007)<br />
US$3 billion<br />
Additional aid to basic<br />
education if Gleneagles<br />
US$2 billion<br />
Remaining<br />
commitments met<br />
shortfall<br />
US$11 billion<br />
The financing<br />
gap for basic<br />
education<br />
is around<br />
US$16 billion<br />
annually<br />
10<br />
5<br />
Current<br />
estimated<br />
resources<br />
US$12 billion<br />
0<br />
Notes: Breakdown of annual resource needs does not add up to <strong>the</strong> total due to rounding. The percentage increase in aid<br />
between 2005 and 2010 associated with <strong>the</strong> Gleneagles targets (see <strong>Chapter</strong> 4) are usual to project 2005 basic education commitments<br />
to 2010 for each country covered.<br />
Sources: EPDC and UNESCO (2009); OECD-DAC (2009d).<br />
129
0<br />
1<br />
0<br />
CHAPTER 2<br />
2<br />
Education for All Global Monitoring Report<br />
Sub-Saharan<br />
Africa accounts<br />
for about<br />
two-thirds of <strong>the</strong><br />
financing gap,<br />
or US$10.3 billion<br />
66. This is calculated<br />
by dividing <strong>the</strong> average<br />
financing gap by <strong>the</strong><br />
average projected GDP<br />
of all countries included<br />
in <strong>the</strong> costing exercise<br />
from 2008 to 2015.<br />
Table <strong>2.</strong>11: Average annual financing gaps in low-income countries, 2008–2015<br />
Education level<br />
Pre-primary<br />
Universal primary education<br />
Adult literacy<br />
Basic education financing gap<br />
Lower secondary<br />
Total financing gap<br />
sector and region. The deficit that will have to<br />
be covered by increased development assistance<br />
is projected to widen to 2015 before narrowing as<br />
<strong>the</strong> domestic resource base expands and <strong>the</strong><br />
need for additional capital spending declines.<br />
Results of <strong>the</strong> analysis include <strong>the</strong> following:<br />
Estimates of <strong>the</strong> financing gap for basic<br />
education are about 30% higher than <strong>the</strong><br />
previous global estimates.<br />
Assuming that all low-income countries reach<br />
<strong>the</strong> ‘best effort’ thresholds by 2015, <strong>the</strong><br />
aggregate average annual financing gap in basic<br />
education for <strong>the</strong> low-income countries covered<br />
is equivalent to about 1.5% of <strong>the</strong>ir collective<br />
GDP. 66 The cumulative deficit for basic education,<br />
calculated on a country-by-country basis, is<br />
around US$16 billion annually from 2008 to 2015.<br />
Current aid levels cover only a small part of<br />
<strong>the</strong> Education for All financing deficit. For <strong>the</strong><br />
low-income countries included in this exercise,<br />
development assistance for basic education<br />
amounts to US$<strong>2.</strong>7 billion (Figure <strong>2.</strong>49). 67<br />
A sixfold increase in aid to basic education<br />
will <strong>the</strong>refore be required if <strong>the</strong> basic education<br />
<strong>goals</strong> are to be achieved.<br />
Financing gap Sub-Saharan Africa South Asia<br />
Conflict-affected<br />
countries<br />
(constant 2007<br />
US$ billions) (%) (%) (%)<br />
5.8 74 23 29<br />
9.8 68 28 48<br />
0.6 42 37 51<br />
16.2 69 27 42<br />
7.9 57 37 43<br />
24.1 65 30 43<br />
Note: The financing gap is <strong>the</strong> difference between <strong>the</strong> total investment requirement indicated by <strong>the</strong> costing exercise and levels of domestic financing associated<br />
with all countries reaching ‘best effort’ thresholds by 2015.<br />
Source: EPDC and UNESCO (2009).<br />
Sub-Saharan Africa accounts for about 69%<br />
of <strong>the</strong> financing gap, or US$10.3 billion.<br />
Low-income countries affected by conflict<br />
account for 42% of <strong>the</strong> gap, or US$6.4 billion.<br />
Adding <strong>the</strong> costs of lower secondary education<br />
increases <strong>the</strong> gap to US$24 billion – a figure that<br />
illustrates <strong>the</strong> enormous increase in resources<br />
required if countries are to universalize access.<br />
However, without addressing <strong>the</strong> financing gaps<br />
at <strong>the</strong> basic education level and building strong<br />
learning foundations, increased investment in<br />
post-primary education is unlikely to be equitable<br />
or to lead to <strong>the</strong> skills improvement that<br />
governments and parents demand.<br />
The global costing exercise raises important<br />
questions for <strong>the</strong> international community. With<br />
just five years remaining to <strong>the</strong> target date for <strong>the</strong><br />
Education for All <strong>goals</strong> and <strong>the</strong> wider Millennium<br />
Development Goals, <strong>the</strong> United Nations Secretary-<br />
General has called on donors to act on <strong>the</strong>ir<br />
2005 commitments, made at Gleneagles to<br />
substantially increase aid by 2010. Such a move<br />
would clearly help narrow <strong>the</strong> education financing<br />
gap, but it would not fully close it. Holding constant<br />
<strong>the</strong> distribution of aid between low-income and<br />
67. <strong>Chapter</strong> 4 shows<br />
that aid commitments to<br />
basic education in 2006<br />
and 2007 averaged<br />
US$4.9 billion (see<br />
Figure 4.7). The lowincome<br />
countries<br />
included in <strong>the</strong> costing<br />
exercise received 55%<br />
of <strong>the</strong>se commitments.<br />
130
PROGRESS TOWARDS THE <strong>EFA</strong> GOALS<br />
Estimating <strong>the</strong> cost of achieving Education for All<br />
middle-income countries, and between different<br />
levels of education, full delivery of <strong>the</strong> 2005<br />
commitments would leave a deficit of US$11 billion<br />
(Figure <strong>2.</strong>49). That scenario points to <strong>the</strong> case for<br />
an urgent reassessment of aid commitments<br />
and distribution patterns. With an international<br />
summit on <strong>the</strong> Millennium Development Goals<br />
planned for 2010, donors should as a matter of<br />
urgency convene a pledging conference to close<br />
<strong>the</strong> Education for All financing gap.<br />
Conclusion<br />
The limitations and uncertainties associated<br />
with global financial costing models have to be<br />
acknowledged. Yet <strong>the</strong> results of <strong>the</strong> exercise<br />
set out here provide a clear warning sign. In <strong>the</strong><br />
absence of an urgent, concerted effort to make<br />
new and additional resources available for<br />
education, <strong>the</strong>re is little prospect of <strong>the</strong> world’s<br />
poorest countries getting on track to meet <strong>the</strong> 2015<br />
targets. If <strong>the</strong> policy goal is to ensure that all <strong>the</strong><br />
world’s primary school age children are in<br />
education systems by 2015, <strong>the</strong> investment cannot<br />
be delayed. The global costing exercise underlines<br />
<strong>the</strong> importance of low-income developing countries<br />
and donors doing far more. However, <strong>the</strong> role<br />
of donors is critical because governments in<br />
<strong>the</strong> poorest countries lack <strong>the</strong> resources to<br />
close <strong>the</strong> Education for All financing gap.<br />
131