Chapter 2. Progress towards the EFA goals - Unesco
Chapter 2. Progress towards the EFA goals - Unesco
Chapter 2. Progress towards the EFA goals - Unesco

Create successful ePaper yourself
Turn your PDF publications into a flip-book with our unique Google optimized e-Paper software.
0<br />
0<br />
1<br />
CHAPTER 2<br />
2<br />
Education for All Global Monitoring Report<br />
Since 1999,<br />
sub-Saharan<br />
Africa and South<br />
and West Asia<br />
have increased<br />
net enrolment<br />
ratios at five<br />
times and three<br />
times <strong>the</strong> rate<br />
of <strong>the</strong> 1990s,<br />
respectively<br />
For all its limitations, <strong>the</strong> net enrolment ratio is<br />
useful in providing an average picture of progress<br />
over time. That picture has been positive since<br />
<strong>the</strong> Dakar forum. Most developing countries that<br />
started <strong>the</strong> current decade a long way from<br />
universal primary enrolment have made significant<br />
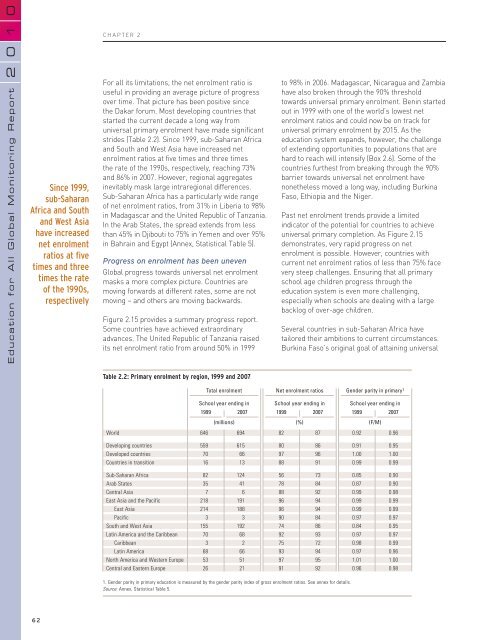
strides (Table <strong>2.</strong>2). Since 1999, sub-Saharan Africa<br />
and South and West Asia have increased net<br />
enrolment ratios at five times and three times<br />
<strong>the</strong> rate of <strong>the</strong> 1990s, respectively, reaching 73%<br />
and 86% in 2007. However, regional aggregates<br />
inevitably mask large intraregional differences.<br />
Sub-Saharan Africa has a particularly wide range<br />
of net enrolment ratios, from 31% in Liberia to 98%<br />
in Madagascar and <strong>the</strong> United Republic of Tanzania.<br />
In <strong>the</strong> Arab States, <strong>the</strong> spread extends from less<br />
than 45% in Djibouti to 75% in Yemen and over 95%<br />
in Bahrain and Egypt (Annex, Statistical Table 5).<br />
<strong>Progress</strong> on enrolment has been uneven<br />
Global progress <strong>towards</strong> universal net enrolment<br />
masks a more complex picture. Countries are<br />
moving forwards at different rates, some are not<br />
moving – and o<strong>the</strong>rs are moving backwards.<br />
Figure <strong>2.</strong>15 provides a summary progress report.<br />
Some countries have achieved extraordinary<br />
advances. The United Republic of Tanzania raised<br />
its net enrolment ratio from around 50% in 1999<br />
to 98% in 2006. Madagascar, Nicaragua and Zambia<br />
have also broken through <strong>the</strong> 90% threshold<br />
<strong>towards</strong> universal primary enrolment. Benin started<br />
out in 1999 with one of <strong>the</strong> world’s lowest net<br />
enrolment ratios and could now be on track for<br />
universal primary enrolment by 2015. As <strong>the</strong><br />
education system expands, however, <strong>the</strong> challenge<br />
of extending opportunities to populations that are<br />
hard to reach will intensify (Box <strong>2.</strong>6). Some of <strong>the</strong><br />
countries fur<strong>the</strong>st from breaking through <strong>the</strong> 90%<br />
barrier <strong>towards</strong> universal net enrolment have<br />
none<strong>the</strong>less moved a long way, including Burkina<br />
Faso, Ethiopia and <strong>the</strong> Niger.<br />
Past net enrolment trends provide a limited<br />
indicator of <strong>the</strong> potential for countries to achieve<br />
universal primary completion. As Figure <strong>2.</strong>15<br />
demonstrates, very rapid progress on net<br />
enrolment is possible. However, countries with<br />
current net enrolment ratios of less than 75% face<br />
very steep challenges. Ensuring that all primary<br />
school age children progress through <strong>the</strong><br />
education system is even more challenging,<br />
especially when schools are dealing with a large<br />
backlog of over-age children.<br />
Several countries in sub-Saharan Africa have<br />
tailored <strong>the</strong>ir ambitions to current circumstances.<br />
Burkina Faso’s original goal of attaining universal<br />
Table <strong>2.</strong>2: Primary enrolment by region, 1999 and 2007<br />
Total enrolment<br />
Net enrolment ratios Gender parity in primary 1<br />
World<br />
Developing countries<br />
Developed countries<br />
Countries in transition<br />
Sub-Saharan Africa<br />
Arab States<br />
Central Asia<br />
East Asia and <strong>the</strong> Pacific<br />
East Asia<br />
Pacific<br />
South and West Asia<br />
Latin America and <strong>the</strong> Caribbean<br />
Caribbean<br />
Latin America<br />
North America and Western Europe<br />
Central and Eastern Europe<br />
School year ending in School year ending in School year ending in<br />
1999<br />
2007<br />
1999 2007 1999<br />
2007<br />
(millions)<br />
(%) (F/M)<br />
646 694 82 87 0.92 0.96<br />
559 615 80 86 0.91 0.95<br />
70 66 97 96 1.00 1.00<br />
16 13 88 91 0.99 0.99<br />
82 124 56 73 0.85 0.90<br />
35 41 78 84 0.87 0.90<br />
7 6 88 92 0.99 0.98<br />
218 191 96 94 0.99 0.99<br />
214 188 96 94 0.99 0.99<br />
3 3 90 84 0.97 0.97<br />
155 192 74 86 0.84 0.95<br />
70 68 92 93 0.97 0.97<br />
3 2 75 72 0.98 0.99<br />
68 66 93 94 0.97 0.96<br />
53 51 97 95 1.01 1.00<br />
26 21 91 92 0.96 0.98<br />
1. Gender parity in primary education is measured by <strong>the</strong> gender parity index of gross enrolment ratios. See annex for details.<br />
Source: Annex, Statistical Table 5.<br />
62