Chapter 2. Progress towards the EFA goals - Unesco
Chapter 2. Progress towards the EFA goals - Unesco
Chapter 2. Progress towards the EFA goals - Unesco

Create successful ePaper yourself
Turn your PDF publications into a flip-book with our unique Google optimized e-Paper software.
PROGRESS TOWARDS THE <strong>EFA</strong> GOALS<br />
Youth and adult literacy<br />
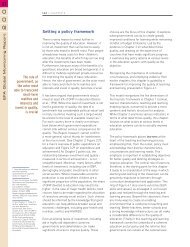
Figure <strong>2.</strong>30: In developing countries, illiteracy can affect<br />
from one to three out of four adults<br />
Adult (15 and over) illiteracy rates in countries with rates of 25%<br />
or more in selected regions, 2000–2007 1<br />
Arab States (19)<br />
Iraq<br />
Egypt<br />
Sudan* ,2<br />
Yemen<br />
Mauritania<br />
Morocco<br />
India<br />
Nepal<br />
Pakistan*<br />
Bangladesh<br />
Bhutan*<br />
Afghanistan*<br />
Kenya*<br />
Uganda<br />
U. R. Tanzania<br />
Nigeria<br />
Malawi<br />
Madagascar*<br />
Zambia<br />
Cameroon*<br />
Angola*<br />
D. R. Congo*<br />
Ghana<br />
Rwanda*<br />
Eritrea<br />
Burundi*<br />
Liberia<br />
Togo *<br />
Côte d’Ivoire*<br />
C. A. R. *<br />
Mozambique<br />
Senegal*<br />
Benin<br />
Sierra Leone<br />
Ethiopia<br />
Chad<br />
Guinea*<br />
Burkina Faso*<br />
Niger*<br />
Mali*<br />
South and West Asia (9)<br />
Sub-Saharan Africa (41)<br />
0 10 20 30 40 50 60 70 80<br />
Adult illiteracy rates (%)<br />
Regional<br />
average<br />
29%<br />
Regional<br />
average<br />
36%<br />
Regional<br />
average<br />
38%<br />
Notes: For countries indicated with *, national observed literacy data are used.<br />
For all o<strong>the</strong>rs, UIS literacy estimates are used. The estimates were generated using<br />
<strong>the</strong> UIS Global Age-specific Literacy Projections model. Figures in paren<strong>the</strong>ses after<br />
region names indicate <strong>the</strong> number of countries with publishable data in <strong>the</strong> region.<br />
1. Data are for <strong>the</strong> most recent year available during <strong>the</strong> period specified. See <strong>the</strong><br />
web version of <strong>the</strong> introduction to <strong>the</strong> statistical tables for a broader explanation<br />
of national literacy definitions, assessment methods, and sources and years of data.<br />
<strong>2.</strong> Data do not include all geographic regions.<br />
Source: Annex, Statistical Table <strong>2.</strong><br />
<strong>the</strong> number of adult illiterates in <strong>the</strong> world fell by<br />
13%. Given that population growth pushed <strong>the</strong> adult<br />
population up by around 30% in <strong>the</strong> same period,<br />
<strong>the</strong> net effect is clearly positive. Adult literacy levels<br />
increased more rapidly than in <strong>the</strong> 1990s (Qiao,<br />
2007), growing by 10% to reach 84% in 2000-2007.<br />
Box <strong>2.</strong>20: A new generation of literacy statistics<br />
New approaches to literacy measurement are attempting<br />
to address long-standing data problems. One prominent<br />
example is <strong>the</strong> Literacy Assessment and Monitoring<br />
Programme (LAMP).<br />
Conventional approaches to literacy measurement are often<br />
fundamentally flawed. Asking people to report whe<strong>the</strong>r <strong>the</strong>y<br />
are literate is of limited use in assessing real capabilities.<br />
Similarly, testing literacy by reference to words, objects and<br />
experiences that have no relevance in <strong>the</strong> lives of <strong>the</strong> people<br />
being surveyed can understate achievement levels.<br />
The LAMP approach tests literacy in three domains:<br />
continuous texts (prose), non-continuous texts (documents)<br />
and numeracy. Results reflect a continuum of achievement,<br />
and <strong>the</strong> tests are designed to be meaningful to respondents.<br />
Data generated through <strong>the</strong> tests are intended for national<br />
and cross-national comparisons. Developed by <strong>the</strong> UIS<br />
and administered through ministries of education, LAMP<br />
surveys are in <strong>the</strong> pilot stage in several countries.<br />
Sources: UIS (2009c, 2009d).<br />
The broadly positive global canvas hides some<br />
less encouraging developments (Figure <strong>2.</strong>31).<br />
Almost all <strong>the</strong> decline in <strong>the</strong> number of illiterate<br />
adults in <strong>the</strong> developing world took place in just<br />
one region, East Asia and <strong>the</strong> Pacific. In South<br />
and West Asia, population growth cancelled<br />
out <strong>the</strong> decline in numbers of illiterate adults.<br />
In sub-Saharan Africa, <strong>the</strong> number of illiterates<br />
increased by 19.5 million. The Arab States also<br />
experienced an increase. Some countries<br />
witnessed large absolute increases in <strong>the</strong><br />
number of illiterate adults: over 1 million in<br />
Burkina Faso, <strong>the</strong> Philippines, Senegal, <strong>the</strong><br />
United Republic of Tanzania and Viet Nam,<br />
and 4 million in Bangladesh and Ethiopia<br />
(see annex, Statistical Table 2).<br />
The idea that countries are powerless to<br />
combat adult illiteracy is refuted by <strong>the</strong><br />
experience of countries that have achieved rapid<br />
progress. The following are examples of positive<br />
change between 1985–1994 and 2000–2007:<br />
Much of <strong>the</strong> illiteracy reduction in East Asia<br />
can be traced to China. The number of<br />
adult illiterates <strong>the</strong>re fell by 114 million<br />
or 62% between <strong>the</strong> two periods, with an<br />
average increase in <strong>the</strong> number of adult<br />
literates of 4 million between 1990 and 2000<br />
(NCEDR, 2008).<br />
Adult literacy<br />
levels grew by<br />
10% to reach 84%<br />
in 2000-2007<br />
97