Chapter 2. Progress towards the EFA goals - Unesco
Chapter 2. Progress towards the EFA goals - Unesco
Chapter 2. Progress towards the EFA goals - Unesco

You also want an ePaper? Increase the reach of your titles
YUMPU automatically turns print PDFs into web optimized ePapers that Google loves.
PROGRESS TOWARDS THE <strong>EFA</strong> GOALS<br />
Estimating <strong>the</strong> cost of achieving Education for All<br />
Estimating <strong>the</strong> financing gap —<br />
and measures to close it<br />
The cost of achieving <strong>the</strong> internationally agreed<br />
Education for All <strong>goals</strong> has to be assessed against<br />
<strong>the</strong> financing available. National budgets are <strong>the</strong><br />
primary source of education financing. As <strong>the</strong><br />
Expanded Commentary on <strong>the</strong> Dakar Framework<br />
for Action recognized, developing countries will<br />
have to do far more to make resources available<br />
by ‘increasing <strong>the</strong> share of national income and<br />
budgets allocated to education and, within that,<br />
to basic education’ (para. 46). Over and above<br />
<strong>the</strong>se broad commitments, action is needed to<br />
streng<strong>the</strong>n <strong>the</strong> efficiency and equity of education<br />
spending, and to curb <strong>the</strong> diversion of resources<br />
associated with corruption.<br />
Most of <strong>the</strong> countries covered in <strong>the</strong> costing<br />
analysis have <strong>the</strong> capacity to increase domestic<br />
spending on basic education. Increased<br />
government revenue, stronger budget commitment<br />
and redistribution within <strong>the</strong> education budget all<br />
have a role to play. But even with a stronger<br />
domestic effort, many countries will be unable to<br />
finance all <strong>the</strong> investment required. The analysis<br />
for this Report estimates <strong>the</strong> Education for All<br />
financing gap as <strong>the</strong> difference between <strong>the</strong> total<br />
investment requirement indicated by <strong>the</strong> costing<br />
exercise and <strong>the</strong> domestic financing capacity of<br />
governments making a ‘best effort’ to channel<br />
resources to education.<br />
National governments can raise a substantial<br />
share of <strong>the</strong> additional resources needed<br />
Alongside national income, <strong>the</strong> domestic resource<br />
envelope available for public financing of <strong>the</strong><br />
Education for All <strong>goals</strong> is ultimately determined<br />
by three factors. The first is <strong>the</strong> share of national<br />
income collected as government revenue. That<br />
share rises on average with <strong>the</strong> level of per capita<br />
income, albeit with large variations by country that<br />
reflect policies on taxation, <strong>the</strong> level of natural<br />
resource exports and o<strong>the</strong>r national characteristics.<br />
The second factor is <strong>the</strong> proportion of revenue<br />
directed into <strong>the</strong> overall education budget. The third<br />
is <strong>the</strong> share of <strong>the</strong> education budget allocated to<br />
basic education. The proportion of national income<br />
directed <strong>towards</strong> basic education provides a<br />
summary overview of <strong>the</strong> level of public basic<br />
education financing.<br />
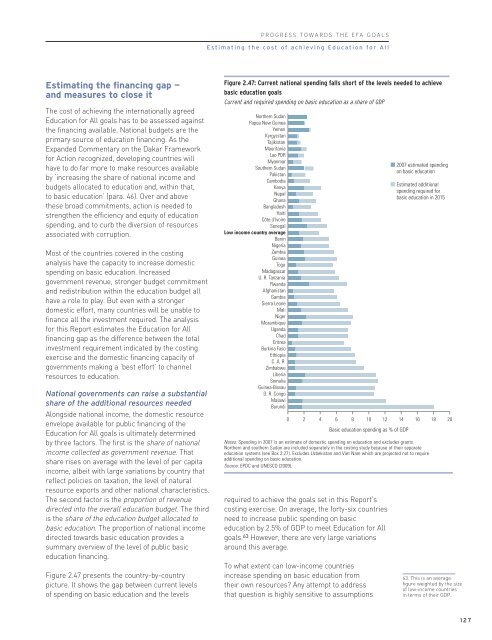
Figure <strong>2.</strong>47 presents <strong>the</strong> country-by-country<br />
picture. It shows <strong>the</strong> gap between current levels<br />
of spending on basic education and <strong>the</strong> levels<br />
Figure <strong>2.</strong>47: Current national spending falls short of <strong>the</strong> levels needed to achieve<br />
basic education <strong>goals</strong><br />
Current and required spending on basic education as a share of GDP<br />
Nor<strong>the</strong>rn Sudan<br />
Papua New Guinea<br />
Yemen<br />
Kyrgyzstan<br />
Tajikistan<br />
Mauritania<br />
Lao PDR<br />
Myanmar<br />
Sou<strong>the</strong>rn Sudan<br />
Pakistan<br />
Cambodia<br />
Kenya<br />
Nepal<br />
Ghana<br />
Bangladesh<br />
Haiti<br />
Côte d’Ivoire<br />
Senegal<br />
Low income country average<br />
Benin<br />
Nigeria<br />
Zambia<br />
Guinea<br />
Togo<br />
Madagascar<br />
U. R. Tanzania<br />
Rwanda<br />
Afghanistan<br />
Gambia<br />
Sierra Leone<br />
Mali<br />
Niger<br />
Mozambique<br />
Uganda<br />
Chad<br />
Eritrea<br />
Burkina Faso<br />
Ethiopia<br />
C. A. R.<br />
Zimbabwe<br />
Liberia<br />
Somalia<br />
Guinea-Bissau<br />
D. R. Congo<br />
Malawi<br />
Burundi<br />
0 2 4 6 8 10 12 14 16 18 20<br />
Basic education spending as % of GDP<br />
required to achieve <strong>the</strong> <strong>goals</strong> set in this Report’s<br />
costing exercise. On average, <strong>the</strong> forty-six countries<br />
need to increase public spending on basic<br />
education by <strong>2.</strong>5% of GDP to meet Education for All<br />
<strong>goals</strong>. 63 However, <strong>the</strong>re are very large variations<br />
around this average.<br />
To what extent can low-income countries<br />
increase spending on basic education from<br />
<strong>the</strong>ir own resources? Any attempt to address<br />
that question is highly sensitive to assumptions<br />
2007 estimated spending<br />
on basic education<br />
Estimated additional<br />
spending required for<br />
basic education in 2015<br />
Notes: Spending in 2007 is an estimate of domestic spending on education and excludes grants.<br />
Nor<strong>the</strong>rn and sou<strong>the</strong>rn Sudan are included separately in <strong>the</strong> costing study because of <strong>the</strong>ir separate<br />
education systems (see Box <strong>2.</strong>27). Excludes Uzbekistan and Viet Nam which are projected not to require<br />
additional spending on basic education.<br />
Source: EPDC and UNESCO (2009).<br />
63. This is an average<br />
figure weighted by <strong>the</strong> size<br />
of low-income countries<br />
in terms of <strong>the</strong>ir GDP.<br />
127